
 ?Mathematical formulae have been encoded as MathML and are displayed in this HTML version using MathJax in order to improve their display. Uncheck the box to turn MathJax off. This feature requires Javascript. Click on a formula to zoom.
Abstract
Nanoscale alloying and phase transformations in physical mixtures of Pd and Cu ultrafine nanoparticles are investigated in real time with in situ synchrotron-based x-ray diffraction complemented by ex situ high-resolution transmission electron microscopy. The combination of metal–support interaction and reactive/non-reactive environment was found to determine the thermal evolution and ultimate structure of this binary system. At 300 °C, the nanoparticles supported on silica and carbon black intermix to form a chemically ordered CsCl-type (B2) alloy phase. The B2 phase transforms into a disordered fcc alloy at higher temperature (> 450 °C). The alloy nanoparticles supported on silica and carbon black are homogeneous in volume, but evidence was found of Pd surface enrichment. In sharp contrast, when supported on alumina, the two metals segregated at 300 °C to produce almost pure fcc Cu and Pd phases. Upon further annealing of the mixture on alumina above 600 °C, the two metals interdiffused, forming two distinct disordered alloys of compositions 30% and 90% Pd. The annealing atmosphere also plays a major role in the structural evolution of these bimetallic nanoparticles. The nanoparticles annealed in forming gas are larger than the nanoparticles annealing in helium due to reduction of the surface oxides that promotes coalescence and sintering.
Introduction
The study of multi-metallic nanoparticles is an active area of research due to the flexibility to tune nanoparticle properties for various applications through manipulation of their structure and composition. Metallic nanomaterials have a wide range of applications from electronics to catalysis. In particular, the surface structure, composition distribution, and ordering properties of nanoscale alloys are of interest as they play a major role in determining the chemical reactivity and selectivity of nanoparticle catalysts. To date, widespread commercialization of fuel cells is hindered by the high cost of the platinum catalysts. Nanoalloy catalysts are promising alternatives to bulk noble metal catalysts like Pt and Au. Pd has lower activity when used as a catalyst in fuel cells, but when combined with transition metals the resulting alloy activity becomes comparable with that of Pt-based catalysts [Citation1]. The influence of metals such as Fe, Cu, Co, Mn, and Mo on the catalytic performance of Pd in many chemical reactions was reviewed by Coq and Figueras [Citation2] and Wang et al [Citation3]. Bimetallic Pd nanoparticles have also been found to be good catalysts in hydrogenation reactions and as hydrogen-storage materials [Citation4]. Interestingly, the Pd/Cu alloys were found to be resistant to H2S poisoning when they have an fcc structure. Pd membranes also enhance efficiency and reduce costs in the coal-gasification process [Citation4]. Finally, PdCu alloys have applications in oxygen-assisted water gas shift reactions [Citation5] and selective hydrogenation of dienes [Citation6].
Thermal annealing is an important step for the activation and stabilization of nanoscale catalysts. Since catalytic activity is promoted by active sites that in turn can be controlled by size, morphology, and composition distribution, to enhance the electrochemical activity the nanocatalysts are typically heat treated in various atmospheres. At high temperature, the nanostructures undergo phase reconstructions and phase transformations as well as morphological and size changes that result in modified electronic band structures. In particular, the alloy formation, composition, and structure are dictated by this post-preparation treatment. Alloying has been studied extensively in bulk multi-metallic systems. However, alloying is not fully understood in nanoparticle systems. Oftentimes, annealing of nanoparticles leads to limited alloy uniformity and the presence of multiple alloy phases. The alloy phases become more uniform with longer annealing times and higher temperature, but the process is typically accompanied by inevitable sintering, resulting in larger particle size.
The alloying process depends mainly on composition and temperature. In the case of multi-metallic nanoparticles, however, the synthesis method was also found to play a major role for catalysis properties. For example, carbon-supported PdCu bimetallic nanoparticles with composition ratios ranging from 1:9 to 9:1 synthesized by co-impregnation were surveyed by Wang et al in the temperature range 300 °C to 800 °C [Citation3]. They reported the highest electrochemical activity for molar ratios of 1:1 and 1:3 heat treated at 600 °C. Kairuki et al [Citation7] explored organic monolayer stabilized alloy PdCu nanoparticles having a composition ratio of 1:1 and 1:3 synthesized by the colloidal preparation method. The random solid solution alloy structure for a bimetallic composition of Pd:Cu = 1:1 exhibited higher mass activity for electrochemical oxidation of methanol. The (1:1) PdCu/C mass activity was also found to increase with the increase in heat treatment and particle size. In a recent study [Citation8], as-synthesized PdCu nanoparticles supported on carbon were also shown to exhibit enhanced electrocatalytic activity in alkaline electrolyte in comparison with pure Pd. The observed difference of the electrocatalytic properties was attributed to the surface enrichment of Pd on the alloyed PdCu surface [Citation8].
A review of the literature shows that the nanoparticle structure is sensitive not only to composition, temperature, and preparation technique but also to annealing atmosphere. Using high-angle annular dark-field scanning transmission electron microscopy (HAADF-STEM), Yin et al [Citation9] found that Pd85Cu15/C nanoparticles are crystalline with a random solid-solution structure, while Pd39Cu61/C nanoparticles have a chemically ordered PdCu structure along the [110] axis after annealing at 400 °C in an inert atmosphere. Using TEM and extended x-ray absorption fine structure (EXAFS), Mattei et al [Citation10] studied the 3:1 Pd:Cu solid solution obtained by sequential ion implantation in silica in selected atmospheres of air and forming gas. They identified migration of Pd atoms to the surface and formation of large clusters when the material was annealed in a reducing atmosphere. When the nanoclusters are annealed in air, Cu oxidizes to CuO and forms a partial shell around a Pd-rich core. The atomic ratio of Pd/Cu was also found to depend on the implantation range.
Last but not least, the structure of nanosized bimetallic nanoparticles depends on the nature of the support. Supported metal particles are ideal candidates for investigating support-related properties and effects. The support–nanoalloy interaction influences structural and chemical ordering in the nanoparticles and may influence the formation of active sites on the nanoalloys for catalysis. Strukul et al [Citation11] reported on the activity of Pd on Cu-alumina supports. Sun et al [Citation12] used electron energy loss spectroscopy (EELS) and energy dispersive x-ray spectroscopy (EDX) combined with STEM to conclude that the final structure is dependent on metal loading and specific reduction processes. They had studied the PdCu nanoparticles at 523 K, 773 K, and 1073 K, and there was no evidence of formation of the expected ordered B2 phase. At 523 K and 773 K, the nanoparticles had compositions ranging from pure Pd to PdCu alloys. On further reduction at 1073 K, PdCu alloys with either Pd- or Cu-rich surfaces were formed.
Considerable work has been done to study the structural evolution of PdCu alloy nanoparticles. This paper focuses on nanoscale alloying via thermal evolution of mixtures of ultrafine Pd and Cu precursor nanoparticles. The Pd:Cu molar ratio is nominally 1:1, and the temperature range monitored is 25 °C–700 °C. The fast phase transformations at the nanoscale are probed with synchrotron-based in situ x-ray diffraction (XRD). We have previously demonstrated the utility of this technique for unraveling the phase and morphological transformations in other binary and ternary nanoparticles including AuPt, PtNiCo, and AuCu [Citation13–Citation15]. The XRD experiments are complemented with ex situ transmission electron microscopy. The nanoscale alloying and the time evolution of Pd:Cu nanoparticles mixtures on various surfaces (SiO2/Si, carbon, and alumina) are examined in helium and forming gas atmospheres. Recently, we reported the structural evolution of Pd:Cu nanoparticle mixtures dispersed on carbon [Citation16]. The structural evolution of Pd:Cu nanoparticle mixtures dispersed on SiO2/Si and carbon annealed in helium and forming gas were qualitatively similar in nature. The Pd and Cu nanoparticle mixtures were found to form an ordered alloy phase with CsCl-type (B2) structure upon annealing at 300 °C. When annealed at 700 °C, the nanoparticles undergo a phase transformation from B2 to a disordered fcc structure. Surprisingly, though, the evolution of the nanoparticle mixture follows a different path for mixtures dispersed on alumina. In the latter case, the two metals segregate into Cu- and Pd-rich domains at 300 °C, and the B2 alloy structure was absent throughout the annealing process. Upon annealing at higher temperature, the two metals inter-diffused to form disordered alloys.
Experimental section
Synthesis
The organic-monolayer–capped ultrafine metal nanoparticles were synthesized by a combination of reduction/decomposition and thermal processing using metal precursors, reducing agents, and capping agents. The Pd and Cu nanoparticles capped with decanthiolate monolayers were synthesized separately according to the techniques detailed in [Citation15, Citation17, Citation18] and the references therein.
Copper nanoparticles
The synthesis of decanethiolate-capped Cu nanoclusters was recently described [Citation15, Citation17]. In the modified synthesis, CuCl2 was dissolved in water (40 mM) in the presence of 430 mM of potassium bromide to convert Cu2+ to CuBr4 2−. This solution was then mixed with a solution of tetraoctylammonium bromide (TOABr) in toluene (40 mL toluene, 1 g TOABr) under vigorous stirring to induce a phase transfer of the CuBr4 2− from the aqueous phase to the organic phase. After stirring for 45 min, the aqueous solution was removed, leaving a deep maroon-colored organic phase. The copper toluene solution was stirred under an argon purge to eliminate all oxygen from the system. After purging for 30 min, 1.0 mL of decanethiol was added, causing the solution color to change from maroon to clear. Next, 10 mL of a solution of sodium borohydride in water (1 M) was added drop-wise to the solution. The solution became a deep cloudy orange, indicating the formation of copper nanoparticles. The solution was stirred under argon for 2 h. After removing the water layer, the Cu nanoparticles in the toluene phase were collected for further experiments.
Palladium nanoparticles
The synthesis of palladium nanoclusters was modified from Murry’s protocol [Citation18]. Starting from potassium tetracholoropalladate (K2PdCl4; 18 mM) as metal precursor dissolved in H2O, TOABr as the surfactant dissolved in toluene (125 mL toluene, 0.38 g TOABr) was added into the solution. After 15–20 min stirring, PdCl4 2− showing as deep red was transferred into the toluene phase, followed by the H2O layer removal, 0.4 mL decanethiol was added to the toluene solution, turning the deep red to an orange color. Then 10 mL of a 0.45 M solution of NaBH4 in water was added drop-wise to the solution. The Pd nanoparticles in the toluene phase were collected after stirring overnight.
Nanoparticle mixtures
The sizes of the as-prepared Pd and Cu nanoparticles measured with TEM were 1.8 ± 0.2 nm and 0.7 ± 0.2 nm, respectively. These Pd and Cu nanoparticles were extracted in an organic solvent like toluene. Inductively coupled plasma atomic emission spectroscopy (ICP-AES) analysis revealed the composition of the as prepared mixture to be 34% (Pd) to 66% (Cu). The nanoparticle mixtures were then dispersed on various substrates: 0.5 μm thick thermal SiO2 film on Si (100) wafer (referred to as SiO2/Si substrate), carbon black powder, and alumina membranes, then dried in air. The carbon black powder and alumina membranes were then mounted on SiO2/Si substrates for the XRD measurements. This was followed by heat treatment and in situ measurements of the nanoparticle evolution. We expect that most of the organic material evaporates while the samples are being annealed at temperatures above 200 °C.
Instrumentation and measurements
The structural evolution of Pd:Cu nanoparticle mixtures was studied with in situ synchrotron-based x-ray diffraction and ex situ transmission electron microscopy to extract structural parameters such as size, and composition.
In situ real-time x-ray diffraction
The main experimental technique used to study the structural evolution of the physical mixture of Pd and Cu nanoparticles is synchrotron-based in situ real-time XRD. Conventional lab-based XRD can give information on the atomic structure and particle size, but it requires extremely long acquisition time to study the effects of the annealing on the structure of metal nanoparticles. The high x-ray flux of synchrotron sources enables high-quality time-resolved x-ray diffraction experiments. These experiments provide insight into the formation of various crystallographic phases and particle sizes in small volumes of nanomaterials. On a fundamental level, they provide information on the details of structural evolution, the processes of metal nanoparticle coalescence, and the effects of substrates on the nanoparticles. Our experiments were performed at the beamline X20C at the National Synchrotron Light Source at Brookhaven National Laboratory. The energy of the x-rays is 6.9 keV (1.79 Å wavelength). This beamline is equipped with a custom vacuum chamber and linear position-sensitive detector. Additional capabilities include a rapid thermal annealing stage in a continuous flow of high-purity helium gas or forming gas (5.17% H2 in N2). A linear position-sensitive detector was used to record the XRD pattern around the face-centered cubic (111) and (200) peaks (45°–60° angular range) with two-second time resolution. The nanoparticle mixtures dispersed on carbon powder, 0.5 μm-thick SiO2 layer, and alumina membranes were supported by a Si (100) wafer that was held in place with four pins on a molybdenum sample holder. High vacuum was first established in the sample chamber at the beginning of the experiments to remove all oxygen, and then the chosen gas was continuously flowed. Various thermal treatments are made possible by a Eurotherm programmable temperature controller measuring the temperature of the sample holder with a thermocouple. The annealing protocol was carried out in two steps: (a) isothermal annealing at 300 °C, in which case the temperature of the sample is increased from 25 °C to 300 °C with a high heating rate (1000 °C min−1) at time t = 0 s and is then maintained at the final temperature for 10 min, and (b) ramped annealing from 300 °C to 700 °C with a heating rate of 40 °C min−1 starting at time t = 0 s. Each of the annealing cycles lasted for ten minutes. Before and after each thermal treatment θ–2θ scans were recorded in the 20°–60° angular range at room temperature. The data was extracted and fitted with a series of Lorentzian curves to calculate the lattice parameter, the average coherent grain size (using the Debye–Scherrer formula [Citation19]), and the integrated intensity as a measure of the phase volume. The lattice parameters of each of the phases were calculated from the θ–2θ scans done after the samples were quenched back to room temperature from 300 °C and 700 °C.
Transmission electron microscopy was carried out using a FEI Titan TEM at Purdue University with an acceleration voltage of 300 kV and with sub-0.24 nm point-to-point resolution. The nanoparticle mixtures were first thermally treated during our in situ synchrotron XRD studies, detailed above. These nanoparticles were removed from substrates by suspension in hexane and dispersed on ultra-thin carbon film-coated copper grids and air dried at room temperature. The image files were processed using Image J software for the purpose of determining particle size distribution and obtaining lattice parameters. The bright field imaging was carried out with 125 000–250 000 magnification, while the high-resolution images were taken at 400 000–1 000 000 magnification. A fast Fourier transform (FFT) algorithm applied to high-resolution images was used to calculate lattice spacings and lattice parameters. The FFT images were compared with simulated diffraction patterns using SingleCrystal, a software package by Crystalmaker.
HAADF-STEM observations were carried out using a probe-corrected Hitachi HD 2700 C at the Center for Functional Nanomaterials (CFN) at Brookhaven National Laboratory. The STEM images were acquired at 200 kV with a spatial resolution of 1.4 Å. The microscope has a cold field emission electron source and a high-resolution Gatan Enfina energy loss spectrometer. EDX analysis was carried out in the analytical probe mode. Palladium and copper maps were acquired using the x-ray energy emission lines corresponding to Lα of Pd (2830 eV) and Kα of Cu (8030 eV).
Results
First, we present results for control samples of pure Pd and pure Cu nanoparticle samples supported on SiO2/Si; then we describe the behavior of Pd:Cu nanoparticle mixtures on different substrates and annealed in different atmospheres.
Control samples
The palladium nanoparticles are expected to coalesce and sinter to form bigger particles when annealed at high temperatures, similar to the behavior observed for Au and Pt nanoparticles [Citation13, Citation15]. The smaller Cu nanoparticles, on the other hand, react with the alkanetiolate capping agent (dodecanethiol) to form Cu2S nanodisks when annealed at relatively low temperature (∼140 °C) [Citation17].
Pd nanoparticles
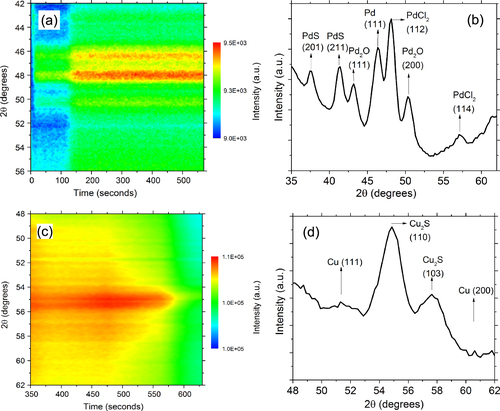
To study the behavior of single-metal Pd nanoparticles, these particles were dispersed on SiO2/Si substrates and isothermally annealed at 500 °C in helium gas. The Pd nanoparticles were found to form larger Pd nanoparticles and a few compounds, as shown in figure . The peak at 46.4° corresponds to the Pd (111) reflection. A survey of the θ–2θ scan shown in figure (b) done after annealing at 500 °C suggests the formation of palladium sulfide (PdS), palladium oxide (Pd2O), and palladium chloride (PdCl2). The peaks at 43.2° and 50.3° correspond to the (111) and (200) reflections of Pd2O. Pd2O has a cubic structure with Pd occupying the corner of the cube while O atoms occupy the face centers. The calculated value of the lattice parameter of 4.22 ± 0.01 Å was similar, with the value for bulk Pd2O 4.28 Å reported in the literature [Citation20]. The data was also checked for the formation of the more common palladium (II) oxide (PdO), but none of the reflections in our data matched the expected PdO reflections. The peaks at 37.6° and 41.4° correspond to the PdS (201) and (211) planes, respectively, with a P42/m (tetragonal) space group and a lattice parameter of 6.2 Å that is consistent with expectations [Citation21]. The remaining reflections at 48.1° and 57.3° likely correspond to the (112) and (114) planes of the PdCl2 that has octahedral structure with Pnmn space group [Citation21] and a lattice parameter of 3.81 Å. The formation of Pd2O and PdS is likely due to the proximity reaction of Pd atoms with the capping molecules containing oxygen and sulfur. However, the formation of PdCl2 is likely due to the presence of residual Cl from the metal precursor potassium tetrachloropalladate used to synthesize the Pd nanoparticles.
Figure 1 (a) Color map of the XRD intensity evolution for Pd nanoparticles annealed at 500 °C on SiO2/Si support in a helium atmosphere. (b) θ–2θ XRD scan after the thermal treatment of Pd nanoparticles in (a). (c) Color map of the XRD intensity evolution of Cu nanoparticles dispersed on SiO2/Si ramped annealed from 25° to 225 °C in helium gas. (d) θ–2θ XRD scan after the thermal treatment of Cu nanoparticles in (c).
Cu nanoparticles
The Cu nanoparticles on SiO2/Si substrates were monitored during ramp annealing from 25° to 225 °C in helium gas (figure (c)) and were found to form Cu2S nanodisks. The diffraction data reveals peaks at 51.6°, 54.3°, and 57.4°, as shown in figure (d). The peak at 51.6° corresponds to the Cu (111) plane. The peaks at 54.6° and 57.4° correspond to the Cu2S (110) and Cu2S (103) reflections. Mott et al [Citation17] have previously reported that copper nanoclusters synthesized by the two-phase method react with the capping agent, alkanethiolate, to form copper sulfide nanodisks in a thermally activated reaction. A similar behavior was seen in the evolution of the Au–Cu nanoparticle mixtures [Citation15]. Yin et al also observed that TOABr, the phase transfer catalyst, plays a role in the formation of the Cu2S [Citation22].
Pd:Cu nanoparticle mixtures on SiO2/Si
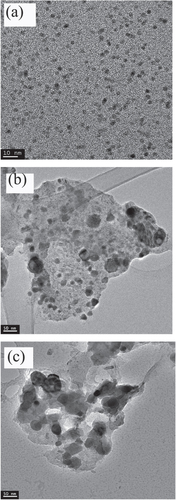
This study focuses on the structural evolution of Pd:Cu nanoparticle mixtures for two steps of thermal treatment: (1) isothermal annealing at 300 °C for ten minutes, and (2) ramp annealing from 300 °C to 700 °C with a heating rate of 40 °C min−1. The evolution route of Pd:Cu nanoparticle mixtures is different from the temperature-induced structural evolution of unary nanoparticles. The as-prepared nanoparticle mixtures have a bimodal distribution peaked at 0.7 ± 0.2 nm and 1.8 ± 0.2 nm measured from counting more than 360 nanoparticles, as shown in figure (a). Based on the information from the control samples, we assume that the smaller and larger sizes correspond to Cu and Pd nanoparticles, respectively. The thermal treatment leads to changes in structure and size. For example, the SiO2/Si supported Pd:Cu nanoparticles have TEM sizes of 11 ± 7 nm after annealing in helium gas at 300 °C for ten minutes, as seen in figure (b). After annealing in helium gas at 700 °C, the analysis of TEM images as shown in figure (c) revealed an average particle size of 24 ± 12 nm.
Figure 2 (a) TEM image of the as-synthesized PdCu nanoparticles mixture (scale bar is 10 nm). (b) TEM image of SiO2/Si-supported PdCu nanoparticles after annealing at 300 °C in helium gas (scale bar is 50 nm). (c) TEM image of SiO2/Si-supported PdCu nanoparticles after annealing to 700 °C in helium gas (scale bar is 50 nm).
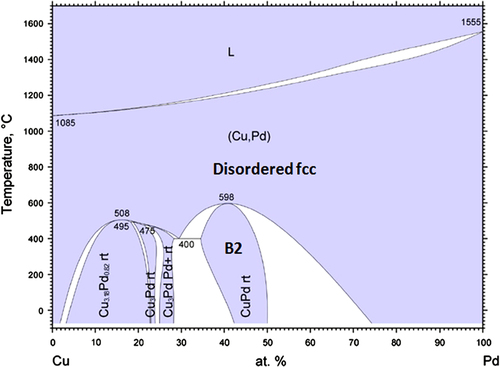
The bulk Pd-Cu system has a complex phase diagram exhibiting several different ordered structures at different compositions [Citation23]. From the phase diagram shown in figure , the Pd-Cu alloys with Pd% between 34% and 50% have an ordered Cs-Cl-type (B2) structure, also known as the β phase, at low temperatures and transform to a disordered fcc alloy at high temperatures. The formation of the B2 phase was reported also for Pd-Cu nanoalloys in several papers [Citation4, Citation7, Citation8, Citation23, Citation24]. If complete alloying occurs in the mixture, we expect, based on the composition established by ICP-AES for the as-synthesized sample, the Pd:Cu physical nanoparticle mixtures to behave as bulk alloys with Pd composition in the range from 34% to 50%.
Figure 3 Phase diagram of bulk Pd-Cu [Citation23]. Reprinted with permission of ASM International. All rights reserved. www.asminternational.org
Annealing in helium gas
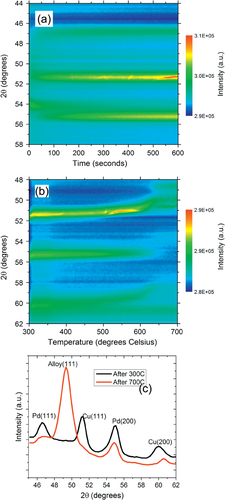
We start by examining the Pd:Cu nanoparticle mixtures dispensed on SiO2/Si substrates and annealed in high-purity helium gas. The analysis focuses on the changes occurring in the XRD peaks present in the angular range of 40° to 60°. This range was chosen in order to monitor the strongest fcc Bragg peaks, (111) and (200). Figures (a) and (b) show the color map of the XRD intensity evolution in this range during the two thermal cycles. Figure (c) shows the expanded range of the θ–2θ scan taken at room temperature after each thermal treatment, highlighting the presence of two structures, the B2 structure and fcc structure after annealing at 300° and up to 700 °C, respectively.
Figure 4 (a) Color map of the XRD intensity evolution for the Pd:Cu nanoparticle mixture on SiO2/Si substrate isothermally annealed at 300 °C in a helium atmosphere showing the formation of the ordered B2 phase. (b) Color map of the XRD intensity evolution of the Pd:Cu nanoparticle mixture on SiO2/Si ramp annealed from 300 °C to 700 °C in a helium atmosphere showing the transformation of the B2 phase into a disordered fcc alloy phase. (c) θ–2θ XRD scans after annealing at 300 °C and 700 °C.
During isothermal annealing of the physical mixture of Pd and Cu nanoparticles at 300 °C, we found a single dominant XRD peak growing at 51°. The fact that only one peak is visible in this range is important, because fcc structures have two peaks in this range corresponding to (111) and (200) reflections. For example, pure Pd nanoparticles have an fcc structure with a lattice parameter of 3.92 Å and exhibit peaks at 46.4° (111) and 54.9° (200) [Citation7], while fcc Cu nanoparticles with a lattice parameter of 3.59 Å exhibit peaks at 51.5° (111) and 60.5° (200) [Citation7]. We attribute the single peak dominating the diffraction pattern in figures (a) and (c) to the (110) reflection of the PdCu alloy B2 phase. The B2 phase has an ordered CsCl-type (B2) structure (space group Pm
) and exhibits a single (110) peak in the monitored angular range (lattice parameter of 2.95 ± 0.15 Å) [Citation24]. Unreacted Cu can be excluded even though the Cu (111) reflection partially overlaps with the B2 (110) reflection because the (200) fcc peak is absent. We also note the presence of other small peaks in the θ–2θ patterns (figure (c)) likely due to Cu2S nanoparticles.
The formation of the ordered PdCu B2 phase during annealing of the nanoparticle mixture at 300 °C (figure (a)) is evidence for alloying of Cu and Pd at the nanoscale. We note that the sample heating starts at time zero and that the temperature stabilizes at 300 °C in less than 20 s. Therefore, most of the transformation occurs at 300 °C, rather than during the initial heating. The B2 phase growth becomes visible a significant time (more than 200 s in this case) after the sample has reached 300°. This incubation time depends on the temperature and atmosphere of the annealing process. During this incubation time, the as-synthesized nanoparticles likely melt and coalesce. Given the small size of the as-synthesized nanoparticles, it is natural to assume that the first step of the process involves melting of the Cu and possibly even of the Pd nanoparticles. Unfortunately, our XRD technique is only sensitive to crystalline phases and does not provide quantitative information about intermediate amorphous or liquid phases. The mixing of the two metals likely occurs through diffusion of Cu from the surface of the larger Pd nanoparticles into their volume in the non-crystalline phase during the incubation time. The B2 phase then nucleates and grows into this non-crystalline alloyed phase.
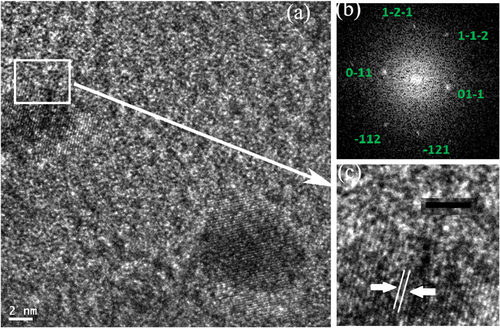
Additional evidence for the formation of the B2 phase was obtained from high-resolution TEM images. Figure shows a PdCu nanoparticle after annealing of the mixture at 300 °C for ten minutes. Fast Fourier transform from the marked particle is indexed as B2 structure with the orientation along [311] zone axis [Citation24].
Figure 5 (a) TEM image of the Pd:Cu nanoparticle mixture after isothermal annealing at 300 °C on SiO2/Si substrate in a helium atmosphere for ten minutes. (b) The FFT from a marked area in (a) is indexed as [311] zone axis of the PdCu B2 alloy phase. (c) High resolution image of the PdCu particle marked in (a) reveals uniform lattice fringes across the particle with an inter-planar distance of 2.14 Å that corresponds to the [110] plane of the B2 phase. Scale bars are 2 nm and 5 nm for images (a) and (c), respectively.
In the second thermal treatment the samples were ramp annealed from 300 °C to 700 °C and a solid-state phase transformation from the ordered B2 to a disordered fcc structure was observed, as shown in figure (b). The transformation is visible between 450 °C and 550 °C, and the XRD data captures the decay and growth with accuracy. The new phase emerging is the disordered fcc alloy characterized by peaks at 50.3° and 58° pertaining to the (111) and (200) reflections, respectively. The lattice parameter from the XRD data was found to be 3.7 ± 0.2 Å, close to the value of 3.7 Å reported by Jones and Owen [Citation25].
The XRD crystalline domain sizes of the PdCu alloy nanoparticles were calculated with the Debye–Scherrer equation from in situ θ–2θ scans measured after each thermal cycle and subsequent cooling to room temperature (figure (c)). The sizes were found to be 9.7 ± 0.5 nm and 14.4 ± 0.7 nm, after annealing at 300 °C and 700 °C, respectively. These values are representative because the XRD sizes do not change significantly after cooling to room temperature. We note that the XRD gives a coherently diffracting domain size that may be different from the particle size determined by TEM. TEM measures particle size, but the particles may consist of one or more crystalline domains. As mentioned above, we estimated an average TEM size of 11 ± 7 nm after annealing at 300 °C (figure (b)), and an average particle size of 24 ± 12 nm after annealing at 700 °C in helium (figure (c)). The good agreement between XRD and TEM sizes after annealing at 300 °C indicates that the particles are mostly single-domain. After annealing to 700 °C, there is a large difference between the TEM and XRD sizes, indicating that the particles contain more than one domain. The TEM images of these samples also showed the presence of nanorods, likely due to Cu2S formation. The large distribution of the nanoparticle sizes after annealing to 700 °C is due to large-scale sintering and the difficulty in distinguishing between the PdCu alloy and other compound particles such as Cu2S. Further discussion of the time evolution of the particle sizes is given in the following section.
The lattice parameter of the fcc alloy formed after annealing at 700 °C calculated from the XRD data was found to be 3.667 Å. Given the lattice parameters of Pd and Cu as 3.89 Å and 3.61 Å, respectively, and assuming Vegard’s law (linear dependence of the alloy lattice parameter on the lattice parameters and alloy composition) [Citation26], the Pd fraction was estimated to be x = 0.28 ± 0.03. This value is within experimental errors, but slightly lower than expected from measurements of the composition of the as-synthesized mixture by other techniques. This may be due to composition inhomogeneity that will be discussed later, or to the presence of small pure Pd and Cu nanoparticles that cannot be completely ruled out based on the XRD data alone.
Annealing in a forming gas atmosphere
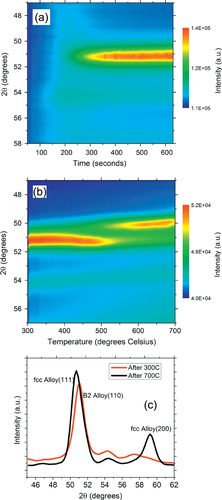
The nanoparticles annealed in forming gas display a behavior qualitatively similar with the samples annealed in helium gas. Specifically, the Pd:Cu nanoparticle mixtures undergo the same structural transformations. As in the case of thermal treatments in helium gas, the samples were first annealed at 300 °C (figure (a)) and then ramp annealed from 300 to 700 °C in forming gas (figure (b)). Figure (c) shows the expanded range of the θ–2θ scan taken at room temperature after each thermal treatment, highlighting the presence of two structures, B2 structure and fcc structure, after annealing at 300° and up to 700 °C, respectively.
Figure 6 (a) Color map of the XRD intensity evolution for Pd:Cu nanoparticle mixture on SiO2/Si substrate isothermally annealed at 300 °C in a forming gas atmosphere showing the formation of the ordered B2 phase. (b) Color map of the XRD intensity evolution of the Pd:Cu nanoparticle mixture on SiO2/Si ramp annealed from 300 °C to 700 °C in a forming gas atmosphere showing the transformation of the B2 phase into a disordered fcc alloy phase. (c) θ–2θ XRD scans after annealing at 300 °C and 700 °C. (d) Time evolution of the calculated XRD integrated intensities corresponding to the various peaks shown in (b) during ramp annealing from 300° to 700 °C. (e) Time evolution of the calculated XRD integrated intensities and domain size corresponding to the B2 phase shown in (a) during annealing at 300°. (f) Time evolution of disordered fcc domain sizes calculated for the (111) and (200) peaks shown in (b) during ramp annealing from 300 °C to 700 °C.
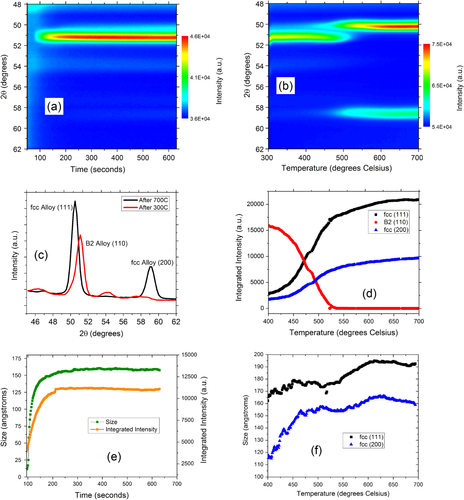
The evolution of the B2 (110) peak integrated intensity and the XRD domain size at 300 °C are shown in figure (e). The (110) integrated intensity is proportional to the B2 phase volume, or in other words to the degree of alloying. The incubation time is shorter than in the case of annealing in helium gas (<100 s). Moreover, the growth of the ordered B2 domains is faster than in the case of annealing in helium gas and is virtually complete in 200 s. The XRD domain size rapidly increases to about 15 nm simultaneously with the saturation of the integrated intensity. No significant coarsening of the domains is seen at late times at this temperature. The final XRD size measured at room temperature was 15.9 ± 0.8 nm, a value that is larger than the B2 particle size obtained during annealing in helium gas at the same temperature. This indicates that the coalescence process in the melted/disordered phase is facilitated by the forming gas likely because H2 prevents the formation of various Cu and Pd oxides.
The B2 phase formed at 300 °C decays when annealed at higher temperature (figure (b)), while the disordered fcc phase grows as evidenced from the emergence of the fcc (111) and (200) reflections around 450 °C. The transformation from B2 to disordered fcc structure (spanning from 400 °C to 500 °C) proceeds faster and at slightly lower temperature in the case of the Pd:Cu mixture annealed in forming gas than in the case of annealing in helium. This phase transformation is further illustrated by the evolution of the calculated integrated intensities (figure (d)) and the evolution of the domain sizes (figure (f)). Figure (d) shows the integrated intensity of the three peaks corresponding to the (110) of the ordered B2 phase, and (111) and (200) of the disordered fcc phase. The decay of the B2 phase and simultaneous growth of the disordered fcc phase become visible around 400 °C. By 525 °C, the B2 phase is completely consumed by the new phase. Moreover, figure (f) shows the size of the fcc domains calculated from the width of the (111) and (200) peaks. The disordered domains rapidly grow to about 15 nm (the size of the starting B2 crystals) in the 400–500 °C temperature range. The fcc domains are slightly asymmetrical, with the size along the (111) direction being larger than the size along the (200) direction. Moreover, the domains continue to coarsen throughout the remaining thermal treatment to 700 °C. The XRD final size (measured at room temperature) of the disordered alloy nanoparticles after annealing to 700 °C was 19.3 ± 0.1 nm. At this point we have not examined the late-stage kinetics of particle growth at high temperature, but we expect that once the solid-phase transformation is complete, the particles will continue to sinter following the model described in our previous work [Citation14].
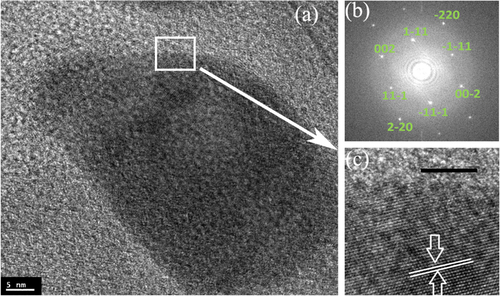
Figure shows a high-resolution image of PdCu alloy nanoparticles formed after annealing of the mixture in forming gas at 700 °C. The fast Fourier transform corresponding to the blown-up region reveals a (111) plane with a lattice fringe of 2.16 Å. The TEM-calculated size of the PdCu alloy nanoparticles produced by annealing at 700 °C in forming gas was found to be 28 ± 18 nm. Both our XRD and TEM sizes indicate that the PdCu alloy nanoparticles produced by annealing in forming gas at 300 °C and 700 °C are larger, compared to final sizes of the alloy nanoparticles made by annealing in helium gas.
Figure 7 (a) TEM image of the Pd:Cu nanoparticle mixture after annealing to 700 °C on SiO2/Si substrate in a forming gas atmosphere. (b) The FFT from the region indicated in (a) reveal fcc structure along the [110] zone axis with (111) inter-planar spacing of 2.16 Å. (c) A high resolution image of random alloy phase along [110] zone axis. Scale bars are 5 nm for images (a) and (c).
Pd:Cu nanoparticle mixtures on other substrates
Carbon black
We have previously investigated the thermal evolution of Pd:Cu nanoparticle mixtures dispersed on carbon black and annealed in helium gas [Citation16]. The nanoparticles form the B2 phase after annealing at 300 °C and then undergo an incomplete transformation to a disordered fcc alloy during ramp annealing to 700 °C, as shown in figures (a) and (b). The lattice parameter of the B2 structure was estimated to be 2.93 ± 0.15 Å, and the XRD crystalline domain size was 5.5 nm. The B2 phase transforms into the fcc alloy phase around 450 °C. The phase transformation is indicated by the shift of the peak at 51° to lower angle and the growth of the fcc (200) peak at 58.5°. The disordered fcc alloy displayed peaks at 50.2° (111) and 58.2° (200) at room temperature (figure (c)), corresponding to a lattice parameter of 3.68 Å and a crystalline domain size of 6 nm. The asymmetry of the (111) peak suggests that the transformation is incomplete, even at 700 °C. The alloy produced after annealing at 700 °C is Cu-rich, with a Pd concentration of just 25%, slightly lower than the composition of PdCu nanoparticles supported on SiO2/Si. The domain sizes are considerably smaller than observed on SiO2/Si substrates. In particular, no significant grain growth was observed at high temperature.
Figure 8 (a) Color map of the XRD intensity evolution for a Pd:Cu nanoparticle mixture on carbon black substrate isothermally annealed at 300 °C in a helium gas atmosphere showing the formation of the ordered B2 phase. (b) Color map of the XRD intensity evolution for the Pd:Cu nanoparticle mixture on carbon black ramp annealed from 300 °C to 700 °C in a forming gas atmosphere showing the transformation of the B2 phase into a disordered fcc alloy phase. (c) θ–2θ XRD scans after annealing at 300 °C and 700 °C.
TEM imaging (not shown in here) also showed the nanoparticles on carbon black to have smaller final sizes as compared to the final sizes of the nanoparticles dispersed on SiO2/Si substrates. For example, the TEM size distribution of the PdCu alloy nanoparticles dispersed on carbon black and annealed in helium gas at 700 °C was found to be bi-modal, with peaks at 3.7 ± 0.1 nm and 6.4 ± 0.3 nm after counting 400 particles. The smaller particle size on carbon black is likely due to the low particle loading and limited particle mobility on carbon black as opposed to SiO2/Si substrates.
Alumina
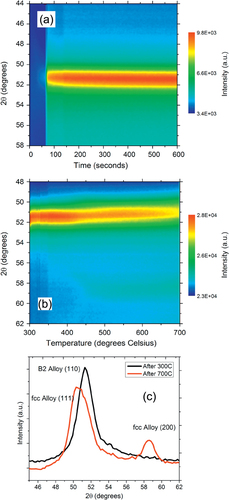
The Pd:Cu nanoparticle mixtures were also dispersed on alumina membranes and annealed in helium, as shown in the color map of the XRD intensity evolution in figures (a) and (b). The structural evolution of the nanoparticle mixtures in this case was dramatically different from the other substrates studied. On annealing at 300 °C, the Pd and Cu metals appear to segregate to form separate fcc almost-pure Pd and Cu phases. This is illustrated in figures (a) and (c) by the presence of the Cu and Pd (111) and (200) x-ray peaks. The Pd and Cu phases undergo grain growth without significant intermixing at this temperature. As a result of this segregation, the B2 structure was never synthesized in these Pd-Cu nanocatalysts dispersed on alumina. The Pd and Cu metal phases remained separate until annealed well beyond 600 °C. Figure (b) is the color map of the intensity evolution of the Pd:Cu nanoparticle mixture during ramped annealing from 300 °C to 700 °C. Above 600 °C, the nanoparticles sinter and the two metals interdiffuse, forming alloy phases. This alloying temperature is significantly higher than that of Pd:Cu nanoparticle mixtures dispersed on carbon or SiO2/Si and annealed in helium. On further analysis, we find that the Pd:Cu nanoparticle mixture forms two dominant alloy phases with lattice parameters of 3.69 Å and 3.87 Å. Using Vegard’s law, we estimated the two alloy phases to be 30% and 90% Pd, respectively. Hence we confirm the formation of two different alloys when dispersed in alumina, one rich in Cu, and another one with very high Pd composition. Our results are in agreement with Sun et al [Citation12], who explored the Pd-Cu catalysts on γ-Al2O3 and concluded that a bimetallic alloy is formed at 800 °C with either Pd- or Cu-rich surfaces. There was no evidence of formation of the B2 phase in their study, either. However, Sanchez-Escribano et al [Citation27] found evidence of formation of both disordered fcc and ordered CsCl-like structures for the Pd-Cu alloy prepared by co-impregnation and supported on γ-Al2O3.
Figure 9 (a) Color map of the XRD intensity evolution for a Pd:Cu nanoparticle mixture on alumina substrate isothermally annealed at 300 °C in a helium gas atmosphere. No B2 phase is formed in this process. (b) Color map of the XRD intensity evolution of the Pd:Cu nanoparticle mixture on alumina ramp annealed from 300 °C to 700 °C in a helium gas atmosphere showing the formation of a disordered fcc alloy phase. (c) θ–2θ XRD scans after annealing at 300 °C and 700 °C.
Discussion
A significant body of knowledge on the structure and phase transformations in binary nanoparticles systems comes from theoretical simulations [Citation28]. The PdCu system exhibits a multitude of interesting ordered structures. In particular, in the vicinity of 50% Pd-composition, PdCu alloys form an ordered, body-centered, cubic-like CsCl structure (B2 phase) at low temperature even though the constituents—Pd and Cu—both have face-centered cubic lattices [Citation23]. Some experimental reports of bimetallic PdCu nanoparticles found formation of the B2 phase at low temperatures [Citation29]. Others, however, found no evidence of the B2 phase. Zhu et al [Citation30] compared x-ray diffraction data with theoretical calculations employing molecular dynamics/Monte Carlo–corrected effective medium inter-atomic potential and concluded that distorted fcc clusters of sizes less than 10 nm, rather than B2 clusters, are most likely formed. Furthermore, theoretical studies by Shah and Yang [Citation31] examined equiatomic PdCu nanoclusters with spherical shape containing 50–10 000 atoms. They showed that the fcc structure is energetically favored over the CsCl-like structure for cluster sizes up to a few thousand atoms. They also predicted a structural transition from the fcc to the CsCl-structure for clusters consisting of about 10 000 atoms. Shah et al supported their theoretical calculations with experimental results that showed the distorted fcc cluster to best fit diffraction data for clusters of size ranging from 6 to 10 nm. In contrast to the latter theoretical and experimental findings, our experimental data identified the ordered B2 phase as the stable phase for PdCu nanoparticles as small as 6 nm formed through thermal annealing of Pd:Cu nanoparticle mixtures. This B2 phase transforms to a disordered fcc phase above approximately 450 °C.
An important aspect of the structure of the nanoparticles with consequences for chemical activity is component segregation, especially to the surface. The elemental segregation is expected to occur primarily on the surface of bimetallic nanoparticles, leading to core-shell, or core-multi-shell, formation. However, the results of theoretical studies on PdCu nanoparticles have been mixed. Some studies have reported surface segregation of Cu, while others have reported Pd enrichment. For example, Mottet et al [Citation32] performed Monte Carlo simulations of unsupported PdCu clusters with fcc, bcc polyhedra, and icosahedral structures. They found Cu segregation on the surface with slight Pd enrichment just under the surface for fcc and icosahedral structures. The segregation was also dependent on the facet orientation; i.e., Pd atoms preferentially occupy (111) facet sites. They also showed how phase and morphological configurations change with size, concentration, and temperature. Similarly, Zhu et al [Citation30] found that the surface layer is enriched with Cu, while the second layer is Pd-rich, and they confirmed the facet-dependence of Cu enrichment. Renouprez et al [Citation33] observed higher concentration of Cu in PdCu clusters supported on silica using low-energy ion scattering (LEIS) and Monte Carlo simulations. The factors in favor of Cu surface segregation include lower surface free energy, negative heat of mixing when alloying, and difference in atomic radii of Cu and Pd. However, Bradley et al [Citation34] found Pd enrichment in supported PdCu bimetallic alloys using x-ray absorption spectroscopy (XAS) and attributed it to the strong driving force of Cu to maximize coordination number with Pd. Molenbroek et al [Citation35] also used EXAFS to study nanoparticles with compositions ratio of Pd:Cu of 1:1 and 1:2 synthesized by atomic layer deposition and co-impregnation techniques and found Cu-rich surfaces for alumina-supported particles, but random alloying for silica supported particles.
Since we are investigating alloying in Cu:Pd nanoparticle mixtures, we expect the thermally induced evolution of the physical mixtures to be somewhat different from the evolution of bimetallic PdCu nanoparticles. Coalescence of two nanoparticles is typically driven by surface diffusion. In the case of two different metals, the coalescence can result in alloyed, core-shell, or multi-domain particles. For PdCu, volume diffusion also plays a major role in the intermixing of the constituents into different alloy phases. The competition between surface and volume diffusion may lead to non-uniform bimetallic nanoparticles of different compositions with either Pd- or Cu-rich surfaces. It is possible that the physical mixtures evolve in a manner similar to bi-layers of Pd and Cu. Pomerantz et al [Citation4] have found the Kirkendall effect in PdCu bi-layers due to the differences in the diffusion coefficients of Pd and Cu.
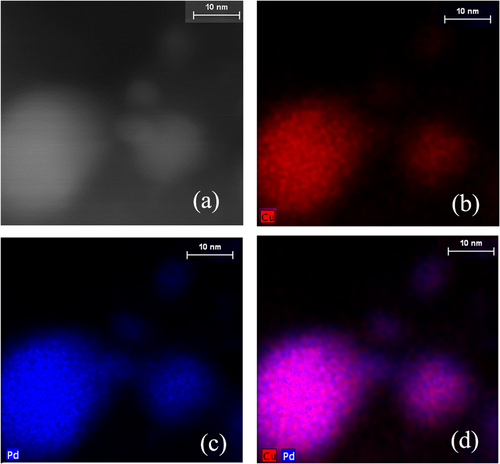
To explore these issues, we investigated the possibility of enrichment or segregation by either Pd or Cu in the annealed nanoparticles using aberration-corrected HAADF-STEM and EDX mapping of Pd:Cu nanoparticle mixtures supported on carbon black and annealed to 700 °C in helium gas, as shown in figure . EDX indicates approximately homogeneous mixing of the two metals in the volume of the nanoparticles, but also supports the possibility of slight Pd enrichment on the surface. This finding is surprising considering expectations based on the composition of the mixture (34% Pd: 66% Cu determined by ICP-AES) and theoretical predictions [Citation30, Citation32, Citation33]. Moreover, in our experiments Cu needs to diffuse from the surface to the volume, and therefore we would expect Cu surface enrichment. However, our results are consistent with a previous experimental study of PdCu nanoparticles [Citation8], and they suggest that the Pd-rich surface is energetically stable at the nanoscale. EDX also shows the presence of small Pd nanoparticles. Even though figure indicates local elemental segregation on the surface of the larger alloyed particles, more investigations are needed to identify the dependence of surface segregation on the crystallographic orientation of the facets.
Figure 10 HAADF-STEM and EDX maps of PdCu alloy nanoparticles after annealing to 700 °C on carbon black in helium gas: (a) HAADF-STEM, (b) Cu map, (c) Pd map, and (d) combined Pd and Cu map.
We have not yet performed EDX of the alumina-supported nanoparticles for which the XRD data indicates large-scale phase segregation at 300 °C and partial alloying when annealed to 700 °C. The effect of the supporting substrate on the alloying/segregation of multi-metallic nanoparticles is a topic of extreme interest due to its relevance for catalytic performance [Citation36] and is still under investigation. At this point we can only speculate that our observations of enhanced segregation on alumina are related to strong and/or different binding [Citation33] of the original ultrafine Cu and Pd nanoparticles on the alumina substrate and ensuing low particle mobility. Significantly different surface mobility of the two species in the mixture may result in size/component segregation as early as when the mixture is dispensed on the substrate, or later when the mixture is heated to 300 °C. Either scenario would explain the formation of pure Cu and Pd phases. These two phases intermix to some extent as the sample is further annealed above 600 °C, but since the degree of the transformation depends on the size of the Pd and Cu domains, temperature, and duration of the heat treatment, the intermixing is incomplete.
Conclusions
In situ real-time XRD and transmission electron microscopy were used to examine the structural transformations in Pd:Cu nanoparticle mixtures on several different support substrates in high-purity helium and forming gas. Annealing of the nanoparticle mixtures dispersed on SiO2/Si and carbon black at 300 °C leads to formation of alloy nanoparticles with chemically ordered CsCl-type (B2) structure. Upon further annealing to 700 °C, the B2 structure transforms into a chemically disordered Cu-rich fcc alloy. The temperature range of the transformation is consistent with expectations based on the bulk Pd-Cu phase diagram. The behavior of silica- and C-supported Pd:Cu nanoparticle mixtures was qualitatively similar when the heat treatment was performed in high-purity helium or forming (H2/N2) gas. The difference between final sizes for silica- and C-supported nanoparticles can be attributed to particle loading. A significant quantitative difference between the final size of the nanoparticles was found for the two types of atmospheres, with the nanoparticles annealed in forming gas being larger than the nanoparticles annealed in helium gas. This is caused by the reduction of the metal oxides in H2/N2 gas that promotes nanoparticles coalescence and sintering. EDX mapping of the nanoparticles annealed to 700 °C indicated slight Pd enrichment on the nanoparticle surface. This surface Pd enrichment also explains the lower than expected Pd composition calculated from the XRD data for the volume of the disordered alloy.
The degree of metal intermixing is highly dependent on the nature of the supporting material. The alumina-supported Pd:Cu nanoparticle mixtures produced pure Pd and Cu phases when annealed at 300 °C. Upon annealing to 700 °C, the alumina-supported samples formed two distinct disordered fcc alloys, a Cu-rich (30% Pd) and a Pd-rich (90% Pd) alloy. The B2 structure was absent in the evolution of Pd:Cu nanoparticle mixtures dispersed on alumina. Understanding the implications of these findings to the control of catalytic properties of the bimetallic nanoparticles is part of our ongoing research.
Acknowledgments
The synchrotron x-ray experiment was performed on beamline X20C at the NSLS, BNL. Use of the NSLS BNL and the Center for Functional Nanomaterials facility at BNL was supported by the US Department of Energy, Office of Science, Office of Basic Energy Sciences, under Contract No. DE-AC02-98CH10886. The authors are grateful to Jean Jordan-Sweet from IBM for help with the x-ray experiment. The work is supported in part by the NSF (CBET 0709113 and CMMI 1100736).
References
- KinoshitaK 1992 Electrochemical Oxygen Technology New York Wiley
- CoqBFiguerasF 2001 J. Mol. Cat. A: Chemical. 173 117 134 117–34 10.1016/S1381-1169(01)00148-0
- WangXKariukiNVaugheyJ TGoodpasterJKumarRMyersD J 2008 J. Electrochem. Soc. 155 B602 10.1149/1.2902342
- PomerantzNMaY HPayzantE A 2010 AIChE J. 56 3062 10.1002/aic.v56:12
- FoxE BSubramaniVEngelhardM HChinY-HMillerJ TKropfJSongC 2008 J. Catal. 260 358 10.1016/j.jcat.2008.08.018
- GucziLSchayZSteflerGLiottaL FDeganelloGVeneziaA M 1999 J. Catal. 182 456 10.1006/jcat.1998.2344
- KariukiN NWangXMawdsleyJ RFerrandonM SNiyogiS GVaugheyJ TMyersD J 2010 Chem. Mater. 22 4144 10.1021/cm100155z
- YinJShanSNgM SYangLMottDFangWKangNLuoJZhongC J 2013 Langmuir 29 9249 10.1021/la401839m
- YinZZhouWGaoYMaDKielyC JBaoX 2012 Chem.—Eur. J. 18 4887 10.1002/chem.v18.16
- MatteiGMaurizioCMazzoldiPD’AcapitoFBattaglinGCattaruzzaEde Julian FernandezCSadaC 2005 Phys. Rev. B 71 195418 10.1103/PhysRevB.71.195418
- StrukulGPinnaFMarellaMMeregalliLTomaselliM 1996 Catal Today 27 209 10.1016/0920-5861(95)00189-1
- SunKLiuJNagN KBrowningN D 2002 J. Phys. Chem. B 106 12239 10.1021/jp026011r
- MalisOByardCMottDWanjalaB NLoukrakpamRLuoJZhongC-J 2011 Nanotechnology 22 0257011 10.1088/0957-4484/22/2/025701
- MukundanVWanjalaB NLoukrakpamRLuoJYinJZhongC-JMalisO 2012 Nanotechnology 23 335705 10.1088/0957-4484/23/33/335705
- YinJHuPWanjalaBMalisOZhongC-J 2011 Chem. Commun. 47 9885 10.1039/c1cc13634h
- MukundanVYinJZhongC-JMalisO 2013 MRS Proc. 1528 mrsf12-1528-vv12-04 10.1557/opl.2013.367
- MottD 2010 Chem. Mater. 22 261 10.1021/cm903038w
- ZamboriniF PGrossS MMurrayR W 2001 Langmuir 17 481 10.1021/la0010525
- BorchertHShevchenkoE VRobertAMekisIKornowskiAGrubelGWellerH 2005 Langmuir 21 1931 10.1021/la0477183
- KumarJSaxenaR 1989 J. Less-Common Met. 147 59 10.1016/0022-5088(89)90148-3
- DownsR T 1993 Am. Mineral. 78 1104
- YinJ 2012 Chem. Mater. 24 4662 10.1021/cm302097c
- LiM 2006 Pd-Cu phase diagram ASM Handbook Volume 3: Alloy Phase Diagrams VillarsPOkamotoHCenzualK OH ASM International
- YamauchiMTsukudaT 2011 Dalton Transaction 40 4842 10.1039/c0dt01632b
- JonesD MOwenE A 1954 Proc. Phys. Soc. B 67 297 10.1088/0370-1301/67/4/303
- DentonA RAshcroftN W 1991 Phys. Rev. A 43 3161 10.1103/PhysRevA.43.3161
- Sanchez-EscribanoVArrighiLRianiPMarazzaRBuscaG 2006 Langmuir 22 9214 10.1021/la0616101
- FerrandoRJellinekJJohnstonR L 2008 Chem Rev 108 845 10.1021/cr040090g BalettoFFerrandoR 2005 Rev. Mod. Phys. 77 371 10.1103/RevModPhys.77.371
- GiorgioSHenryC 1997 Microsc. Microanal. Microstruct. 8 379 10.1051/mmm:1997129
- ZhuLLiangK SZhangBBradleyJ SDePristoA E 1997 J. Catal. 167 412 10.1006/jcat.1997.1588
- ShahVYangL 1999 Phil. Mag. A 79 2025 10.1080/01418619908210407
- MottetCTregliaGLegrandB 2002 Phys. Rev. B 66 045413 10.1103/PhysRevB.66.045413
- RenouprezA JLebasKBergeretGRoussetJ LDelichereP 1996 Stud. Surf. Sci. Catal. 101 1105 10.1016/S0167-2991(96)80322-3
- BradleyJ SViaG HBonneviotLHillE W 1996 Chem. Mat. 8 1895 10.1021/cm960093c
- MolenbroekA MHaukkaSClausenB S 1998 J. Phys. Chem. B 102 10680 10.1021/jp9822081
- YangL 2012 J. Am. Chem. Soc. 134 15048 10.1021/ja209650h