
 ?Mathematical formulae have been encoded as MathML and are displayed in this HTML version using MathJax in order to improve their display. Uncheck the box to turn MathJax off. This feature requires Javascript. Click on a formula to zoom.
Abstract
The vibrations of a single-crystal germanium (Ge) membrane are studied in air and vacuum using laser vibrometry, in order to determine mechanical properties such as Q-factors, tensile stress, anisotropy, and robustness to shock. Resonance modes up to 3:2 are identified, giving a residual stress measurement of 0.22 GPa, consistent with the value obtained from x-ray relaxation studies. The membrane is found to be isotropic, with Q-factors ranging from around 40 at atmospheric pressure to over 3200 at mbar, significantly lower than those found in polycrystalline Ge micromechanical devices. The robustness to shock is explained through the high resonance mode frequencies and the dissipation mechanism into the substrate, which is a direct consequence of having a high quality film with low residual tensile stress, giving the potential for such films to be used in optoelectronic devices.
Introduction
Germanium (Ge) has been suggested as a suitable integrating material for combining many different device functions on traditional complementary metal-oxide semiconductors (CMOS), with the possibility of devices being combined on a single chip. Ge on a Si substrate forms the basis for many optoelectronic devices, including near-infrared photodetectors, photonic modulators and lasers [Citation1–Citation3]. Ge subcells have also been used with top cells made of group III–V elements for efficient solar cell applications [Citation4–Citation6]. Electrical transport measurements in Ge have shown that an ultra-high hole mobility can be achieved, which could impact on fabrication of devices such as CMOS, resonant tunnelling diodes, heterojunction bipolar transistors etc [Citation7]. This high mobility appears in Ge layers that are strained by growing on a graded buffer that contains relaxed, high Ge-composition alloys [Citation8, Citation9]. Ge has recently had a revival as a spintronics medium and has shown efficient spin injection and polarization [Citation10, Citation11]. The integration of relaxed and strained Ge together with III–V materials on a single buffer could thus be used as an all-round integration platform.
By mechanically decoupling a Ge film from a bulk Si substrate, a Ge membrane can be produced that responds more rapidly and with higher sensitivity than an uncoupled film, having eliminated the damping, and other parallel effects, of the substrate. This opens the possibility of adding new functionality to integrated systems, for example, the production of micro-mechanical electronic systems (MEMS) using Ge, which is a promising area that has not yet been explored in great depth. The freestanding membrane is a very simple MEMS system, and these have recently been fabricated using a Ge on Si (001) layer [Citation12]. The membrane was doped with phosphorous using reduced pressure chemical vapour deposition (RP-CVD) and tensile strained in a bi-metallic layer process; in combination these two processes allow the membrane to effectively become a direct bandgap material, and the sample showed efficient electroluminescence [Citation12]. In addition, a distinct advantage of suspending crystalline Ge is that the electrical leakage, which arises due to dislocations within the layer from relaxation processes, can be minimized [Citation13].
To produce useful devices, knowledge of the mechanical properties is key. High Q-factors are desirable for applications of membranes as MEMS, while robustness to shock and mechanical stability are the main concern in applications that rely on the optoelectronic and electronic properties of Ge, regardless of the resonant membrane behaviour. Knowledge of the elastic properties of thin films and their residual stresses are therefore important in device fabrication [Citation14]. The elastic and vibrational properties of thin films can be studied by using the static load versus deflection method to extract Young's modulus and Poisson's ratio [Citation15–Citation17], or by dynamic techniques, in which the resonant frequencies of vibrating films are measured and used for determining the film's elastic properties or stress [Citation18–Citation22].
Resonance frequencies of various membrane materials have been measured previously using laser interferometry for detection of the vibration displacements, following actuation using speakers or piezoelectric transducers depending on the desired frequency. Materials have included high temperature oxides, with lateral dimensions of 1.2–7.8 mm and thickness of 550 μm, and circular membranes of various materials including polyamide and silver, with thicknesses ranging from 10 μm to 250 μm [Citation18, Citation21]. More recently, thin film graphene and graphene oxide resonators (15 nm thick and up to 7.5 μm in diameter) have been studied using electrical or optical actuation and detection by laser deflectometry [Citation23, Citation24].
Here, we use a piezoelectric transducer in combination with laser interferometry to study the vibrational properties of a square Ge membrane, with an area of 1 mmand sub-micron thickness. The potential applications for such Ge membranes envisage their use at atmospheric pressure and also in vacuum. High Q-factors are required for MEMS applications, while they are not necessary for optoelectronic applications, where an excellent material quality (defined by low density of defects, uniformity of stress and boundary conditions), mechanical stability and robustness to shock (characterized by vibrational properties and defined by energy dissipation mechanisms) are of paramount importance. The measurements are performed at atmospheric pressure and in near-vacuum (to pressures of
mbar), and at frequencies of up to 400 kHz. The resonant frequencies of several modes are used to measure the residual tensile stress in the membrane, and Q-factors are investigated as a function of pressure. Energy dissipation mechanisms and membrane uniformity are induced from these measurements. The method that is used here is suitable for rapid assessment and is more cost effective and fast compared to full 2D characterization of vibrational modes [Citation25].
Experimental details
The Ge membrane was made by growing a single-crystalline Ge film onto a Si substrate, then removing part of the Si substrate with an anisotropic etch [Citation13]. Ge layers were grown by RP-CVD, in an ASM Epsilon 2000 system, on either side of a double side polished, low resistivity Si (001) substrate of thickness 300 μm. The back side of the wafer was patterned using standard lithographic techniques and subjected to deep reactive ion etching using an AlO
mask. To complete the process the chemical resistivity of Ge in an anisotropic 80
C 25% tetramethylammonium hydroxide heated bath was utilized to remove selected areas of Si and fully suspend the membrane. The substrate dimensions for the sample studied were approximately 10 x 5 mm, while the membrane was of lateral dimensions 965 x 965 μm (measured by atomic force microscopy) and thickness 700 nm. The thickness was measured using white light reflectometry (Sci-soft Filmtek 2000 M) of wavelength 380–890 nm, with the measurement accuracy confirmed through destructive testing of several samples to view the cross-section using scanning electron microscopy. The thickness measurement, including consideration of any non-uniformity across the membrane, had a maximum 12% error.
At ambient pressure, a speaker (NeoCD2.0 True Ribbon Tweeter by Fountek; nominal frequency range of 1.2–40 kHz and output up to 100 kHz) was first used to excite the membrane in the low frequency range, in an arrangement similar to that given in [Citation18]. In this arrangement the substrate was clamped, and the membrane vibration was excited through the air pressure variations on the membrane. At frequencies above 100 kHz the excitation of the membrane was done using a lead zirconate titanate piezoelectric transducer (from Physik Instrumente), with the entire sample mounted on the transducer horizontally; the membrane and the substrate were both vibrated. The transducer was 10 mm in diameter and 1 mm thick, with a nominal frequency of 2 MHz but with broadband generation possible. The membrane showed a larger deflection signal than the substrate at most excitation frequencies, with a much larger response at resonance frequencies. A function generator was used to excite both the transducer (at 0.1 V peak-to-peak voltage) and the speaker, with a continuous sinusoidal signal generated. The frequency was either ramped from 100 kHz to 400 kHz, or fixed at the required value when studying membrane behaviour at resonant frequency. The membrane vibration was monitored to check that this did not deviate from the expected sinusoidal profile for the generated vibrations, and the vibration amplitude of the membrane was also monitored. The membrane behaviour was sensitive to its position relative to the transducer centre, and therefore all measurements were done when the membrane was placed in the centre of the transducer.
The out-of-plane displacement of the membrane due to the deflection on vibration was monitored optically using a two-wave mixer laser interferometer produced by Intelligent Optical Systems Inc. (IOS, AIR-1550-TWM), with wavelength 1550 nm, and calibrated so as to give a measure of the absolute out-of-plane deflection amplitude. The Ge layer has excellent reflectivity at this wavelength; however, 3.2% of the laser energy at 1550 nm is absorbed by the membrane and so the optical power of the laser was set to 0.1 W to minimize heating effects. Two types of measurements were made: (i) scanning in frequency when the probe beam was in the centre, on the substrate or at another position of maximum deviation of the membrane (figure (c)); (ii) scanning across the membrane at a chosen frequency, to record the deviation profile as a function of detection position. Scans in four directions relative to the membrane orientation were done: along the centre line (parallel to either or
), and along two diagonals (figure (c)). In this way the first and higher order modes could be distinguished. In vacuum scans were done along
and
, as the modes were at similar frequencies to those identified at atmospheric pressure and the diagonal scans were not required for mode identification. Figure shows the experimental set-up; either the laser detector measurement head or the sample were mounted on a motorized stage to allow scanning of the modes across the sample (figure (c)), with scanning steps in the x-direction of 25 μm. The position of the sample or laser detector measurement head in the y-direction could also be controlled, allowing full identification of resonance mode patterns. For low pressure measurements the membrane and piezoelectric transducer were placed inside a vacuum chamber capable of withstanding pressures down to
mbar, with a quartz optical window for laser access. Pressure inside the chamber was controlled using a rotary pump and a Pirani gauge down to
mbar, the pressure at which the damping effects of the air are no longer significantly pronounced [Citation26, Citation27].
Figure 1 The experimental arrangement (not to scale) with (a) a transducer and a sample within the vacuum chamber, (b) shows a close-up, with the spacer to allow free membrane movement. Positions of frequency spectra measurements (red dots) and scanning directions across the membrane (white arrows) are shown in (c).
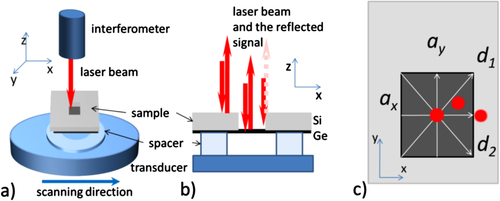
The laser interferometer beam was focused into a spot of 200 μm diameter, with the resolution perpendicular to the scan direction defined by the beam size. In the direction of a scan, features with dimensions below 200 μm should be resolvable through using a smaller scan step size and considering overlap of detection positions. For higher order vibrational modes, where the nodal lines are spaced by 240–320 μm, it was difficult to remain absolutely parallel to the nodal lines when scanning, and additional minima in the deflection amplitude could be observed. When scanning the membrane from the substrate side, sharp dips in reflectance were observed during each scan as the beam crossed the substrate and membrane edge (figure (b)), and these features were used to position the beam relative to the membrane. The measurement system was fully automated and controlled using LabVIEW.
Theoretical background
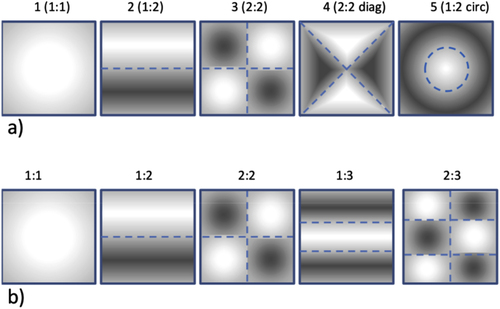
The vibration frequencies of thin films can be governed either by elasticity (with the dominant restoring force due to the bending of the material; the film is called a ‘plate’ in this regime) or by tensile stress (with the dominant restoring force the tension applied along its boundary; the film is a ‘membrane’ in this regime) [Citation28, Citation29]. Figure shows the first resonant mode vibration shapes expected from a square plate (in (a), adapted from [Citation29], p 60) and a square membrane (in (b), adapted from [Citation30]). It should be noted that in the stress-governed regime for a square membrane there should be no preference for either the 1:m or the m:1 mode (m 1) over the other, and their resonant frequencies may overlap, giving a resonance pattern showing superposition of modes. If there is anisotropy in the tensile stress the modes will split [Citation22, Citation28]. A superposition of modes may be observed at certain resonant frequencies if the membrane is fully isotropic and has equivalent side lengths.
Figure 2 (a) First five resonance modes for a square plate fully clamped on all sides. (b) First five resonance modes for a square membrane. The dashed lines are nodal lines which have zero deflection amplitude, while the darker and lighter areas are vibrating away from and towards the reader respectively.
The natural vibration frequencies of a square film in the stress-governed regime (membrane) in vacuum are given by [Citation30]1
1 where n and m describe the mode number, σ is the biaxial tensile stress, a is the membrane dimension and ρ is the density of the material. The frequencies for the elastically governed regime (plate) follow a different pattern, described by [Citation29]
2
2 where
is the mode coefficient (taken from tables in [Citation29]), E is Young's modulus, d is the film thickness and ν is Poisson's ratio.
When the membrane is at atmospheric pressure, the frequencies obtained in each case must be corrected to allow for atmospheric damping [Citation19], using3
3 where
is the density of the air. This correction is for circular membranes, but will give a suitable approximation for the case of a square membrane. Table shows the calculated vibration frequencies in air for several different modes for the elastically and stress-governed regimes of the studied membrane (mode shapes in figure ), with density taken to be
kg m
and σ = 0.182 GPa. For the elastically governed regime the mode coefficients are taken from [Citation29] (table 4.22). The expected frequency of each mode differs by up to two orders of magnitude depending on which regime the membrane operates in.
Table 1. Expected frequencies of vibration modes for the elastically governed (plate) regime and for the expected value of stress in the stress-governed (membrane) regime at ambient pressure. Selected modes are illustrated in figure .
To identify the regime of operation of the film (plate or membrane) the flexural rigidity D can be calculated. The stress-governed (membrane) regime occurs when D satisfies the inequality [Citation29]4
4 For a pure Ge film, Young's modulus E = 102.110 GPa and
[Citation31]. For the Ge film used here to behave like a membrane, the biaxial tensile stress has to be much greater than
Pa. It is possible to estimate the stress in the membrane when relaxation (in our case from thermal expansion coefficients mismatch) and lattice mismatch between the film and the substrate are known, using
5
5 where ε is the strain, f is the lattice mismatch and R is the relaxation. X-ray diffraction measurements on the membrane gave a value of R = 104.2% (
% means the membrane is under tensile strain), and for Ge on Si
, therefore
[Citation32]. The calculated value of the stress is therefore given by
GPa, and hence it is expected that the Ge film will behave like a membrane, i.e. it will vibrate in the stress-governed regime.
Resonance modes
The resonance spectra and the profiles of the spectral peaks were studied firstly in the low frequency range (below 100 kHz), using the speaker to actuate the membrane at ambient pressure, to confirm that no elastically-governed resonances were observed (table ). For these measurements a simple 1:1 type resonance was seen at many frequencies, but no higher order vibrational modes were observed. This suggests that the observed resonances were subharmonics, and that the 1:1 and higher modes occur at higher frequencies, as expected from the above calculations if the behaviour is stress-governed. The membrane was then studied using piezoelectric transducer actuation in the frequency range of 100–400 kHz and different modes were observed. This measurement was repeated at lower pressures, down to mbar.
Frequency scans at atmospheric pressure
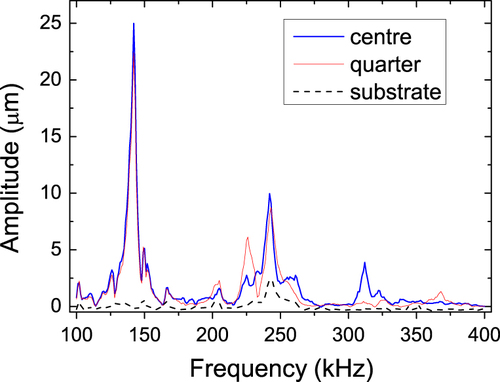
The response of the membrane to excitation was measured at points on the membrane where displacement maxima of certain modes are expected. These positions were at the centre of the membrane, where the maximum deflection is expected for modes including 1:1 and 1:3, and a quarter-way along the membrane (figure (c)), where high deflection for certain other modes will be observed (e.g. 1:2 and 2:3 on figure (b)). Figure shows the amplitude of the displacement at these positions along with a measurement of the substrate. Peaks in the substrate response indicate transducer resonances (such as the strong peak around 250 kHz visible on the membrane and the substrate), and hence any resonance mode will show as an increase over the background (substrate) oscillation where there is no peak in this background oscillation. The measured frequency response indicates that there are mode resonances at around 142, 225, 312, 322 and 368 kHz, with the mode at 142 kHz having a large amplitude, suggesting that this is the 1:1 mode. These frequencies were chosen for further investigation and profile scans across the directions shown in figure (c).
Figure 3 The membrane response to excitation at different frequencies at atmospheric pressure, measured at different points on the membrane where the maxima for odd and even modes are expected. The membrane substrate response (dashed line) showing a transducer resonance around 250 kHz is also included.
Position scans
The membrane displacement amplitude was monitored across the membrane, with a scan done along four directions; along ,
, and the membrane diagonals
and
(figure (c)), around the frequencies of interest identified from figure . This combination of scans allows for full characterization of mode shapes from just a few measurements rather than a full 2D scan, following consideration of any misalignment of the detector from the exact membrane centre-lines during scans. It is worth noting that as the beam width (200
) is of a similar magnitude to the spacing between the modes, there will always be some contribution from the neighbouring regions in the cross-membrane scans, however the mode pattern will be visible.
The expected mode profiles were calculated for pure modes and their interference patterns, shown in figure , with the colours showing the maximum absolute displacement at each position on the membrane. Figures (b), (e) and (h) show equal mixing of two modes (e.g. 1:2 and 2:1 in (b)) assuming both modes are in-phase. Figures (c), (f) and (i) show the effect of having a dominant mode mixed with its symmetric counterpart. Expected displacements along different scan directions can then be obtained both for perfect positioning of the scan along the centre-lines or diagonals, and for a small offset by 200. Note that for even modes a slight rotation of the scan line relative to the membrane side will produce an identical effect to that expected from the mode mixing. Figure shows the expected membrane displacement profiles along
,
and diagonals for the case of averaging over the scanning beam area (200
) for the 1:2, 1:3 and 2:3 modes and mixing with their symmetric counterparts at 70/30% and 50/50% ratio, as on figure .
Figure 4 Calculated membrane displacement profiles for different modes and their superposition patterns. The red circle in (a) indicates the scanning beam size. (a), (d) and (g) pure 1:2,1:3 and 2:3 modes; (b), (e) and (h) interference pattern of the symmetric (k:m and m:k) modes when both modes are equally present; (c), (f) and (i) pure modes with the addition of 30% of their symmetric counterpart.
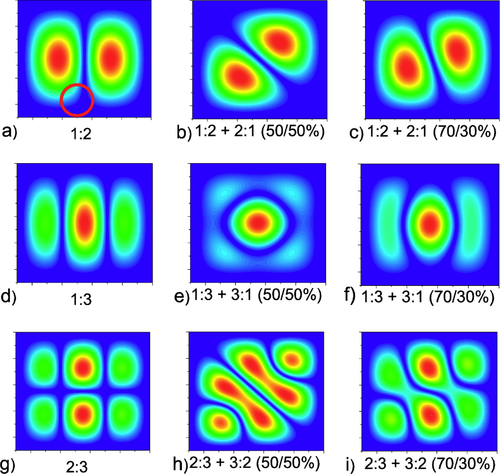
Figure 5 Expected scanning profiles for the 1:2, 1:3 and 2:3 modes and mixing with their symmetric counterparts for the four scan directions. The red dashed lines indicate scan profiles when the beam is offset (by 200 ) from the membrane centre.
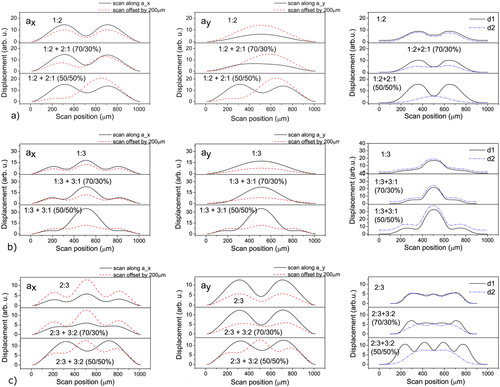
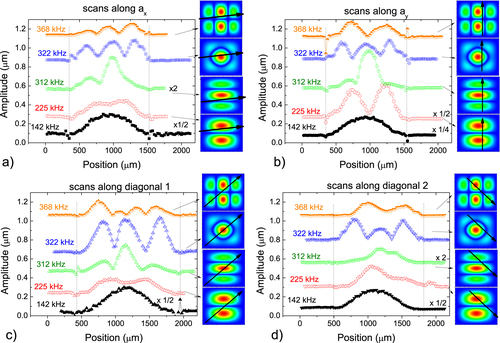
Figure shows the profiles of the membrane displacement at different frequencies, measured in air, again showing the maximum absolute displacement at each position. The inserts show the attributed modes based on figure and the expected scanning positions. Some traces are labelled with a multiplication factor, used so that all had a similar maximum amplitude on the plot. The fundamental 1:1 mode, with no nodal lines, can be clearly seen for all four scan directions at 142 kHz. The mode around 225 kHz can be identified as a 2:1-dominant mode, with a nodal line parallel to the direction. The modulation along the
direction is consistent with the scan direction either being slightly rotated relative to the
direction, or to the presence of mode-mixing of the 2:1 and 1:2 modes. In the region of 312–322 kHz the broad resonance appears to be the mix of third modes, with the mode at 312 kHz identified as a 3:1-dominant mode, and the mode at 322 kHz an interference of 1:3 and 3:1 modes. This broad resonance has profiles that deviate from those expected of simple, in-phase mode mixing, hence the assignment is approximate for this mode combination. The mode at 368 kHz is identified as a 2:3-dominant mode, with two nodal lines parallel to
, and one parallel to
.
Figure 6 The membrane displacement profiles at ambient pressure at several frequencies, showing profiles consistent with the fundamental, 2:1, 1:3, 2:3 and 3:2 modes with increasing frequency. Traces are offset, with numbers indicating a multiplication factor. Black vertical lines indicate membrane edges. The insets show suggested mode patterns and scanning positions.
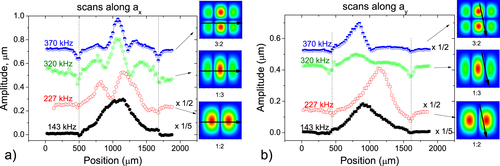
At low pressure only pure modes were observed, and no interference or splitting of symmetric modes was present. Figure shows the profiles of the observed modes. The mode at 143 kHz is 1:1, while the one at 227 kHz is identified as a 1:2 mode, with nodal line parallel to . The mode at 320 kHz is a 1:3 mode. The small modulation in this scan along
is due to the scan not being perfectly parallel to the membrane side, which leads to a crossing of one of the nodal lines that lies along
. The mode around 370 kHz is a 2:3 mode, with two nodal lines parallel to
and one parallel to
.
Figure 7 The membrane profile at different frequencies at low pressure ( mbar), showing profiles consistent with the fundamental, 2:1, 3:1 and 3:2 modes. The dashed vertical lines indicate the edges of the membrane. The numbers near some traces indicate that the trace was multiplied by a certain factor for visibility. The suggested mode patterns and scanning positions are shown on the right.
Anisotropy in the biaxial tensile stress or in the membrane boundary conditions can be identified if the n:m and m:n modes split. The studied film did not exhibit clear splitting, but some modes were clearly suppressed. The lack of clear splitting infers a reasonable uniformity of the stress in the membrane, and allows a meaningful assessment of Q-factors for the resonances. The mode which was suppressed varied between experiments, and between atmospheric and low pressure, suggesting that mode selection is influenced by mounting conditions and environmental factors, rather than being predefined by the membrane structure. This is expected, as the wavelengths of the resonant frequencies in Ge and Si are much larger than the sample thickness, and hence the modes will be influenced by the properties of the mount, the transducer, and the scanning stage. The exact mode pattern (1:2 or 2:1, combination of 1:3 and 3:1) depends strongly on the way the membrane is mounted on the transducer, and hence varies between experiments.
Spectral evolution at reduced pressures
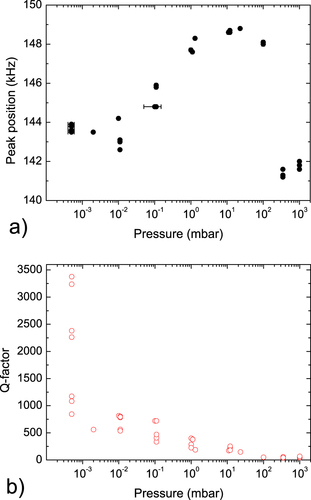
In air, the resonant modes are significantly damped. Two main effects are expected as the pressure is decreased: the resonant frequencies should shift to higher frequencies, and the Q-factors should increase. Figure shows (a) vibrational spectra of the membrane at different pressures and (b) the evolution of the fundamental mode as the pressure is decreased. There is a clear dependence on pressure for all modes, and figure (c) shows the frequency shift of several chosen modes over a range of pressures. These show a general shift to lower frequencies as the pressure is reduced; this is contrary to what would be expected due to the reduction in damping, indicating the influence of another effect on the resonant frequency.
Figure 8 Evolution of membrane vibration spectra on decreasing pressure measured in the centre of the membrane: (a) spectra of the membrane, (b) the fundamental mode, and (c) peak positions of modes 1:1, 2:1, 1:3 and 3:2. The error bars in (c) (±1 kHz) are of the same size as the symbols.
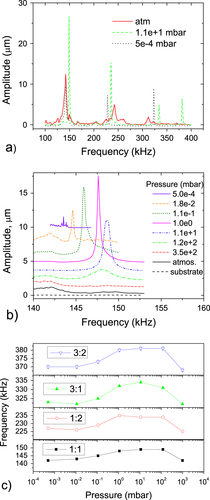
Figure shows a more detailed study of the fundamental 1:1 mode as a function of pressure, showing the behaviour of (a) the resonant frequency (measured at the membrane centre) and (b) the Q-factor. The positions of the peaks were obtained by fitting experimental curves with a Lorentzian. Q-factors were calculated as , where FWHM is the full width at half maximum of the Lorentzian peak. At least three measurements were made at each pressure decade to check reproducibility.
Figure 9 The (a) positions and (b) Q-factors of the 1:1 mode peaks at different pressures, from atmospheric to mbar measured at the membrane centre.
As the pressure is reduced from atmospheric to 10 mbar, the resonant frequency generally increases, as expected. However, as the pressure is further reduced, the resonance moves to a lower frequency. This shift can be explained by heating of the sample by the laser beam of the interferometer; out of the 100 mW probe beam at 1550 nm, 3.2 mW is absorbed by the membrane. At the reduced pressures convective cooling is impeded and heating may therefore start to become significant. The heating leads to thermal expansion of the membrane and Si substrate, with the net effect of reducing tensile stress in the membrane (note that at the growth temperature of 913 K the stress is zero). To evaluate the importance of heating in our system we have modelled the system using MATLAB and performed an experiment where the vibrational laser beam, provided by the guide-beam for the interferometer, was used in addition to the probe beam (see appendix). The guide beam has a power of 1 mW, which is fully absorbed over the 700 nm Ge film.
For the worst case scenario, where only the Ge film conducts heat, with no thermal anchoring to the environment, the cooling is by natural convection only. In this case the temperature of the membrane will increase by less than 2 K at atmospheric pressure, both with the additional laser on and off. At 0.18 mbar, where the convection cooling coefficient is known [Citation33], the temperature increase will be 14 K without, and 18 K with the additional laser beam on. The region under the laser spot will be only marginally () warmer than the rest of the Ge membrane due to its relatively high thermal conductivity, hence the membrane shape is not changed and no anisotropy is introduced by the laser beam.
Q-factors
Q-factor is a measure of energy dissipated in the oscillator and is determined from the various loss mechanisms, each giving , using
. At atmospheric pressure, there is strong damping in air, through acoustic radiative loss and viscous drag [Citation34]. Q-factors for suspended film MEMS and nano-mechanical electronic systems (NEMS) are usually quoted for vacuum [Citation27, Citation35–Citation37]. In vacuum, the loss mechanisms in the membrane that would contribute to lowering of the Q-factor are phonon–phonon interactions, thermoelastic losses, radiation into the substrate (clamping losses) and dissipation at intrinsic effects in the membrane [Citation25, Citation35, Citation37, Citation38]. Radiation into the substrate is reduced and Q-factors increase when the tensile stress in the membranes is increased, thus increasing acoustic impedance mismatch between the substrate and the membrane [Citation27, Citation37]. Dissipation at defects could lead to deterioration of the devices with time, which should manifest itself as an irreversible downshift in resonant frequencies. No such changes were observed with the membrane over a period of greater than six months.
The Q-factor in the studied system (figure (b)) at atmospheric pressure is similar to the earlier reported values for polycrystalline Ge and Si–Ge membranes [Citation36], and it increases monotonously as the pressure is reduced, as expected. Q-factors as high as 3240 are observed at mbar for the fundamental mode. The Q-factor limit due to phonon–phonon interaction [Citation35, Citation39] in the studied membrane is calculated to be
and
in vacuum for room temperature and Ge melting point, while the thermoelastic Q-factor limit [Citation38] is
and
in vacuum for room temperature and Ge melting point.
The measured Q-factors in vacuum are therefore lower than those reported for polycrystalline Ge and Si–Ge membranes [Citation36] and significantly lower than the theoretical phonon–phonon and thermoelastic limits calculated for the studied membrane. The membrane in this study was specifically produced to have low residual stress, thus the radiative loss into the substrate is expected to be significant. While other mechanisms are eliminated as the major contributors to the low Q-factor at vacuum, radiation loss into the substrate is identified as the dominant energy dissipation mechanism in the studied membrane. Higher Q-factors can be achieved, if necessary, by increasing the stress in the membrane. Laser heating contributes to the reduced Q-factor value by further reducing the stress in the membrane and increasing the radiative loss.
Stress calculation
In an ideal membrane, one resonant frequency is enough for a precise computation of the stress. However, any deviation from the ideal membrane (for example, the sides of the square not being of equal size, the stress being anisotropic, or boundary conditions being non-uniform) has a large influence on the mode shape and frequencies [Citation22]. Monitoring several modes simultaneously therefore gives better precision in estimating the stress in the membrane than using just one mode, with measurements in vacuum giving the best precision. Due to heating effects at very low pressures, the experimental values from measurements at 10 mbar pressure were chosen for calculating stress in the membrane as they should show the best balance between reduced damping and limited heating. For comparison, a similar stress calculation was done using the measurements at atmospheric pressure, with the correction for atmospheric damping.
The resonance frequencies in air and vacuum, allowing for damping due to atmospheric pressure in air, were calculated assuming operation in the stress governed regime of the membrane vibration, in the same way as in table , for a range of values of σ, and the calculated frequencies were compared to the frequencies measured in the experiment. Table shows the calculated resonance frequencies in vacuum and air for GPa and
GPa respectively, alongside the experimental values at 10 mbar (left) and in air (right). These stress values were chosen from the best agreement with the experimental data. The agreement is excellent, in particular at reduced pressure, and mostly within the error of the experimental measurements. As discussed earlier, at atmospheric pressure the 1:3/3:1 mode is broad; note that the expected value for it is 317.4 kHz, in good agreement with the observed values. Also note that the correction for atmospheric damping is only suitable as an estimation.
Table 2. Experimentally observed and calculated frequencies of vibration modes. Calculations for frequencies in air use the atmospheric damping correction.
The stress calculated from the measurements at 10 mbar pressure (0.221 GPa) should be the closest to the actual value of the stress in the membrane as the modes are better defined at low pressures compared to measurements at atmospheric pressure, while the heating effects are still small compared to measurements at higher vacuum. This value is a small underestimation of the real stress value, as frequencies should further upshift when damping in gas is reduced at higher vacuum. The calculated values for the stress are higher than the value approximated using thermal expansion mismatch (0.182 GPa) used to calculate the values in table , but are of a similar magnitude.
Conclusions
Vibrational modes of a Ge membrane of thickness 700 nm and lateral dimensions 965 × 965 μm were studied using actuation by a speaker or piezoelectric transducer and detection using a laser interferometer. The Q-factors are 47 in air and 3240 at mbar for the fundamental mode. From the frequencies of the observed vibrational modes the stress in the membrane was estimated to be 0.221 GPa, slightly larger than but similar to the value estimated from the x-ray relaxation study, 0.182 GPa. No significant mode splitting indicating stress anisotropy was detected.
The membranes exhibit high robustness to shock, and from this study it can be seen that their main modes of vibration are well above the frequencies commonly present in the environment (usually below 40 kHz), and are characterized by rather low Q-factors at atmospheric pressure. In vacuum, the Q-factors are also modest compared to the values reported for polycrystalline Ge and Si–Ge membranes [Citation36]; however, the values could be a slight underestimation due to the heating effects at low pressures. The Q-factors are increased by increasing residual tension, which points to this as a route to higher Q-factors if desired.
Low Q-factors show that energy is dissipated in the membrane during each cycle of vibration. This can be beneficial for applications where high amplitude vibrations are experienced that could otherwise lead to membrane failure, provided that the thermal energy is dissipated over the entire area of or outside the membrane. If, on the other hand, this energy were dissipated locally on impurities or dislocations it may, over many cycles, modify the membrane structure and lead to its eventual failure. Such changes in the membrane would manifest themselves in changes to the resonant modes, and also lead to anisotropy and mode splitting. That we did not observe any such irreversible changes in resonant frequencies or anisotropy during this study suggests that this latter mechanism is small, if present at all; however, more work should be done to explicitly answer the question of membrane stability. The dominant mechanism of energy dissipation in the studied membrane is the radiative losses into the substrate, a way of dissipating energy that is consistent with excellent shock robustness.
The measurement method described here is fast, nondestructive and convenient, suitable for vacuum and ambient pressure, and can provide information about material properties such as stress or Young's modulus, and the vibrational behaviour (Q-factor) of a membrane. The measurements will also give information about membrane anisotropy, if present, from the appearance (or not) of mode splitting. The method is particularly suitable for providing fast feedback when optimizing membrane growth and etching conditions, and for real-time monitoring of membranes during lifetime testing. It is a simpler and lower cost alternative to interferometric techniques and 2D visualization of vibrational modes.
Acknowledgements
This work was funded by the ERC under grant 202735, ‘NonContactUltrasonic’, by the EPSRC projects EP/F040784/1 ‘On-chip Milikelvin Electronic Refrigerator for Astronomical and Quantum Device Applications’ and EP/J001074/1 ‘Creating Silicon Based Platforms for New Technologies’, and by EC Project 257375 ‘Nanofunction Network of Excellence. Andrey Shchepetov and Mika Prunnila, of VTT Technical Research Centre of Finland, are acknowledged for their contribution to the fabrication of thin Ge membranes.
References
- MichelJLiuJ FKimerlingL C 2010 High-performance Ge-on-Si photodetectors Nat. Photonics 4 527 34 527–34 10.1038/nphoton.2010.157
- KuoY-HLeeY KGeYRenSRothJ EMillerD A BKaminsT IHarrisJ S 2005 Strong quantum-confined Stark effect in germanium quantum-well structures on silicon Nature 437 1334 6 1334–6 10.1038/nature04204
- JifengLXiaochenSRodolfoC-ALionelC KJurgenM 2010 Ge-on-Si laser operating at room temperature Opt. Lett. 35 679 81 679–81 10.1364/OL.35.000679
- GuterWSchöneJPhilippsS PSteinerMSieferGWekkeliAWelserEOlivaEBettA WDimrothF 2009 Current-matched triple-junction solar cell reaching 41.1% conversion efficiency under concentrated sunlight Appl. Phys. Lett. 94 223504 10.1063/1.3148341
- KaramN H 1999 Development and characterization of high-efficiency Ga0.5In0.5P/GaAs/Ge dual- and triple-junction solar cells Electron Devices, IEEE Trans. 46 2116 25 2116–25 10.1109/16.792006
- KingR RLawD CEdmondsonK MFetzerC MKinseyG SYoonHSherifR AKaramN H 2007 40% efficient metamorphic GaInP/GaInAs/Ge multijunction solar cells Appl. Phys. Lett. 90 183516 10.1063/1.2734507
- DobbieAMyronovMMorrisR J HHassanA H APrestM JShahV AParkerE H CWhallT ELeadleyD R 2012 Ultra-high hole mobility exceeding one million in a strained germanium quantum well Appl. Phys. Lett. 101 172108 10.1063/1.4763476
- ShahV ADobbieAMyronovMLeadleyD R 2010 Reverse graded SiGe/Ge/Si buffers for high-composition virtual substrates J. Appl. Phys. 107 064304 10.1063/1.3311556
- ShahV AMyronovMDobbieALeadleyD R 2013 Introduction of terraces into a reverse linearly graded SiGe buffer on Si(001) substrate and their effect on the buffer's structural properties ECS J. Solid State Sci. Technol. 2 40 4 40–4 10.1149/2.018303jss
- BottegoniFFerrariAIsellaGCecchiSMarconMChrastinaDTrezziGCiccacciF 2012 Ge/SiGe heterostructures as emitters of polarized electrons J. Appl. Phys. 111 063916 10.1063/1.3698290
- ShenC 2010 Spin transport in germanium at room temperature Appl. Phys. Lett. 97 162104 10.1063/1.3505337
- NamDSukhdeoDChengS-LRoyAHuangK C-YBrongersmaMNishiYSaraswatK 2012 Electroluminescence from strained germanium membranes and implications for an efficient Si-compatible laser Appl. Phys. Lett. 100 131112 10.1063/1.3699224
- ShahV 2012 Electrical isolation of dislocations in Ge layers on Si(001) substrates through CMOS-compatible suspended structures Sci. Technol. Adv. Mater. 13 055002 10.1088/1468-6996/13/5/055002
- W BurnsDGuckelH 1990 Thin films for micromechanical sensors J. Vac. Sci. Technol. A 8 3606 10.1116/1.576514
- TsakalakosT 1981 The bulge test: a comparison of the theory and experiment for isotropic and anisotropic films Thin Solid Films 75 293 305 293–305 10.1016/0040-6090(81)90407-7
- TabataOKawahataKSugiyamaSIgarashiI 1989 Mechanical property measurements of thin films using load-deflection of composite rectangular membranes Sensors Actuators 20 135 41 135–41 10.1016/0250-6874(89)87111-2
- VlassakJ JNixW D 1992 A new bulge test technique for the determination of Young's modulus and Poisson's ratio of thin films J. Mater. Res. 7 3242 10.1557/JMR.1992.3242
- BiswasAWellerTKatehiL P B 1996 Stress determination of micromembranes using laser vibrometry Rev. Sci. Instrum. 67 1965 9 1965–9 10.1063/1.1146952
- KarnezosM 1986 Effects of stress on the stability of x-ray masks J. Vac. Sci. Technol. B 4 226 9 226–9 10.1116/1.583444
- BerryB SPritchetW CUzohC E 1989 Dynamical method for the thermomechanical study of thin membranes J. Vac. Sci. Technol. B 7 1565 10.1116/1.584490
- MadenM AJagotaAMazurSFarrisR J 1994 Vibrational technique for stress measurement in films: II, ideal membrane behavior J. Am. Ceram. Soc. 77 625 35 625–35 10.1111/jace.1994.77.issue-3
- TongQ KMadenM AJagotaAFarrisR J 1994 Vibrational technique for stress measurement in films: II, extensions and complicating effects J. Am. Ceram. Soc. 77 636 48 636–48 10.1111/jace.1994.77.issue-3
- Scott BunchJvan der ZandeA MVerbridgeS SFrankI WTanenbaumD MParpiaJ MCraigheadH GMcEuenP L 2007 Electromechanical resonators from graphene sheets Science 315 490 3 490–3 10.1126/science.1136836
- RobinsonJ TZalalutdinovMBaldwinJ WSnowE SWeiZSheehanPHoustonB H 2008 Wafer-scale reduced graphene oxide films for nanomechanical devices Nano Lett. 8 3441 5 3441–5 10.1021/nl8023092
- YuP-LPurdyT PRegalC A 2012 Control of material damping in high-Q membrane microresonators Phys. Rev. Lett. 108 083603 10.1103/PhysRevLett.108.083603
- ForsenE 2005 Appl. Phys. Lett. 87 043507 10.1063/1.1999838
- CimallaVFoersterCWillFTonischKBruecknerKStephanRHeinM EAmbacherOAperathitisE 2006 Pulsed mode operation of strained microelectromechanical resonators in air Appl. Phys. Lett. 88 253501 10.1063/1.2213950
- FartashASchullerI KGrimsditchM 1992 Thin-film modeling for mechanical measurements: should membranes be used or plates? J. Appl. Phys. 71 4244 10.1063/1.350804
- LeissaA W 1969 Vibration of Plates Washington, DC US Govt Printing Office 61
- KinslerL EFreyA R 1962 Physical Acoustics in the Solid Phase New York Wiley
- RumyantsevS LLevinshteinM EShurM S 2001 Properties of Advanced Semiconductor Materials: GaN, AlN, InN, BN, SiC, SiGe New York Wiley
- ShahM M V ADobbieALeadleyD R 2011 Effect of layer thickness on structural quality of Ge epilayers grown directly on Si(001) Thin Solid Films 519 7911 10.1016/j.tsf.2011.06.022
- SaidiMAbardehR H 2010 Air pressure dependence of natural-convection heat transfer Proc. of the World Congress on Engineering 2010 vol II pp 1444–7
- VignolaJ FJudgeJ AJarzynskiJZalalutdinovMHoustonB HBaldwinJ W 2006 Effect of viscous loss on mechanical resonators designed for mass detection Appl. Phys. Lett. 88 041921 10.1063/1.2165186
- LiuXVignolaJ FSimpsonH JLemonB RHoustonB HPhotiadisD M 2005 A loss mechanism study of a very high Q silicon micromechanical resonator J. Appl. Phys. 97 023524 10.1063/1.1819980
- FrankeA EHeckJ MKingT-JHoweR T 2003 Polycrystalline silicon–germanium films for integrated microsystems J. Microelectromech. Syst. 12 160 71 160–71 10.1109/JMEMS.2002.805051
- Wilson-RaeIBartonR AVerbridgeS SSouthworthD RIlicBCraigheadH GParpiaJ M 2011 High- nanomechanics via destructive interference of elastic waves Phys. Rev. Lett. 106 047205 10.1103/PhysRevLett.106.047205
- NorrisA NPhotiadisD M 2005 Thermoelastic relaxation in elastic structures with applications to thin plates Q. J. Mech. Appl. Math. 58 143 63 143–63 10.1093/qjmamj/hbi002
- BömmelH EDransfeldK 1960 Excitation and attenuation of hypersonic waves in quartz Phys. Rev. 117 1245 52 1245–52 10.1103/PhysRev.117.1245
- PalikE D 1997 Handbook of Optical Constants of Solids New York Academic
Appendix
Modelling of heating by a 100 mW laser with 1550 nm wavelength and by an additional 1 mW red laser was done using MATLAB software, with the partial differential equation toolbox. The amount of optically absorbed light was calculated using absorption constants from [Citation40]. The Ge film was modelled in a stationary state (elliptic partial differential equation) with no thermal anchoring to the environment (Neumann boundary conditions with zero heat flux), where the cooling was by natural convection only. All relevant coefficients were taken from reference literature [Citation31], and the values of the convection coefficient are known for atmospheric pressure and at 0.18 mbar [Citation33]. The studied sample was a Si substrate with Ge film grown on top; in one location Si substrate was etched away to reveal a
suspended Ge film. The sample was modelled as a 4 mm by 7 mm Ge film. Figure shows the temperature field in the sample with a laser beam heating a 200
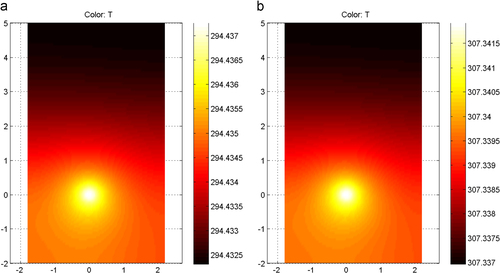
diameter spot on the membrane for 3.2% of the laser beam energy absorbed by the film. The temperature difference between the heated spot and the rest of the film is remarkably small, less than 0.01 K at atmospheric pressure. The appearance of the temperature profile remains the same at different pressures and heating powers, however the temperature scale changes. The temperature rise due to heating is about 1 K at atmospheric pressure and about 14 K at 0.18 mbar. Heating by an additional laser can be introduced by increasing the value of absorbed energy to 4.2 mW, compared to 3.2 mW on figure . This increases the temperature rise at low pressure to 18 K. In reality, losses through the Si substrate would render the temperature rise smaller.
Figure 10 The temperature of the sample in Kelvin at (a) atmospheric pressure or (b) at 0.18 mbar. The bright spot coincides with the position of the laser beam.
The experimental study of the heating effects involved measuring vibrational spectra at the centre of the membrane with and without an additional laser beam on the sample (1 mW red guide laser, fully absorbed by the membrane). Figure shows the effect of using an additional laser during measurement of the vibrational spectra (a) at ambient pressure and (b) at mbar. At ambient pressure, where there is an efficient cooling through convection, there is virtually no shift between spectra taken with or without the extra heating. However, at lower pressures there is a shift of the modes by about 1 kHz to lower frequencies, consistent with the modelling results (0.5–0.8 kHz shift for 1:1 mode and 0.7–1.4 kHz shift for 1:2 mode is predicted at 0.18 mbar due to heating), supporting the suggestion that the heating effects become significant at low pressures.
Figure 11 The spectra of the membrane with and without having an additional laser, operating at 633 nm, 1 mW cm, at (a) atmospheric pressure or (b) in vacuum.
