
Abstract
There can be a large variation in the measured diameter of nanoparticles depending on which method is used. In this work, we have strived to accurately determine the mean particle diameter of 30–40 nm colloidal silica particles by using six different techniques. A quantitative agreement between the particle size distributions was obtained by scanning electron microscopy (SEM), and electrospray-scanning mobility particle sizer (ES-SMPS). However, transmission electron microscopy gave a distribution shifted to smaller sizes. After confirming that the magnification calibration was consistent, this was attributed to sample preparation artifacts. The hydrodynamic diameter, d h , was determined by dynamic light scattering (DLS) both in batch mode, and hyphenated with sedimentation field flow fractionation. Surprisingly the d h were smaller than the SEM, and ES-SMPS diameters. A plausible explanation for the smaller sizes found with DLS is that a permeable gel layer forms on the particle surface. Results from nanoparticle tracking analysis were strongly biased towards larger diameters, most likely because the silica particles provide low refractive index contrast. Calculations confirmed that the sensitivity is, depending on the shape of the laser beam, strongly size dependent for particles with diameters close to the visualization limit.
Introduction
Recent developments in nanoscience and technology have been forecast to result in an industrial revolution [Citation1] with implications for almost all market segments, including energy production and storage, information and communication technologies, construction, and various consumer products including food. One driving force behind these developments is the observation that material properties can sometimes be enhanced by tuning the size of nanoparticles. To support and promote the development it is important to adequately characterize the physicochemical properties of the nanomaterials. Additionally, concerns have been raised owing to possibility of the unforeseen and undesirable biological effects that can be triggered by the enhanced reactivity and special properties of manufactured nanoparticles [Citation2–Citation4], and therefore, it is essential to have tools available to assess the exposure during risk evaluation of nanomaterials. Thus both the development of nanomaterials as well as risk and safety studies requires thorough characterization of nanoparticles, their aggregates, and their transformation products [Citation5, Citation6].
Due to its versatility colloidal silica is one of the most widely spread type of nanoparticles. Silica particles or silica glass surfaces are commonly used as model systems and reference material in coagulation studies, and in rheology, surface force, and contact angle measurements [Citation7]. Many particle size reference materials are based on silica [Citation8]. Colloidal silica is also used extensively in a range of industrial applications, such as flocculation, polishing and ceramics [Citation9], as an additive in cementitious applications [Citation10], or as grouting material [Citation11, Citation12]. Silica nanoparticles are already being used as food additive and in drug delivery applications [Citation13, Citation14]. In many of these applications particle size and size distribution (PSD), as well as the degree of particle aggregation and agglomeration, are among the most important physicochemical properties to determine.
There are a number of methods capable of such measurements; all with their inherent analytical limitations and boundary conditions [Citation15–Citation17]. The analytical window of the different methods differs in aspects such as concentration and size range, degree of sample perturbation, analysis time, and cost. Another line of division is whether the method requires calibration or is absolute in the sense that the accuracy does not rely on previously characterized particle standards.
Validation of particle sizing methods has been discussed by Ehara et al [Citation18]. It was suggested that methods should be validated for concentration, PSD shape, and average diameter for relatively monodisperse samples. This is most readily done by comparing results obtained with different independent methods. Several such studies have already been reported [Citation19–Citation25]. The conclusion that can be drawn from the previous work is that the quality of the analysis is system-dependent and no single method is able to alone yield fully reliable size information about an unknown sample. On the other hand, although it is difficult to discern true method bias from sample specific artifacts; diameters based on contrasting measuring principles should converge in the absence of bias when the sample approaches the ideal case of monodisperse homogenous spheres.
The present study addresses the needs for reliable methods for characterization of colloidal silica. A detailed comparison is provided of PSDs determined using common procedures with transmission electron microscopy (TEM), scanning electron microscopy (SEM), electrospray-scanning mobility particle sizer (ES-SMPS), dynamic light scattering (DLS), nanoparticle tracking analysis (NTA), and sedimentation field flow fractionation (sdFFF) coupled to a DLS detector. Their applicability to nanosized, ∼35 nm silica particles is evaluated. None of these methods require particle standards for their calibration, and the accuracy of TEM, ES-SMPS, NTA, and DLS has already been evaluated for silica particles larger than 100 nm [Citation26]. The data were gathered from two different batches of commercially available silica dispersion. The first batch (sample B) was supplied by IRMM and the measurements were performed as part of an inter-laboratory comparison [Citation27]. This sample was characterized using ES-SMPS, NTA, DLS, and TEM. Additional measurements with SEM, TEM, ES-SMPS, DLS, and sdFFF-DLS were made on a second batch acquired directly from the manufacturer (sample A).
Experimental procedures
Materials
Physical and chemical properties of the two silica dispersions are listed in table S1 in supplementary information (see stacks.iop.org/STAM/15/035009/mmedia). Sample A was a commercially available silica dispersion produced by the ion exchange method (Bindzil 40/130, lot No. 110017) supplied by Eka Chemicals AB (Bohus, Sweden). From production the dispersion was stabilized with a low concentration of Na2O, and it contained no surfactants, buffers or additional stabilizers. These colloids are stable in the pH range 8–10. Sample B was received from IRMM during an interlaboratory comparison study. This dispersion (Bindzil 40/130, lot No. 06 077; Eka Chemicals AB) had been diluted to 0.75 wt% with ultra pure water prior to packaging into pre-scored glass ampoules. The pH had been adjusted to 9.0 with NaOH. Both samples contained silica particles of solid density ∼2.2 g cm−3.
A buffer solution for dilution of the dispersions (ammonium acetate, 20 mM, pH 8.0) was prepared using water purified by a milli-Q purification system (18.2 MΩ cm, Synergy 185, Millipore). The ammonium acetate (pro analysis, Merck) and the ammonia (pro analysis, Scharlau) were used as received. This buffer solution was used for the dilution in all the measurements of sample A and in the ES-SMPS and DLS measurements of sample B.
ES-SMPS method
The ES-SMPS method and experimental setup has been described in detail elsewhere [Citation19, Citation28–Citation30] and it is only briefly presented here. In the method colloidal particles are first transferred from the liquid phase to the gas phase using an electrospray (ES) technique. The produced aerosol particles are subsequently sized depending on their electrical mobility in air and counted by light scattering. The ES-SMPS instrument consisted of a combination of an ES unit (TSI Inc., ES model 3480) and a scanning mobility particle sizer (TSI Inc., SMPS model 3936). The ES unit was operated in the cone-jet mode and produced a dried polydisperse aerosol that passed through a 210Po-bipolar charger where the particle population attained a known charge distribution as described by Fuchs theory [Citation31]. Subsequently, the SMPS system classified the charged particles based on their electrical mobility in air using a nano-differential mobility analyzer (TSI Inc., nDMA model 3085). The voltage was scanned up during a period of 90 s followed by a 45 s down scan. The data in each run was an average of these up and down scans. After classification the particles were counted using a condensation particle counter (TSI Inc., CPC model 3010).The CPC was modified according to the description by Mertes et al [Citation32] to obtain higher detection efficiency for particle diameters below 10 nm, and the lower detection limit, D p50, of the present setup was approximately 5 nm [Citation32]. The experimentally determined particle number concentrations were corrected for the CPC detection efficiency and the equilibrium charge distribution generated by the bipolar charger in the ES unit.
The ES unit transfers silica particles to the gas phase without causing aggregation provided that the sample has been sufficiently diluted [Citation28]. Concentrations >0.04 wt% SiO2 caused aggregation in the present systems, as revealed by measured size distributions, and the silica dispersions were diluted in the ammonium acetate buffer solution to final concentrations of 0.002, 0.004 and 0.02 wt% SiO2 (sample A) and 0.0075 wt% SiO2 (sample B). These concentrations are below the solubility of silica in this media [Citation33]. However, previous studies showed that the effect of silica particle dissolution was negligible on the time scale of tens of minutes used in the measurements [Citation28].
SEM
Micrographs of the particles in sample A were obtained with a scanning electron microscope (LEO 55 Ultra field emission SEM) using an acceleration voltage of 5 kV in the secondary electron mode. A 100 000 times magnification were used for the images. The magnification had been calibrated for up to 50 000 times magnification using a specimen containing an array of grooves with a known spacing. The accuracy of higher magnifications was based on extrapolation. Substrates for the SEM measurements were prepared by deposition of a 0.1 mL droplet of a highly diluted particle suspension (0.004 wt% SiO2) on a silicon wafer. Images were acquired from randomly chosen locations and analyzed with the scanning probe image processor software (SPIP, Image Metrology Inc.). Since overlap between particles was significant, it was considered more reliable to identify and measure the particle diameters manually. The sizes of the particles were determined in the following way. A crosshair with orthogonal axes was placed at the center of each particle. The crosshair was adjusted to make one of the axes coincide with the longest dimension of the particle, and the diameter was then calculated as the average dimension along the two axes. 2623 particles were measured to obtain a binned size distribution (bin size 2 nm).
TEM
TEM analyses were carried out with a FEI Tecnai F20 equipped with a LaB6 electron gun and operated at 200 kV. The 200 000 times magnification that was used had been calibrated using the lattice constants of materials with known crystal structures. The TEM had thus an independent magnification calibration performed in the magnification range used in this study. The colloidal dispersion of sample A was diluted (final concentration 0.004 wt% SiO2) while sample B was used as received. A drop of the colloidal dispersion was placed on a 3 mm Au grid coated with a holey carbon film. The grid was placed on a Kleenex sheet that absorbed liquid flowing through the perforated film, and the sample was left to dry in air for a few minutes before being stored in a plastic container sealed with parafilm prior to the TEM analysis. Images were acquired from randomly chosen areas using a 2k × 2k CCD camera. All images were acquired in the bright field mode and at a slight underfocus in order to enhance the contrast and more clearly reveal the edges of the particles. The particle sizes were determined as described previously for the SEM. For samples A and B 1004, and 1006 particles were measured respectively.
DLS
A Malvern Zetasizer Nano ZS (ZEN 3600, λ = 633 nm, θ = 173°) was used for the DLS [Citation34] measurements of samples A and B. The sample was analyzed in quartz cuvettes, the temperature was set to 25 °C and the viscosity and refractive index values used were that of pure water. For each measurement data was acquired during 40 s in three runs. For sample A a concentration series (4, 1, 0.5, 0.1, 0.02, and 0.01 wt% SiO2) was prepared by diluting the sample with the ammonium acetate buffer solution. Whereas sample B was first analyzed as received (0.75 wt% SiO2 diluted in MQ water), and then further diluted with ammonium acetate solution (0.075, 0.015, and 0.0075 wt% SiO2). Additional measurements with θ = 90°and 45° were done on sample A (0.5 wt% SiO2) using a setup consisting of ALV CGS-5022 F goniometer equipped with a JDS uniphase laser (Model 1218-2, λ = 632.8 nm), ALV/LSE 5001 light scattering electronics, and an ALV-6010/160 Multiple Tau digital Correlator.
NTA
Sample B was also analyzed with NTA using a Nanosight LM10 (Nanosight Ltd, UK) with a high sensitivity camera (Andor DL-658M-OEM, Andor Technology PLC, Belfast, BT127AL, Northern Ireland). In NTA the trajectories of particles undergoing Brownian motion are tracked using video microscopy. By illuminating the particles from a 90° angle by an intense laser beam it is possible to visualize particles considerably smaller than the diffraction limit. The diffusion constants are calculated from the distance a particle travels during the time it is visible. The reader is referred to Malloy and Carr for a detailed description of the method [Citation35].
Samples were diluted in ultra pure water to a number concentration suitable for the NTA analysis. A concentration of 3.5 × 10⁻⁷ wt% silica was used, and pH adjusted to 8.5 using NaOH. The settings for capturing the video, and image processing parameters were optimized in order to maximize the number of particles identified as such, and tracked.
sdFFF
The particles were size fractionated [Citation36] using a postnova CF2000 instrument equipped with nephelometric (Jasco FP-920 ; wavelength 650 nm, 90° scattering angle), and DLS (Malvern zetasizer S173 with a quartz flow cell) detectors. The temperature was set to 25 °C for the DLS measurements, the angle was 173°, and a 3 s acquisition time was used for each data point. The viscosity and refractive index was assumed to be that of pure water. The carrier medium was the ammonium acetate buffer filtered through a 200 nm membrane filter. The maximum rotational speed of 4925 rpm and a focusing time of 30 min were necessary to achieve size fractionation. The flow rate was set to 1 mL min−1. The silica dispersions were diluted to 0.2 wt% and three replicates were injected using a 100 μL sample loop.
Results and discussion
Morphology and polydispersity
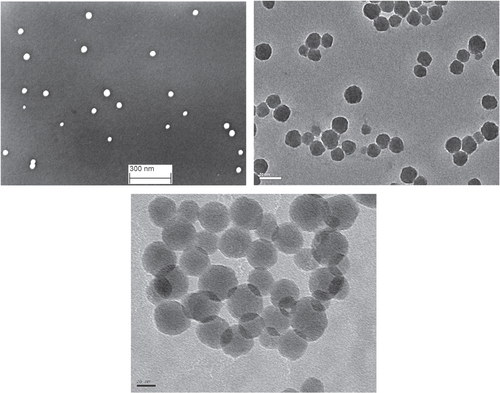
Typical SEM and TEM micrographs of samples A and B are shown in figure . The particles were close to spherical, with the ratio of major and minor axis being on average 1.09, and never higher than 1.3. The equivalent spherical diameters provided by electron microscopy and ES-SMPS should therefore not differ more than 9% due to particle shape effects. However, the differences should in practice be considerably smaller because the diameter measured by electron microscopy is an average between the major axis and the axis perpendicular to it, and the ES-SMPS diameter is orientation averaged due to rotational motion of the particles. The hydrodynamic diameter is also influenced by interactions between particles and the dispersion media, which will be discussed later. The DLS measurements showed a clean decay of the autocorrelation function and a low polydispersity index (0.037 for sample B 0.75 wt%, and 0.020 for sample A 1.0 wt%). This indicates that no or very few aggregates were present in solution. The aggregates seen in SEM or TEM images could be attributed to the drying process during sample preparation.
Figure 1 Secondary electron SEM, and bright field TEM images of samples A and B.
Comparison between number weighted PSDs
The SEM, ES-SMPS, and TEM distributions for sample A are shown in figure . The size distributions obtained by TEM and ES-SMPS for sample B are shown in figure . They consist of a main peak with a shoulder of smaller particles. Gaussian distributions were fitted to the main peak (software; Graph pad Prism) and the fits are shown as solid lines in the figures. The average diameters, and the widths of the distributions in relative standard deviation, RSD are listed in table . The mean of the fitted Gaussians is called mode in the table.
Figure 2 Number size distributions obtained with ES-SMPS, SEM, and TEM for sample A. Fitted Gaussians are shown as solid lines.
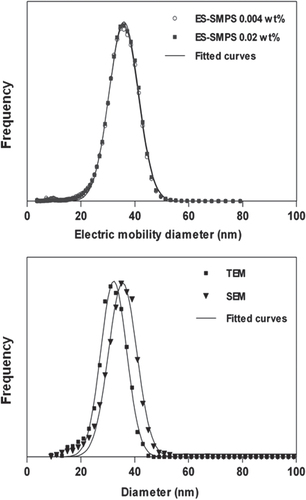
Figure 3 Number size distributions obtained with TEM and ES-SMPS for sample B. Fitted Gaussians are shown as solid lines; a sample concentration of 0.0075 wt% SiO2 was used for the ES-SMPS analysis.
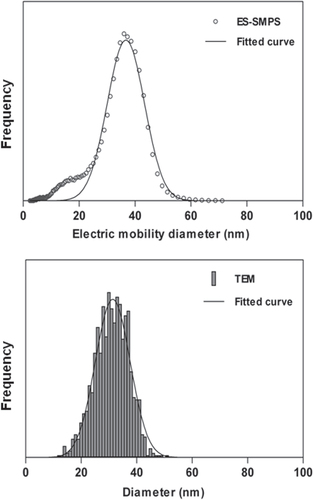
Table 1 The mean and z-average diameters, together with the width of the PSD obtained for samples A and B with different methods. The uncertainty values are 95% confidence intervals. The RSD value is the spread in particle diameters.
The ES-SMPS size distributions were normalized according to the procedure described by Johnson et al [Citation28]. A 95% confidence interval, CI was calculated for the ES-SMPS diameter from the root sum of squares of the variation among replicates, and the ∼3% accuracy [Citation37] of the instrument (table ). The estimation of uncertainty presented in [Citation37] is for an instrument operated in the stepping mode. Additional bias may be introduced if the voltage is scanned continuously and rapidly. There was however no significant differences between the diameters obtained for the up and down scans, wherefore this error source could be excluded.
For the microscopy methods an approximation to a 95% CI for the diameter due to finite number of examined particles was calculated by ±1.96e sm , where e sm is the standard error of the mean. e sm was 0.12 nm for the SEM diameter, and 0.17 and 0.19 nm respectively for the TEM sizes of samples A, and B. To calculate the total uncertainty of particle diameter it was also taken into account that the magnification was only known within ∼5%. The particle edges are not infinitely sharp. The precise location of them is difficult, and the noise and limited resolution adds an uncertainty of 3.3 and 1.6 nm to the SEM, and TEM diameters respectively. The total uncertainties in diameter were calculated from the root sum of squares of the individual contributions and are listed in table .
The ES-SMPS confirmed that very few large aggregates were present. A slight size increase of the ES-SMPS diameter with respect to the actual physical diameter may occur due to evaporation residues on the aerosol particles [Citation28]. The main source of the evaporation residues is the semi-volatile buffer solution used in the ES unit. For our setup the initial droplet diameter was measured to ∼40 nm following the procedure of Chen et al [Citation38]. Assuming that there is no removal of substance with evaporation from the initial droplet of the buffer solution (i.e. if a silica particle is present in the droplet, all the dissolved material will be deposited on the particle) then the corresponding diameter increase for a 35 nm particle would be 0.02 nm. Dissolved silicate species in the samples may also form residues; however, further dilution of the sample in the buffer solution did not result in any decrease of size. Therefore, it was concluded that, on the contrary to the results obtained by Lenggoro et al [Citation19] the overall influence of evaporation residues in these ES-SMPS measurements could be neglected.
The SEM diameter of sample A agrees with ES-SMPS, but is notably larger than the size measured by TEM. To identify the cause for the differing SEM and TEM results, identical particles were examined in both microscopes (figures S1 and S2 in the supplementary information; see stacks.iop.org/STAM/15/035009/mmedia). Particles appear ∼3% larger in the SEM than in the TEM microscope. This difference arises probably from a combination of inconsistent calibration of magnification, and the different ways contrast is produced in the microscopes. The particles may appear larger in SEM because secondary electron emission increases before the center of electron beam reaches the particle edge. On the contrary silica produces poor contrast in TEM wherefore the edges are not necessary visualized. Such effects can however not fully account for the ∼9% difference in mean particle diameter between microscopes.
Another type of error is introduced if the ensemble of measured particles is not fully representative for the sample. The SEM sample was prepared by smearing a droplet of dispersion on a silicon wafer. All the particles contained in the droplet are likely to be retained on the wafer, and no detectable bias is introduced to the particle population. The reliability of the sample preparation method has been confirmed in previous work, where a good agreement between ES-SMPS and SEM were obtained for similarly prepared silica samples [Citation28, Citation39]. The sample for TEM was prepared by casting a drop of dispersion on a holey carbon grid placed on a Kleenex sheet. During this procedure the dispersion flows though the holes in the perforated grid. The smaller particles have a higher propensity to diffuse across the streamlines and settle on the carbon film. This leads to a bias towards smaller sizes. The phenomenon was also observed by Baalousha et al [Citation25]. The TEM results were therefore concluded to be unreliable due to sample preparation artifacts.
DLS
The DLS measurements were performed using a 173° scattering angle, θ, and the diffusion coefficients were calculated by the method of cumulants [Citation40]. The diffusion coefficient is influenced by interactions between particles and depends linearly on concentration [Citation41, Citation42]. Therefore the diameters of samples A and B were determined by measuring the diffusion coefficient, D, at different particle concentrations and extrapolating to infinite dilution to obtain D
0. The diameter obtained from the first cumulant approaches for low scattering angles, and monodisperse samples of small particles obeying Rayleigh’s law the harmonic z-average given by [Citation43, Citation44]:1 where d
z is the harmonic zeta-average diameter, and n
i
is the number of particles with diameter d
i
.
To correct for polydispersity, sample A (0.5 wt%) was in addition to 173° measured using θ of 90°, and 45°. The diameters obtained for these angles were 36.4, 35.9, and 34.9 nm respectively. The apparent diameter was plotted against the square of the scattering vector, q = 4πn/(λ) × sin (θ/2), where n is refractive index of the dispersion media, and λ the wavelength of the laser. Linear extrapolation (r 2 = 0.944) to q = 0 gave 34.8 nm, which indicates that the particles are probably appearing ∼4.6% larger than the true z-average diameter for measurements done at 173° angle. The diameter of 0.01 wt% silica did not change within 15 h from dilution, proving that dissolution did not affect these DLS measurements.
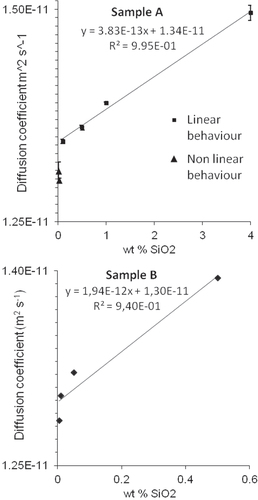
In figure the diffusion coefficient is shown as a function of concentration for samples A, and B. The diffusion constant decreases initially linearly as the concentration is reduced. The behavior at low concentrations deviates from linearity, with the diffusion coefficient appearing smaller than what could be predicted from the initial trend. This behavior has been observed earlier, and the phenomenon was recently explained by the tendency of particles to concentrate in the vicinity of large aggregates [Citation45]. Deviation from linearity can be caused by an aggregate concentration as low as of 1/106 of the total number of particles, and the results obtained here do therefore not contradict the claims of the dispersion being virtually aggregate free. For sample A only the data points in the linear region have been considered in the extrapolation procedure. For sample B the data does not allow to clearly distinguish between the linear and nonlinear regions.
Figure 4 The diffusion coefficient measured by DLS as a function of concentration for sample A, upper panel and B, lower panel. The error bars show the standard deviation of the at least three independent measurements madefor each concentration. The error bars for sample B are too small to be shown.
The nonrandom uncertainty in DLS measurements depends mainly on the acquisition time of the autocorrelation function, and the accuracy at which the temperature and refractive index of the media is known. It was evaluated using the scheme by Takahashi et al [Citation46, Citation47], where the contribution of finite acquisition time estimated according to Pusey and Vaughan [Citation34]. The uncertainty amounted to 0.75% for both sample A and B (95% CI). The RSD among replicate measurements was ∼0.5% in the investigated concentration range. The hydrodynamic diameters calculated from the D 0 values are listed in table . The 95% CI of the y intercepts in figure were considered to be the random uncertainty in these measurements. The uncertainties listed in table are the root sum of squares of the random and nonrandom uncertainty.
Hyphenated sdFFF—DLS
The field flow fractionation experiments were done in three replicate runs. In the upper panel of figure the nephelometric signal is shown together with the DLS diameters as a function of time for one of the runs. Initially some unretained particles elute at the void time followed by gradually increasing size separation. Where separation was achieved, the DLS data was fitted with a third order polynomial. The polynomial fit was used to create the intensity and number weighted PSDs shown in the lower panel. To correct for the size dependence of scattered light intensity it was assumed that the particles obey Rayleigh’s scattering law. Extrapolated values of the polynomial were used in the region of overlap with the void peak. This was done to avoid using DLS data affected by the large particles eluting with the void peak. The average silica concentration in the eluting peak was low enough (∼0.0027 wt%) for effects due to interactions between particles to be negligible. The measured diffusion coefficient is independent of the flow rate provided it is laminar, without velocity gradients, and slow enough to not introduce or remove significant amount of particles from the interaction volume of the laser during the decay time of the correlation function [Citation48, Citation49]. It was confirmed that the diffusion coefficient is independent of flow rate at least up to 5 mL min−1 by injecting the sample into the DLS instrument with a syringe pump.
Figure 5 Upper panel: the sdFFF fractogram and the DLS diameters fitted with a third order polynomial. Lower panel: the number and intensity weighted PSDs. In the shaded areas the diameters were obtained by extrapolating the polynomial fit due to overlap with the void peak.
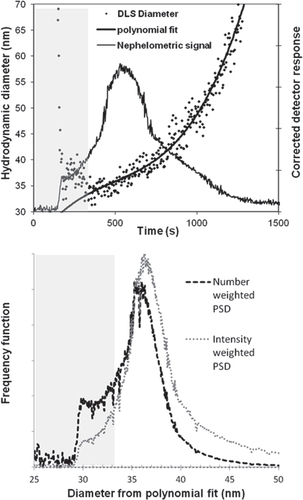
The average DLS diameter of the number weighted fractogram (table ) can be compared with the results of batch DLS. A slightly smaller diameter was obtained when the sample was size fractionated because the autocorrelation functions were acquired on more monodisperse dispersions. The diameters varied considerably around the fitted line (RSD 4.13%). This limits the accuracy for small segments of the PSD, however such variation is of little importance for the overall mean diameter whose repeatability was comparable to that of the batch DLS (RSD was 0.56% among the three replicates). The 95% CI calculated from variation among the replicate measurements was considered to be the random uncertainty in these measurements. The nonrandom uncertainty was again estimated to ∼0.75%.
Comparison between physical and hydrodynamic diameters
To allow comparison of the hydrodynamic diameter, d
h
with the physical diameter of the dry particles that were measured most accurately by ES-SMPS, the number average diameters were recalculated to z-averaged ones according to equation (Equation11 ) (table ). The d
h
is usually larger than physical diameter because it includes waters of hydration. However; contrary to e.g. TiO2 [Citation50], the d
h
of these silica particles are ∼10–15% smaller than the physical diameters. This could be due to asymmetric shape, because the d
h
is for a nonspherical particle slightly closer to the diameter of the minor axis, than that of the major. However, for these particles shape effects should only cause the d
h
to appear ∼1.5% smaller than the physical diameter [Citation51].
The anomalous results might be explained by the surface properties of silica. It has been shown that the viscosity of nanometer thin layers of water confined between two silica surfaces do not differ from that for the bulk [Citation52]. Silica surfaces do thus not bind water strongly enough to affect the diffusion of the particles. Furthermore, it is suspected that a gel layer consisting of silica chains protruding from the surface forms in contact with water [Citation7, Citation53]. Evidence for such layer on similar silica particles has been obtained earlier using small angle x-ray scattering in combination with ES-SMPS [Citation39]. The solid core of the particle shrinks upon formation of such layer. If the gel layer is highly permeable to the dispersion media, its contribution to the particles friction coefficient could be too small to compensate for the shrinking core diameter [Citation54]. In this case the hydrodynamic diameter would be smaller than the physical diameter measured in dry state.
NTA
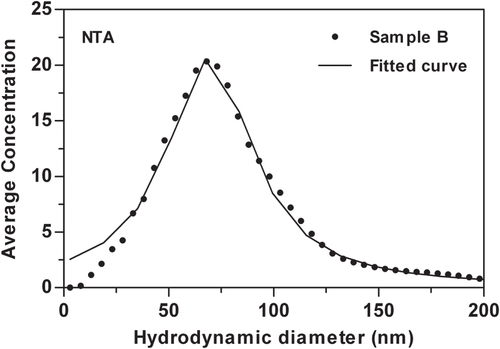
The PSD obtained for sample B using NTA is shown in figure . This distribution was strongly shifted towards larger particles with a peak diameter around 60 nm and wide tails. A Lorentzian distribution was found to be most adequate to describe this PSD and the fit is shown as a solid line in the figure . The diameter obtained with NTA disagrees with the other methods in such extent that it cannot be considered credible. This method has previously produced correct size distributions for e.g. ∼100 nm silica particles [Citation26], and gold nanoparticle standards of 30 and 60 nm nominal sizes [Citation55]. Silica is however a poor light scatterer, and despite some ∼30 nm particles are detected and tracked, the particle population fall below the limit of accurate sizing.
Figure 6 The size distribution obtained with NTA. Fitted Lorentzian distribution is shown as the solid line.
The observed bias may be explained by that the laser beam illuminating the sample has a Gaussian intensity profile, and large strongly scattering particles can be visualized further from the beam center than small ones [Citation35]. This leads to a size dependence of sensitivity, which was described by a model in a recent paper [Citation56]. That the inhomogeneous illumination is the reason for that the particles appear larger is supported by the fact that the number concentration measured by NTA (2.8 × 10⁸ particles mL−1) was approximately 43 times lower than that calculated from the mass concentration assuming 35 nm spherical particles (1.2 × 10¹⁰ particles mL−1). On very short timescales the average displacement in a given time period is larger for particles with high density than for particles with low density. This would lead to an overestimation of the particle size compared to a heavier particle of the same size, but such effects were deemed to be insignificant for the frame rates used here [Citation57].
To obtain more detailed information about how inhomogeneous illumination affects the results, the light scattering power, and corresponding sensitivity (detection volume) were calculated as a function of size, and shown in figure (calculation procedures are described in the supplementary information; see stacks.iop.org/STAM/15/035009/mmedia). Since the actual beam shape of the NTA system is not well known the calculations were repeated for two values of the shape parameter c, with 1 representing a narrow, and 10 a wide beam. The total intensity of the beams was kept constant. The same value for I thresh was used for both beams. It was adjusted to give a limit of visualization close to 30 nm diameter.
Figure 7 Upper panel: the scattering power as a function of size for spherical silica particles. The results were obtained using Mie theory implemented in the ScatLab 1.2 software. Lower panel: the sensitivity of NTA instrument for silica particles as a function of size: details of the calculations are shown in the supporting information (see stacks.iop.org/STAM/15/035009/mmedia). Two Gaussian shaped laser beams with different intensity profiles but equal total intensity were investigated. For a narrow beam (solid line) and a broad beam (dashed line), the parameter c in equation (S7) of the supporting information were set to c = 1, and c = 10, respectively. The threshold intensity for detection was set to give a visualization limit close to 30 nm.
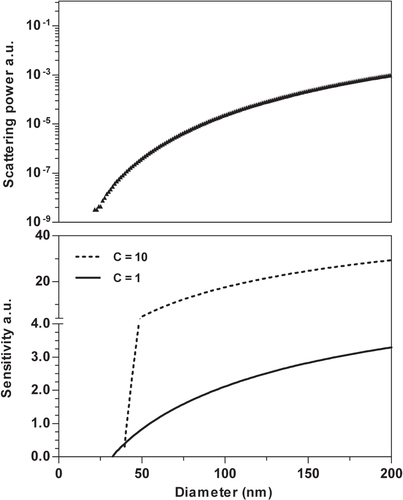
Figure show that the light scattering power of the particles increases an order of magnitude within the modal size range (30–40 nm). This translates into a variation of the instrument sensitivity that is dependent on the beam intensity profile. A narrow beam gives a lower visualization limit than a wide beam, but this comes at the expense of a lower sensitivity for larger particles. It should be noted that with increasing particle size the detection volume eventually reaches an upper limit determined by the size of the area being imaged in the horizontal plane, and for still larger particles the microscope’s depth of focus sets the limit in the vertical direction [Citation56]. This has not been accounted for in these calculations wherefore one should only consider the behavior close to the visualization limit. From these theoretical considerations it can be concluded that accurate sizing of nanoparticles close to the material dependent visualization limit is likely to be impossible due to the inhomogeneous illumination.
Conclusions
The SEM and ES-SMPS methods used here were capable of measuring reliable number based PSDs of nanosized silica particles. The PSD measured by TEM on the other hand was biased due to the preferential adsorption of smaller particles on the grid. Despite the occurrence of such sample preparation artifacts being known, no, or only little work has been done for validating electron microscopy sample preparation methods for bias.
It is commonly assumed for DLS measurements that the concentration dependence of diffusion coefficients is linear for samples that are dilute enough for multiple scattering effects to be negligible. However, here it was found that the diffusion constant deviates from linearity at low concentrations (< 0.1 wt%) due to clustering of the particles around aggregates. Therefore the concentrations for the D 0 extrapolation should be chosen with care to avoid overestimating the diameter due to such effects.
Contrary to expectations, the hydrodynamic diameter was smaller than the diameter for dry particles measured by SEM and ES-SMPS. The anomalously small diameter was repeatedly observed for two batches of the dispersion, and a different measurement set up involving size fractionation with sdFFF. These findings can be explained by a permeable gel layer that forms on the particle surfaces in contact with water.
NTA was unable to correctly measure the PSD for the investigated silica dispersion. The technique has previously provided accurate size distributions for numerous different materials, including large silica particles. However the particles studied here are barely discernible. Regardless of the shape of the beam intensity profile, the inhomogeneous illumination renders the sensitivity strongly size dependent close to the visualization limit. Therefore it should be evaluated for each material in which size ranges accurate sizing is possible.
Acknowledgments
We thank Eka Chemicals AB for supplying the batch of Bindzil 40/130 and the information concerning physical and chemical properties of the dispersions, Dr Zareen Abbas for commenting the manuscript, and Dr Johan Bergenholtz for scientific insights and valuable help with interpretation of the DLS measurements. We thank the Research School Environment and Health for funding JT, and the Environmental Research Council FORMAS for funding JG-U and MH, and the Gothenburg University strategic nanoparticle platform for funding JP-H.
References
- RocoM C 2011 J. Nanopart. Res. 13 427 10.1007/s11051-010-0192-z
- NelAXiaTMadlerLLiN 2006 Science 311 622 10.1126/science.1114397
- MaynardA DWarheitD BPhilbertM A 2010 Tox. Sci. 120 109 10.1093/toxsci/kfq372
- HandyR DVon der KammerFLeadJ RHassellövMOwenRCraneC 2008 Ecotoxicology 17 287 10.1007/s10646-008-0199-8
- AlvarezP J JColvinVLeadJ RStoneV 2009 ACS Nano 3 1616 10.1021/nn9006835
- NowackBRanvilleJ FDiamondSGallego-UrreaJ AMetcalfeCRoseJHorneNKoelmansA AKlaineS J 2012 Environ. Toxcol. Chem. 31 50 10.1002/etc.726
- YaminskyV VNinhamB WPashleyR M 1998 Langmuir 14 3223 10.1021/la9713762
- BraunAKestensVFranksKRoebbenGLambertyALinsingerT P J 2012 J. Nanopart. Res. 14 1021 10.1007/s11051-012-1021-3
- IlerR 1979 The Chemistry of Silica New York Wiley Interscience
- OtterstedtJ-EGreenwoodP 1994 The Colloid Chemistry of Silica BergnaH Washington, DC American Chemical Society 738 42 738–42
- FunehagJGustafsonG 2008 Tunn. Undergr. Sp. Tech. 23 1 10.1016/j.tust.2006.12.005
- FunehagJGustafsonG 2008 Tunn. Undergr. Sp. Tech. 23 9 10.1016/j.tust.2006.12.004
- MartinK R 2007 J. Nutr. Health. Aging 11 94
- SlowingI ITrewynB GGiriSLinV S Y 2007 Adv. Funct. Mater. 17 1225 10.1002/adfm.200601191
- HassellövMKaegiR 2009 Analysis and characterization of manufactured nanoparticles in aquatic environments Nanoscience and Nanotechnology: Environmental and Human Health Implications LeadJ RSmithE New York Wiley Interscience 211 216 211–6
- TiedeKBoxallA B ATearS PLewisJDavidHHassellövM 2008 Food Addit. Contam. 25 795 10.1080/02652030802007553
- HassellövMReadmanJ WRanvilleJ FTiedeK 2008 Ecotoxicology 17 344 10.1007/s10646-008-0225-x
- EharaKSakuraiH 2010 Metrologia 47 S83 10.1088/0026-1394/47/2/S09
- LenggoroI WXiaBOkuyamaKde la MoraJ F 2002 Langmuir 18 4584 10.1021/la015667t
- LeeSRaoS PMoonM HGiddingsJ C 1996 Anal. Chem. 98 1545 10.1021/ac9511814
- BootzAVogelVSchubertVKreuterD 2004 Eur. J. Pharm. Biopharm. 57 369 10.1016/S0939-6411(03)00193-0
- MahlDDiendorfJMeyer-ZaikaWEppleM 2011 Colloids Surf. A 377 386 10.1016/j.colsurfa.2011.01.031
- DieckmannYColfenHHofmannHPetri-FinkA 2009 Anal. Chem. 81 3889 10.1021/ac900043y
- BaaloushaMLeadJ R 2012 Environ. Sci. Technol. 46 6134 10.1021/es301167x
- BaaloushaMYonJ NColeP AGaiserBFernandesT FHriljacJ AJepsonM AStoneVTylerC RLeadJ R 2012 Environ. Toxicol. Chem. 31 983 10.1002/etc.1785
- BellN CMinelliCTompkinsJStevensM MShardA G 2012 Langmuir 28 10860 10.1021/la301351k
- LambertyAFranksKBraunAKestensVRoebbenGLinsingerT P J 2011 J. Nanopart. Res. 13 7317 10.1007/s11051-011-0624-4
- JohnsonAGreenwoodPHagstromMAbbasZWallS 2008 Langmuir 24 12798 10.1021/la8026122
- KaufmanS L 1998 J. Aerosol. Sci. 29 537 10.1016/S0021-8502(97)00462-X
- SongD KLenggoroI WHayashiYOkuyamaKKimS S 2005 Langmuir 21 10375 10.1021/la0513196
- HussinAScheibelH GBeckerK HPorstendorferK H 1983 J. Aerosol. Sci. 14 671 10.1016/0021-8502(83)90071-X
- MertesSSchroderFWiedensohlerA 1995 Aerosol. Sci. Technol. 23 257 10.1080/02786829508965310
- GunnarssonIArnorssonS 2000 Geochim. Cosmochim. Acta 64 2295 10.1016/S0016-7037(99)00426-3
- PuseyP NVaughanJ M 1975 Light Scattering and Intensity Fluctuation Spectroscopy DaviesM UK Royal Society of Chemistry 48 105 48–105
- MalloyACarrB 2006 Part. Part. Syst. Char. 23 197 10.1002/ppsc.v23:2
- SchimpfMCaldwellKGiddingsJ C 2000 Field-Flow Fractionation Handbook New York Wiley
- KinneyD YPuiD Y HMulhollandG WBrynerN P 1991 J. Res. Natl. Inst. Stand. Technol. 96 147 10.6028/jres.096.006
- ChenD RPuiD Y HKaufmanS L 1995 J. Aerosol Sci. 26 963 10.1016/0021-8502(95)00027-A
- JohnssonACameraniM CAbbasZ 2011 J. Phys. Chem. B 115 765 10.1021/jp1057995
- KoppelD 1972 J. Chem. Phys. 57 4814 10.1063/1.1678153
- CichockiBFelderhofB U 1988 J. Chem. Phys. 89 1049 10.1063/1.455256
- Van den BroeckCLostakFLekkerkerkerH N W 1981 J. Chem. Phys. 74 2006 10.1063/1.441244
- BrownJ CPuseyP NDiezR 1975 J. Chem. Phys. 62 1136 10.1063/1.430557
- PuseyP NVan MegenW 1984 J. Chem. Phys. 80 3513 10.1063/1.447195
- Perez-HolmbergJAbbasZAhlbergEHassellövMBergenholtzJ 2011 J. Phys. Chem. C 115 13609 10.1002/ppsc.200700015
- TakahashiKKatoHSaitoTMatsuyamaSKinugasaS 2008 Part. Part. Syst. Char. 25 31 10.1002/ppsc.200700015
- MeliF 2012 Meas. Sci. Tech. 23 125005 10.1088/0957-0233/23/12/125005
- ChowdhuryD PSorensonC MTaylorT WMerklinJ FLesterT W 1984 Appl. Opt. 23 4149 10.1364/AO.23.004149
- CarrR J GRarityJ GStansfieldA GBrownR G WClarkeD JAtkinsonT 1988 Anal. Biochem. 175 492 10.1016/0003-2697(88)90573-8
- AbbasZPerez-HolmbergJHellströmA KHagströmMBergenholtzJHassellövMAhlbergE 2011 Colloids Surf. A 384 254 10.1016/j.colsurfa.2011.03.064
- JenningsB RParslowK 1988 Proc. R. Soc. A., Math. Phys. Sci. 419 137 10.1098/rspa.1988.0100
- HornR GSmithD THallerW 1989 Chem. Phys. Lett. 162 404 10.1016/0009-2614(89)87066-6
- VigilGXuZ HSteinberg SSIsraelachviliS 1994 J. Colloid Interface Sci. 165 367 10.1006/jcis.1994.1242
- MasliyahJ HNealeGMalysaKVandevenT G M 1987 Chem. Eng. Sci. 42 245 10.1016/0009-2509(87)85054-6
- Gallego-UrreaJ ATuoriniemiJPallanderTHassellövM 2010 Environ. Chem. 7 67 10.1071/EN09114
- Gallego-UrreaJ ATuoriniemiJHassellövM 2011 TrAC Trends Anal. Chem. 30 473 10.1016/j.trac.2011.01.005
- LyklemaJ 2005 Fundamentals of Interface and Colloid Science, Particulate Colloids 1st edn Waltham, MA Academic