
Abstract
First-principles calculations were carried out to elucidate the excellent control of p–n characteristics recently reported for yttrium aluminoborides YxAlyB14 with different occupancies of Al sites
. Such control of the occupancy of metal sites in borides is unusual. Calculations based on detailed x-ray diffraction data reveal a stable configuration of the atomic sites, indicating that such variation in occupancy is possible. A shift from positive through zero to negative values of the Seebeck coefficient is also clearly illustrated by determining the density of states for different configurations.
Introduction
The usefulness of direct conversion of waste heat into electricity is a strong incentive for developing viable thermoelectric (TE) materials, and such development is actively conducted across the globe by using state-of-the-art nanotechnology and nanomaterials [Citation1, Citation2]. Materials that can function at high temperature are particularly sought after. In this regard, boron cluster compounds are attractive materials due to their stability and high melting points above 2200 K. Many novel compounds of this type with interesting structures have been discovered in recent years [Citation3]. Furthermore, such compounds have been found to possess low thermal conductivity, κ, even for single crystals, which is an inherent advantage for TE application [Citation4–Citation8]. The main constituent element, boron, is also relatively abundant and nontoxic, whereas traditional TE materials often include expensive and/or toxic elements, such as bismuth, tellurium, lead, and silver.
Boron carbide is a good p-type high-temperature TE compound, and one of the few commercialized TE materials [Citation9, Citation10]. However, TE modules require p-type and n-type materials with matching structure, and the lack of a suitable matching n-type counterpart for boron carbide has been a longstanding problem since icosahedral boron compounds have been found to be predominantly p-type. Slack first showed the n-type characteristics of vanadium-doped β-boron [Citation11, Citation12], and extensive tests have been conducted for various dopants [Citation13–Citation15]. However, all such n-type borides undergo metallization, whereby the Seebeck coefficient decreases with increasing temperature, in contrast to the temperature dependence of boron carbide. Recently, a series of rare earth borocarbonitrides, RB17 CN and RB22C2 N (R = rare earth), which are in homologous structural relationship with boron carbide, were considered to be the long-awaited intrinsically n-type counterparts of boron carbide [Citation16, Citation17]. However, these compounds are hard to densify, and this problem is being investigated [Citation18, Citation19]. RB44Si2 is another novel boride with Seebeck coefficient, α, greater than at high temperature, and unlike most compounds, the dimensionless figure of merit, ZT, shows a steep increase at above 1000 K [Citation20]. Boron sulfide B6S1−x
also has a large Seebeck coefficient, but with potentially much lower processing temperature in comparison with typical borides [Citation21].
In a recent striking development, it was discovered that yttrium aluminoborides Y
x
Al
y
B14 allow for excellent variation of
, showing p-type or n-type characteristics depending on the y occupancy of Al sites [Citation22]. Since the difficulty of controlling the p–n characteristics of materials has traditionally been one of the major obstacles to developing applicable TE materials, the discovery of a method for such control in a group of compounds with the same basic crystal structure (therefore ensuring close structural match) and no need for doping of foreign elements (therefore eliminating migration problems) is extremely valuable. This discovery is furthermore surprising since in metal borides the possible variation in the occupancy of metal sites has been found to be rather small, for example, in MB6, MB12, MB25, MB66 (M = metal), the recently discovered borides mentioned above, and even yttrium aluminoborides such as RAlB4 [Citation23] and the previously reported RAlB14 (
Al∼0.7B14) itself [Citation24, Citation25].
Against this background, to elucidate this surprising behavior we carried out a theoretical investigation on based on crystallographic parameters determined from detailed x-ray diffraction (XRD) Rietveld analysis of yttrium aluminoborides. Figure shows the schematic structure of YAlB14, where the a–c plane of the compound is viewed directly from above. The black square in the lower left corner of the figure corresponds to one unit cell of the compound. The compound has four formula units in one orthorhombic cell with space group Imma. There are crystallographically independent boron atoms (B1, B3, B4, and B5), which form B12 icosahedra, and bridging boron atoms (B2), which are located between the B12 atoms.
Figure 1 Crystal structure of Y x Al y B14.
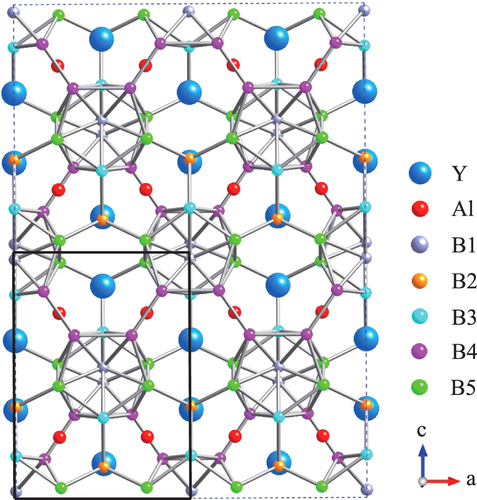
Here we consider a series of Y x Al y B14 compounds with varying x and y and study their electronic properties through total energy calculations in order to understand the effects of metal concentrations on the control of p–n characteristics. In section 2, we discuss our experimental and calculation procedure, and the results are given in section 3. A summary is given in section 4.
Experimental and calculation methods
The crystallographic parameters for the calculations were determined from Rietveld refinement of actual Y
x
Al
y
B14 samples synthesized as described previously [Citation22]. The starting materials YB4 (99.9%, Japan New Metals), B (99%, New Metals and Chemicals), and excess Al which served as flux (99%, Wako Pure Chemical Industries) were mixed with nominal composition of Y0.56Al
y
B14
, and a modified Al flux method was used. In addition to the samples in [Citation22], a sample with y = 0.39 was also newly synthesized because in the previous study there was only one sample with a composition in the positive Seebeck coefficient range. The detailed synthesis conditions of the y = 0.39 sample is as follows. Starting materials of
, B and excess Al (which served as flux), were mixed with a composition of Y0.56
(
). This mixture was pressed using cold isostatic pressing and heated around 1853 K for 8 h in vacuum (10 Pa). After heating, the sample was crushed and washed in NaOH to dissolve excess Al. Then the sample powder was consolidated by using spark plasma sintering at 1823 K for 5 min at 80 MPa.
XRD measurements were performed using an Ultima III system (Rigaku) with a Cu-Kα radiation source. The Rietan-FP software package was used to characterize the samples [Citation26]. TE power was measured with a TE measurement system (ZEM-2, ULVAC) by the four-probe method and the differential method.
For the first-principles calculation, we used the projected augmented wave method [Citation27, Citation28] as implemented in the Vienna Ab initio Simulation Package [Citation29]. Exchange–correlation energy was calculated within the generalized gradient approximation. In the present study, we used the functional proposed by Perdew and Wang [Citation30]. Total energy was minimized over the degrees of freedom of both the electron density and the ionic positions by using the conjugate gradient iterative minimization technique. The cutoff energy for the plane wave expansion was taken to be 318.6 eV. Brillouin zone integration was performed using sets of k points in all cases, which was sufficiently large to obtain close convergence.
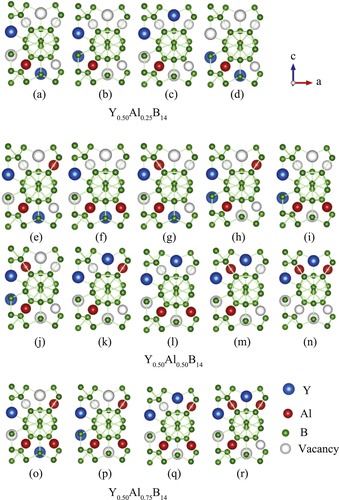
In order to examine the nonstoichiometric concentrations of Y and Al, we introduced model systems where the occupancies of Y and Al atoms were changed within one orthorhombic cell. Since YAlB14 compounds have four formula units per cell, we can consider compounds with y = 0.25, 0.50, and 0.75. In all the simulations, x was fixed at 0.50 since experimental studies have revealed that the Y site shows little variation. These compositions are sufficient to effectively analyze the dependence of the Seebeck coefficient on the concentrations of metal species. This is due to the experimentally observed change in Seebeck coefficient from positive to negative at around y = 0.5. In the present study, all possible configurations within an orthorhombic cell were calculated, and the electronic structures were analyzed for the energetically most stable ones (section 3). Figure shows all possible configurations for Y0.56Al y B14 with (a)–(d) y = 0.25, (e)–(n) y = 0.50, and (o)–(r) y = 0.75, respectively. Here, blue, red, and green spheres represent Y, Al, and B atoms, respectively. For y = 0.25 and y = 0.75, there are four different configurations, and for y = 0.50, there are ten different configurations. Again, the structures illustrated in the figures are viewed directly above the a–c plane. It should be noted that these models enable us to analyze the effects of local atomic configurations and displacements from the ideal lattice points.
Figure 2 Possible configurations of Y, Al, and B in a single orthorhombic unit cell of YAlB14 with four formula units for (a)–(d) Y0.50Al0.25, (e)–(n) Y0.50Al0.50B14, and (o)–(r) Y0.50Al0.75B14.
Results and discussion
First, we plot the experimentally obtained Seebeck coefficients of the Y
x
Al
y
B14 samples for different Al occupancies in [Citation22] and for y = 0.39 in figure . Striking variation in the Seebeck coefficient ranging between large positive and negative values can be clearly observed. In the previous report [Citation22], there was only one sample with p-type composition; here, however, variation was further confirmed for a larger range of compounds and the samples with lower y occupancy tended to show larger positive values of the Seebeck coefficient.
Figure 3 Experimentally obtained Seebeck coefficient values of
. New data for y = 0.39 is plotted together with data from [Citation22]. Lines are a visual guide.
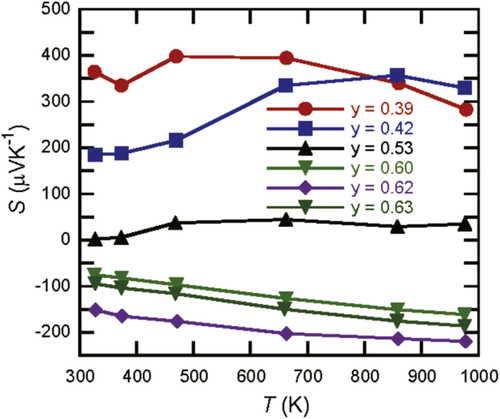
The temperature dependence of the y = 0.39 sample shows a difference with the higher aluminum concentration samples, with the Seebeck coefficient at relatively low temperatures exhibiting large values. At the limit of no aluminum, a related compound to Y x Al y B14 is known as an YB25-type compound with a composition of Y x B14 (x ∼ 0.55) [Citation31] whose crystal structure is similar to Y x Al y B14 [Citation32]. Recently sizable amounts of ‘YB25’ (Y x B14 (x ∼ 0.55)) were synthesized and their TE properties were measured. Similar to the more boron-rich and insulating compound YB66 [Citation33], the Seebeck coefficients show large values of ∼1000 μVK−1, around room temperature which decrease with temperature but still have values around 400 μVK−1 at 1000 K [Citation34]. The trend we observe for decreasing aluminum content y appears to approach this behavior. Incidentally, in terms of overall TE performance, both YB66 [Citation33, Citation35] and ‘YB25’ [Citation34] have small power factors despite the large Seebeck coefficient values because of the high electrical resistivity. This tendency is also observed for Y x Al y B14 with the TE power factor tending to be lower for the low aluminum concentration samples [Citation22].
As regards a compromise between the TE properties, for the higher borides, it appears that a good compromise for the power factor is reached when the electrical conductivity attains relatively high values. For example, the aluminoboride with the highest power factor of V−2 K−2
m−2, was achieved for the
sample with resistivity below
[Citation22]. Incidentally, the power factors of the aluminoborides are still affected by the samples being not fully densified and there is room for improvement. The borosilicides RB44Si2 also have significantly higher power factors [Citation36] than YB66 and ‘YB25’ in which the Seebeck coefficients are around
and electrical resistivity being below
at high temperatures which is again relatively low for higher borides. In regard to the thermal conductivity, the aluminoborides [Citation22, Citation34] are significantly higher than YB66 [Citation4, Citation5] and RB44Si22 [Citation6–Citation8] and the difficulty in finding an optimum TE higher boride system still remains. However, in these initial stages of research, the figure of merit ZT is around 0.1 for both the n-type aluminoboride and the p-type RB44Si2 compound, so these are two promising systems to investigate further.
Next, we theoretically analyzed the structural properties of the samples by comparing with experimentally obtained values. First, table shows the experimentally obtained structural parameters for six different concentrations of Y and Al. While table shows the optimized structural parameters and relative total energy, which is defined as the total energy difference from the energetically most stable configuration per formula unit for each x and y obtained by first-principles calculations. The structures in figure (b), (h), and (p) are the energetically most stable configurations for Y0.50Al0.25B14 , Al0.50B14 , and Y0.50Al0.75B14, respectively. For all of the most stable configurations, Y atoms occupy positions in the b–c plane, and the volume increases with increasing Al concentration.
Table 1 Experimentally obtained structural parameters of Y x Al y B14.
Table 2 Optimized structural parameters, and relative total energy per formula unit (fu). Here, the relative total energy is defined as the total energy difference from the energetically most stable configuration for x = 0.50 and each y. Indexing of the configuration is defined in figure .
For most configurations, there are noncubic distortions in the optimized structures, but generally these are negligibly small (with values lower than 0.7%). The variation in the values of the total energy difference from the most stable configurations corresponding to a given y is rather small in most cases. For example, for Y0.50Al0.25B14 and Y0.50Al0.75B14, the energy differences between the most stable and the second most stable configurations are 0.031, and 0.008 eV per formula unit, and for Y0.50Al0.50B14, the energy difference between the most stable and the second or third most stable configurations are 0.002 or 0.005, respectively. While others have much higher energy and are unlikely to form. Therefore, these compounds are expected to have a random distribution of Al and Y atoms around room temperature with almost the same lower energy configurations for each composition, which would lead to orthorhombic lattice parameters. Comparing the calculated lattice constants for Y0.50Al0.50B14 (configuration in figure (h)) with the experimental values in table , the differences are less than 1%, although there is a small deviation in x and y among the results. This indicates that the calculations were highly accurate.
Next, we analyzed the variation in the electronic structure of the compounds due to Al doping. Figures (a)–(c) show total density of states (TDOS) and site-projected partial density of states (PDOS) at B2 and B5 for Y0.50Al0.25B14 with the atomic configuration of figure (b). Figures (d)–(k) show TDOS and PDOS of Y, Al, B1, B2, B3, B4, and B5 for Y0.50Al0.50B14 with the atomic configuration of figure (h). Furthermore, figures (l)–(n) show TDOS and PDOS of B2 and B5 for Y0.50Al0.75B14 with the atomic configuration of figure (p). The Fermi level is indicated with a dashed vertical line originating from 0 eV on the abscissa.
Figure 4 (a)–(c) Total density of states (DOS) and site-projected partial density of states (PDOS) at B2 and B5 for Y0.50Al0.25B14 with the atomic configuration of figure (b). (d)–(k) Total DOS and PDOS of Y, Al, B1, B2, B3, B4, and B5 for Y0.50Al0.50B14 with the atomic configuration of figure (h). (l)–(n) Total DOS and PDOS of B2 and B5 for Y0.50Al0.75B14 with the atomic configuration of figure (p). The Fermi level corresponds to an energy of 0 eV.
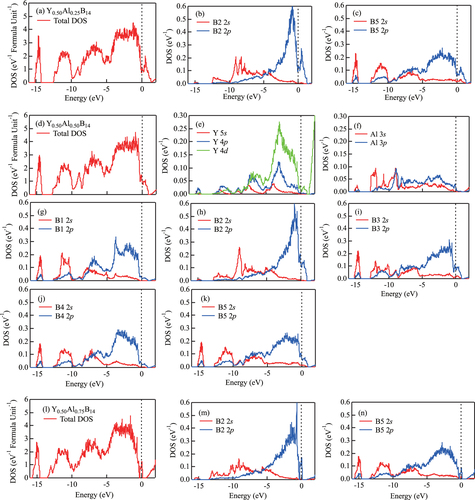
From figures (d)–(k), it is clear that the main contribution to the TDOS is due to 2s and 2p orbitals of B atoms that hybridize strongly at the nearest neighbor sites. The peak around -15 eV is mainly from 2s orbitals of boron, which has weak hybridization with Al 3s and 3p orbitals. Al atoms contribute only a small PDOS in the occupied region, and this implies charge transfer from Al atoms to the neighboring boron site, namely, B2. There are similar effects in the case of compounds with other concentrations of Al atom, and this behavior can be observed by comparing TDOS in figures (a), (d), and (l) corresponding to different concentrations of Al. Figures (b), (c), (h), (k), (m) and (n) show the change of the PDOS at B2 and their neighboring B5 at around Fermi level.
It is interesting to analyze the DOS behavior with respect to Al concentration. This is because the Seebeck coefficient is proportional to the first derivative of DOS, which concerns the energy around the Fermi level. That is,1 Here, S is the Seebeck coefficient, D(E) is the DOS,
is the Fermi level, and e is the elementary charge. Considering the DOS immediately under the Fermi level in figures (a)–(c), we can see a shift in
from negative through zero to positive values as the Al concentration increases. In the present study, the values,
, are estimated as –3.75, 0.30, and 1.01 eV−2 for Y0.50Al0.25B14, Y0.50
and Y 0.50Al0.75B14, respectively. This is likely because doping of Al changes the shape of DOS, which is dominated by the 2p electrons of B. The 2p electrons of B hybridize with neighboring Al orbitals, and this effect controls the transport properties of the compound. This behavior suggests that the Seebeck coefficient can be controlled by changing the concentration and distribution of atoms in the lattice of yttrium aluminoborides.
To analyze how neighboring Al–B2 pairs change with Al concentration, table shows the Al–B2 bond lengths and the corresponding number of bonds for Y0.50Al y B14. The indexing of the configuration in the table is defined in figure . Although the average bond length increases slightly with y, the number of bonds increases with y. Therefore, increasing Al concentration is expected to promote hybridization between Al and B2.
Table 3 Al–B2 bond lengths and the corresponding number of bonds, n, for Y0.50Al y B14. Indexing of the configuration is defined in figure .
The change in hybridization of the compounds can be clearly seen by analyzing the electronic charge density. In figure (a)–(c) we show the charge density distribution for the configurations (b), (h), and (p) in figure , respectively. These correspond to the isosurface of 0.78 electron . Solid lines indicate the nearest neighbor inter-cluster bonds. Here, blue, red, and green spheres represent Y, Al, and B atoms, respectively. It is noted that the Al atoms exist at the right upper site in figures (b) and (c). That is, they exist at the back side of the counter plot of the charge.
Figure 5 (a)–(c) Isosurface of 0.78 electron for the electronic charge density of Y0.50Al0.25B14, Y0.50Al0.50B14, and Y0.50Al0.75B14. Solid lines indicate the nearest neighbor inter-cluster bonds.
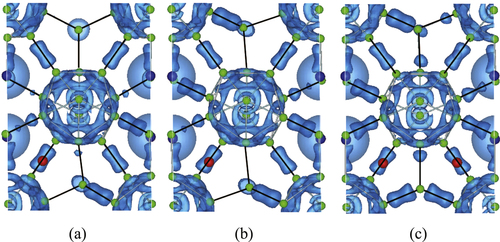
The overall total charge distributions for all cases are similar. That is, there is a high density of charge networks on B12 icosahedra and bridging B2 atoms. A strong covalent bonding can also be seen between B4 atoms that link neighboring icosahedra. B2 type bridging atoms form covalent bonds with neighboring B3 and B5 atoms. This is similar to the behavior of other systems such as AlMB14 systems with M = Li, Mg, and Na [Citation37]. The strength of hybridization increases together with Al concentration. For example, this is clear when we consider inter-cluster bonds between B2 and B5 (see also figure ). Furthermore, a small amount of charge also can be seen at around B3. This is because those boron sites are positioned near from Al sites compared with B1 and B4. That is, additional charge appears when Al concentration increases, which can be expected from the partial DOS shown in figure , and this effect contributes to the formation of the particular electronic properties.
Thus, the present simulation confirms the conclusion that the p–n characteristics of yttrium aluminoborides can be controlled by changing the Al concentration.
We note that particularly in the case of Al, there have been interesting TE effects for other completely different systems, such as Al-doping increasing the Seebeck coefficient for PbSe [Citation38] and PbTe [Citation39]. In the case studied here, we have demonstrated that the striking TE effect of Al was achieved by the unusual possibility in such metal borides to control the occupancy of the metal site, Al. If synthesis methods could be tried for other metal borides to enable such composition control for other metal species, it may lead to further excellent control of the TE properties.
It can be also noted that the contribution of the Al atoms to the DOS in the vicinity of the Fermi level is very small (figure ). Coupled with the fact that the electronic density around the Al atoms (figure ) does not appear to vary when the Al content increases, it is indicated that the Al atoms are weakly bonded. It can be imagined that this may be a similar situation to the rattlers in clathrates or skutterudites which contribute in significantly lowering the thermal conductivity [Citation40, Citation41]. However, the thermal conductivity of borides appears to be quite complex, with different mechanisms like crystal complexity, disorder, and possible symmetry related effects contributing to the relative low thermal conductivity [Citation7, Citation8], and actually the lattice thermal conductivity of aluminoborides is relatively high [Citation34] compared to RB44Si2 [Citation6–Citation8] for example. In any case, the bonding of these interesting compounds should be investigated in detail in future works.
Summary
Excellent control of p–n characteristics was recently reported for yttrium aluminoborides Y x Al y B14, which was found to be the result of the surprisingly free variation in the occupancy of Al sites. In the present work, this behavior was elucidated through theoretical investigations, namely first-principles calculations based on detailed XRD data. Additional samples were also experimentally prepared to illustrate the tendencies in p-type and n-type behavior observed when varying Al concentration.
The simulations revealed stable configuration of the atomic sites, indicating that such control of the occupancy of the metal sites was possible. A shift from positive through zero to negative values of the Seebeck coefficient was clearly demonstrated by determining the density of states for different concentrations of metal species.
Acknowledgments
We are grateful to the staff at the Center for Computational Materials Science of Institute for Materials Research, Tohoku University, for allowing us to use of the Hitachi SR–160 00 supercomputing facility, and for their kind support. TM was partially supported by a grant from AOARD.
References
- KoumotoKMoriT 2013 Thermoelectric Nanomaterials, Materials Design and Application Heidelberg Springer
- RoweD M 2012 Modules, Systems, and Applications in Thermoelectrics London CRC Press
- MoriT 2008 Higher borides Handbook on the Physics and Chemistry of Rare-Earths vol 38 GschneidnerK A Jr BunzliJ-CPecharskyV Amsterdam North-Holland 105
- SlackG AOliverD WHornF H 1971 Phys. Rev. B 4 1714 10.1103/PhysRevB.4.592
- CahillD GFischerH EWatsonS KPohlR OSlackG A 1989 Phys. Rev. B 40 3254 10.1103/PhysRevA.40.3254
- MoriT 2006 Physica B 383 120 10.1016/j.physb.2006.03.072
- MoriTMartinJNolasG 2007 J. Appl. Phys. 102 073510 10.1063/1.2785017
- MoriT 2012 Modules, Systems, and Applications in Thermoelectrics RoweD M London CRC Press/Taylor and Francis 14
- WoodCEminD 1984 Phys. Rev. B 29 4582 10.1103/PhysRevB.29.4582
- AselageT LEminDMcCreadyS SDuncanR V 1998 Phys. Rev. Lett. 81 2316 10.1103/PhysRevLett.81.2316
- SlackG ARosolowskiJ HHejnaCGarbauskasMKasperJ S 1987 Borides and Related Compounds, Duisberg, Germany, Proc. IX Int. Symp. Boron 132 9 132–9
- SlackG AHejnaC IGarbauskasMKasperJ S 1988 J. Solid State Chem. 76 52 10.1016/0022-4596(88)90192-2
- WerheitHSchmechelRKueffelVLundstromT 1997 J. Alloys Compd 262–263 372 10.1016/S0925-8388(97)00414-3
- TakizawaHHazeNOkamotoKUhedaKEndoT 2002 Mater. Res. Bull. 37 113 10.1016/S0025-5408(01)00803-0
- KimHNakayamaTShimizuJKimuraK 2008 Mater. Trans. 49 593 10.2320/matertrans.E-MRA2007890
- MoriTNishimuraT 2006 J. Solid State Chem. 179 2908 10.1016/j.jssc.2006.03.030
- MoriTNishimuraTYamauraKTakayama-MuromachiE 2007 J. Appl. Phys. 101 093714 10.1063/1.2730571
- BerthebaudDNishimuraTMoriT 2010 J. Mater. Res. 25 665 10.1557/JMR.2010.0100
- PrytuliakAMaruyamaSMoriT 2013 Mater. Res. Bull. 48 1972 10.1016/j.materresbull.2013.01.043
- MoriTBerthebaudDNishimuraTNomuraAShishidoTNakajimaK 2010 Dalton Trans. 39 1027 10.1039/b916028k
- SologubOMatsushitaYMoriT 2013 Scr. Mater. 68 288 10.1016/j.scriptamat.2012.10.044
- MaruyamaSMiyazakiYHayashiKKajitaniTMoriT 2012 Appl. Phys. Lett. 101 152101 10.1063/1.4748792
- MoriTBorrmannHOkadaSKudouKLeithe-JasperABurkhardtUGrinYu 2007 Phys. Rev. B 76 064404 10.1103/PhysRevB.76.165405
- KorsukovaM MGurinV NKuzmaYu BChabanN FChykhriiS IMoshchalkovV VBrandtN BGippiusA ANyanK K 1989 Phys. Status Solidi A 114 265 10.1002/pssa.2211140126
- KorsukovaM MLundstromTTergeniusL-EGurinV N 1992 J. Alloy Comp. 187 39 10.1016/0925-8388(92)90518-E
- IzumiFMommaK 2007 Solid State Phenom. 130 15 10.4028/www.scientific.net/SSP.130
- BlöchlP E 1994 Phys. Rev. B 50 17953
- KresseGJoubertD 1999 Phys. Rev. B 59 1758 10.1103/PhysRevB.59.1758
- KresseGFurthmüllerJ 1996 Phys. Rev. B 54 11169 10.1103/PhysRevB.54.11169
- PerdewJ PWangY 1992 Phys. Rev. B 45 13244 10.1103/PhysRevB.45.13244
- TanakaTOkadaSYuYIshizawaY 1997 J. Solid State Chem. 133 122 10.1006/jssc.1997.7328
- MoriTZhangF XTanakaT 2002 J. Phys. Condens. Matter. 13 L423 10.1088/0953-8984/13/20/105
- GolikovaO A 1987 Phys. Status Solidi A 101 27 10.1002/pssa.2211010202
- MaruyamaSPrytuliakAMiyazakiYHayashiKKajitaniTMoriT 2014 J. Appl. Phys. 115 123702 10.1063/1.4869131
- MoriTTanakaT 2006 J. Solid State Chem. 179 2889 10.1016/j.jssc.2006.01.064
- MoriT 2005 J. Appl. Phys. 97 093703 10.1063/1.1850365
- SaharaRShishidoTNomuraAKudouKOkadaSKumarVNakajimaKKawazoeY 2009 J. Phys.: Conf. Ser. 176 012018 10.1088/1742-6596/176/1/012018
- ChidemboAAboutalebiS HKonstantinovKSalariMWintonBYaminiS ANevirkovetsI PLiuH K 2012 Energy Environ. Sci. 5 5236 10.1039/c1ee02784k
- ZhangQYangSZhangQChenSLiuWWangHTianZBroidoDChenGRenZ 2013 Nanotechnology 24 345705 10.1088/0957-4484/24/32/325702
- UherC 2000 Semiconductors and Semimetals 69 TrittT M New York Academic 139
- NolasG SMorelliD TTrittT M 1999 Annu. Rev. Mater. Sci. 29 89 10.1146/annurev.matsci.29.1.89