
Abstract
High-speed melt spinning of a cyclo-olefin polymer (COP) and a copolyamide (CoPA) have been performed. Differential scanning calorimetry curves of the resulting monofilaments show that they remain in an amorphous state even after hot drawing. Wide angle x-ray diffraction patterns of undrawn and drawn COP filaments show that although the material remains in an amorphous state, a degree of orientation is induced in the polymer after drawing. The amorphous filaments show an enhanced bending recovery with respect to different semi-crystalline monofilaments commercially available. However, single fiber axial compressive testing indicates that the amorphous filaments exhibit a compressive modulus value which is 50% lower than what is observed for a reference semi-crystalline PET filament. Analysis of the compressive strains applied by the bending recovery test indicates that while the maximum applied strains remain well within the region of elastic deformation of the amorphous materials, the threshold between elastic and plastic deformation is reached for the semi-crystalline materials.
1. Introduction
Most synthetic fibers commercially available are spun from polymers that develop a semi-crystalline structure upon fiber drawing. A structure with a substantial degree of crystallinity is in fact preferred, as filaments with an essentially amorphous structure typically show limited mechanical performance. The positive effect of crystallinity on tensile properties can be observed for instance in the ultra-high molecular weight polyethylene (UHMWPE) fiber, which is reported to achieve a degree of crystallinity of 85% [Citation1], a tensile strength in the order of 3.5 GPa and a modulus of 118 GPa [Citation2]. Although the optimization of fiber tensile properties is in general favored, there are situations in which a balance of different types of fiber properties is preferred over the maximization of one particular property. One such case is the bending recovery of a filament. Filament resiliency, a relevant mechanical property of fibrous materials [Citation3–Citation5], is a material characteristic that depends on both the axial tensile and compressive behavior of the synthetic filament, where the anisotropy of tensile and compressive characteristics typically observed in these materials [Citation6, Citation7] needs to be taken into account in order to be able to analyze the observed bending recovery mechanisms. In a recent publication, Kolgjini et al have shown that the bending recovery of linear low density polyethylene (LLDPE) monofilaments is directly proportional to the amount of amorphous phase present in the filaments as measured by Raman spectroscopy [Citation8], demonstrating a potential way to tune the bending recovery characteristics of melt-spun filaments.
Although fully amorphous thermoplastic polymers commercially available are typically processed by injection molding, the melt spinning of amorphous filaments is an area that has attracted both scientific and commercial interest in the last 20 years. Some of the initial literature reports on melt spinning of amorphous materials refer to the high performance polyetherimide (PEI) polymer. Having a predominantly aromatic structure, PEI is reported by Song et al to remain completely amorphous even after substantial drawing, resulting in filaments with a tensile strength of 800 MPa, strain to break of 40% and Young’s modulus of 5.5 GPa [Citation9]. In contrast, attempts to melt-spin the highly aromatic poly (arylene ether sulfone) using a capillary rheometer and take-up roller resulted in filaments which remained amorphous under all processing conditions while reaching a tensile strength of 350 MPA and Young’s modulus of 3.5 GPa. A fact of particular interest is that the PAES filaments showed a ductile behavior even under low drawing ratios, as opposed to what is observed with materials such as atactic polystyrene (PS) or poly-(methyl methacrylate) (PMMA) [Citation10]. Regarding cyclo-olefin polymers (COP), Hong and White used a capillary rheometer to melt-spin a series of six different COPs. The filaments were shown to remain fully amorphous and exhibited a tensile strength of up to 250 MPa with a strain to break of 65% [Citation11]. The effect of processing conditions on the properties of PMMA filaments has been analyzed for instance by Wright et al. In their analysis, Wright et al quantified the heat relaxation ratio (HRR) of PMMA filaments melt-spun by ram extrusion under different processing conditions. With the HRR, it is possible to obtain a measure of the relative amount of retained molecular orientation in a filament by calculating the ratio of the length of a fiber measured before and after heating above Tg. The experimental data showed that the PMMA filaments reached a tensile strength of up to 225 MPa, which corresponded to a strain to break of 40% and a Young’s modulus of 3.5 GPa. The tensile strength was directly proportional to HRR [Citation12].
It is interesting to note that most studies on melt spinning of amorphous polymers summarized above have relied on low-speed melt spinning and/or melt spinning without a multi-godet drawing system. For this reason, one of the purposes of the present work has been to produce filaments from amorphous polymers by high-speed melt spinning and drawing. In addition, previous studies have focused on the optical or thermal characteristics of the melt-spun filaments without performing a thorough analysis of their mechanical behavior. Therefore, in this paper the mechanical response of the melt-spun amorphous filaments in tension, compression and bending has been analyzed. An experimental methodology previously developed for the analysis of elastic recovery of filaments for artificial turf applications [Citation4] has been used to quantify the bending recovery of the melt-spun amorphous filaments. Axial compressive testing of single monofilaments has been performed by means of an adaptation of a specimen preparation technique previously reported [Citation7] and the use of a micro-indenter with a flat punch indenter. The ultimate goal of this work is to identify the role that the amorphous structure of the melt-spun filaments plays in their mechanical performance, with emphasis on bending recovery.
Experimental
Materials
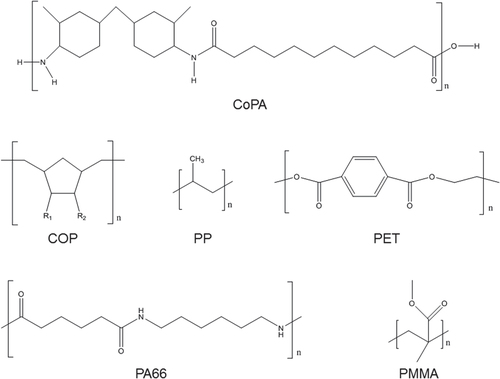
The chemical structures of all polymers used in this work are shown in figure . According to Kim et al [Citation13] and Tulsyan [Citation14], the co-polyamide (CoPA) Grilamid® TR 90 from EMS-CHEMIE AG is a copolymer of dodecanedioic acid and 4,4′-methylenebis(2-methylcyclohexanamine). The chemical structure of the cyclo-olefin polymer (COP) Zeonor® 1020 R from Zeon Chemicals L.P. has been reported by Yamazaki [Citation15], who indicates that the radicals R1 and R2 observed in figure are typically connected by means of a ring structure. COP and CoPA have been processed by high-speed melt spinning and drawing to produce monofilaments with linear mass densities of 6.5 and 3.85 tex (mg m−1), respectively. Undrawn COP monofilaments (31.8 tex) were also melt-spun. The 4.5 tex polypropylene (PP), 6.9 tex polyethylene terephthalate (PET), and 5.7 tex polyamide 66 (PA66) monofilaments have been supplied by Monosuisse AG. A 90 tex poly-(methyl methacrylate) (PMMA) monofilament typically used for illumination applications has also been analyzed as a reference amorphous material. All filaments supplied by Monosuisse have a diameter of 80 μm. The CoPA filaments have a diameter of 70 μm, the COP filaments have a diameter of 90 μm and the PMMA filaments have a diameter of 340 μm.
Figure 1. Chemical structure of polymer fibers used in this work [Citation13–Citation15, Citation17].
Melt spinning
The melt spinning of COP and CoPA filaments has been performed at Empa’s pilot plant (Fourné Polymertechnik GmbH). Details of the pilot melt spinning plant have been previously published [Citation16]. A single screw extruder with screw diameter of 18 mm and three heating zones was used to process both polymers. The melt spinning parameters and resulting filament tensile characteristics are displayed in table .
Table 1. Melt spinning parameters and resulting filament tensile characteristics.
Differential scanning calorimetry (DSC)
DSC has been performed with an 822e DSC cell from Mettler-Toledo. The fiber specimens were chopped into small pieces and 4–5 mg of material were placed in aluminum pans. The scans were performed at a temperature range of 0 to 300 °C in a nitrogen atmosphere with a heating rate of 10 °C min−1.
Wide angle x-ray diffraction (WAXD)
For WAXD analyses, fiber bundles of approx. 50–60 tex (mg m−1) were mounted on a custom-made sample holder. For the drawn COP and CoPA fibers, the fiber bundles consisted of 8 and 16 single filaments, respectively. To analyze the undrawn (free fall) COP fiber, two single filaments (31.8 tex each) were combined. WAXD patterns were recorded on an Xcalibur PX four-circle single-crystal diffractometer (Oxford Diffraction, Yarnton, Oxfordshire, UK; κ geometry; Mo K α1 radiation, λ = 0.709 26 Å, CCD area detection system) and evaluated by means of the CrysAlis Pro Data collection and processing software [Citation18] and the XRD2DScan displaying and analyzing software [Citation19]. For peak fitting purposes, the peak separation and analysis software package PeakFit (Version 4.12, Systat Software GmbH, Erkrath, Germany) was used. Peak fitting was performed using the Pearson type VII distribution function.
Bending recovery
A fixture for testing the bending recovery of single filaments has been constructed. The fixture can be mounted on any universal testing machine (figure ). A single filament is fixed horizontally on the upper surface of the holder, and a plunger applies a bending deformation on the filament as both components are brought together. The holder and plunger keep moving in opposite directions until the filament is released by the plunger and allowed to freely return to its original, unbent position. A high speed digital camera is used to acquire a video of the test. Using frames extracted from the acquired video, the angle between holder and tested filament is measured at different times and the filament’s bending recovery is quantified as follows:(1)
Figure 2. Setup for the bending recovery test.
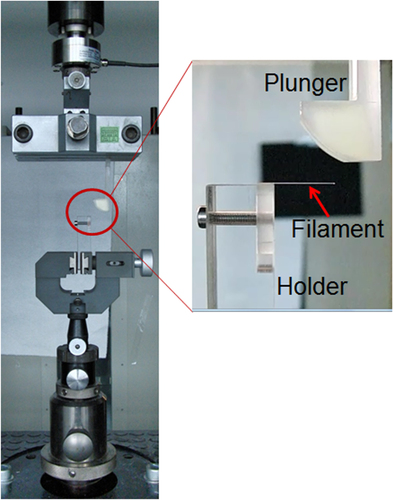
The lateral distance between holder and plunger determines the strain applied on the filament during bending. A lateral distance of 2 mm has been used for testing of all filaments except PMMA. Due to the large diameter of the PMMA filaments, a lateral distance of 7.5 mm was used to test these filaments in order to maintain a level of strain comparable to what the filaments with smaller diameter were subjected to.
Tensile properties
Tensile testing of filaments has been performed using an Uster® Tensorapid 3 tester. Twenty specimens were tested for each material with a cross head speed of 250 mm min−1 and a gauge length of 250 mm. The determination of fiber tensile modulus has been performed following ASTM D2256 [Citation20].
Single fiber micro-compression
The axial compressive modulus of single filaments has been determined using a micro-indenter produced by Alemnis GmbH. This is a modified version of the in situ indenter first developed by Rabe et al [Citation21]. Micro-pillar compression testing is fast emerging as an alternate viable technique, compared to nanoindentation, to measure the mechanical properties and deformation behavior of small volumes and thin films [Citation22]. This technique has been applied to a host of materials, varying from metals, to ceramics and polymers.
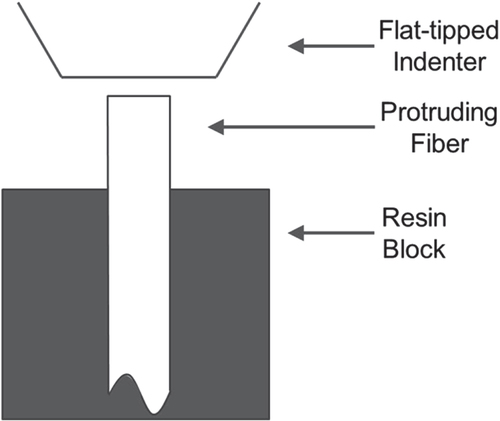
In the present work a flat punch indenter with a diameter of 200 μm is used to apply a uniform axial compressive load on the fiber specimens which have a diameter of 70–90 μm (figure ). In order to perform a micro-compression test, the flat tipped indenter is carefully positioned over a single fiber specimen with the aid of a Keyence VH-Z100R optical microscope. The system compliance was determined from indents on fused silica of known modulus value.
Figure 3. Experimental setup for the single fiber micro-compression test.
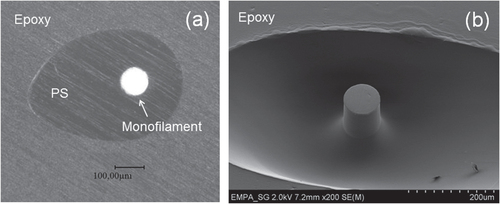
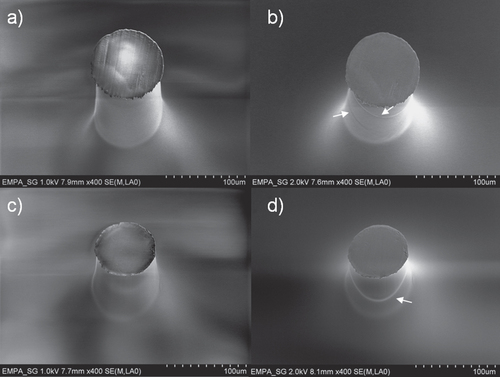
The preparation of fiber specimens suitable for axial compression has been based on a specimen preparation technique previously developed by Leal et al [Citation7]. A series of monofilaments is mounted on a specimen preparation cup. A layer of polystyrene (PS) dissolved in methyl ethyl ketone (MEK) is poured into the preparation cup. Wicking of the solution leads to the formation of a meniscus around each monofilament, which solidifies once the MEK evaporates. A thicker layer of epoxy resin is then poured on top of the PS layer and allowed to cure in order to facilitate handling of the specimen. The PS layer is then polished off until only the meniscus remains (figure (a)). The polished specimen is then placed in a MEK bath for a few seconds, which generates fiber specimens with a free length as the PS is dissolved. The electron micrograph in figure (b) illustrates the resulting specimen, which is suitable for a single fiber axial micro-compression test.
Figure 4. Optical and electron micrographs of COP fiber specimens suitable for axial micro-compression testing before (a) and after (b) dissolution of surrounding PS material.
To perform an axial micro-compression test, once the flat tip indenter has been positioned over a single fiber specimen, the compressive load is applied at a constant rate of extension until a predefined maximum displacement value has been reached, followed by the retraction of the micro-indenter until it reaches its original position.
The chemical resistance to MEK of the different filaments of interest has been tested by comparing the tensile strength and strain to failure of as-received filaments and filaments that have been immersed in MEK for five minutes. A student’s t-test of hypothesis with a significance level of α = 0.05 was performed to determine whether the average strength and strain-to-failure values after MEK treatment remain statistically equal to the values shown by the as-received filaments. Aside from PMMA, which readily dissolves in MEK, all other filaments under consideration (PET, PA66, COP and CoPA) remain unaffected by the MEK treatment and are suitable for single fiber micro-compression testing.
Results and discussion
Structure of melt-spun filaments
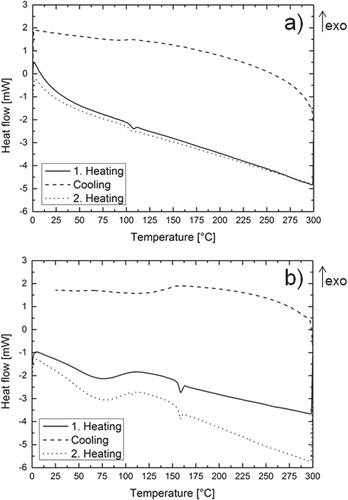
DSC curves of the melt-spun filaments have been acquired in order to test whether the polymers have remained in an amorphous state after melt spinning and drawing. The DSC curve of the COP (figure (a)) indicates the absence of a crystallization/melting peak, confirming that the material has remained in an amorphous state after processing. The glass transition temperature can be observed at about 102 °C. Yamazaki reports that COPs remain as an amorphous material due to the presence of a bulky ring structure in their main chain [Citation15]. According to Obuchi et al [Citation23], COPs are produced by means of a ring opening metathesis polymerization of norbornene derivatives, where the physical properties of a particular COP are a function of the chemical design of the substituents attached to the non-aromatic cyclic compound.
Figure 5. DSC curves of drawn COP (a) and CoPA (b) filaments.
A comparison of the WAXD patterns of COP undrawn (free fall) and drawn filaments (figure (a)) shows that both filaments maintain a diffuse halo which is characteristic of amorphous materials [Citation24]. The maximum position of the halo can be interpreted as representing the preferential interchain distance between chain segments in the amorphous material [Citation25, Citation26]. This distance can be calculated via the Bragg equation [Citation27]2 with n = 1, and where d is the preferential interchain distance, λ is the x-ray wavelength and θ is half the scattering angle (2θ) of the maximum position of the halo.
Figure 6. WAXD patterns and 2θ scans after peak-fitting for undrawn and drawn COP filament (a) and drawn CoPA filament (b). The scans were performed with an angular aperture of 10° in meridional and equatorial direction.
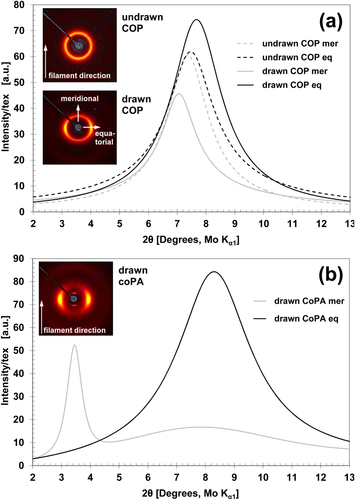
In the halo of the drawn COP filament, the presence of an arc in the equatorial direction provides a clear indication that a degree of orientation is induced in the polymer during drawing [Citation28]. Drawing-induced orientation in an amorphous filament has also been reported for PEI by Song et al, who observed that birefringence increased linearly with the degree of drawing [Citation9]. For the equatorial scattering, which can be attributed to the chain segments oriented parallel to the fiber direction [Citation28], a preferential interchain distance of 5.3 Å can be calculated from the maximum of the fitted peak at 7.7° 2θ. The meridional scattering (calculated interchain distance 5.8 Å) is due to the chain segments oriented perpendicular to the fiber direction [Citation28]. Hence, in the drawn filament, the preferred interchain distance between the polymeric chains which are in the filament (meridional) direction is 0.5 Å smaller than the preferred interchain distance between the polymeric chains oriented in equatorial direction. Differences in this range (some tenths of Å) between the preferential interchain distances of the chain segments oriented parallel and those oriented perpendicular to the drawing (fiber) direction have been observed also for other oriented polymer films and fibers [Citation28, Citation29]. Due to the differences in the interchain distances, the halo of the drawn COP filament has an oval shape. In contrast, the halo observed for the undrawn free fall filament is circular, with a calculated preferential interchain distance of 5.5 Å in meridional and equatorial direction, and shows no indication of an orientation. The preferential interchain distances calculated for the drawn COP fiber are comparable to the maximum of the x-ray diffractogram of a series of cyclo-olefin copolymers comprised of ethylene and norbornene units, indicating a repeat distance of 5.2 Å [Citation30].
In the case of the CoPA filaments, the DSC curves (figure (b)) also indicate the absence of a crystallization/melting peak. In this case, the material remains amorphous as a result of alternating aliphatic and cycloaliphatic blocks in the polymer’s backbone [Citation31], as shown in figure . The as-received CoPA pellets used for fiber spinning have shown a glass transition temperature of 155 °C. In the case of the filaments, an enthalpy relaxation peak appears exactly at this temperature, indicating that the melt-spun filaments have undergone an ageing process after drawing [Citation32]. Analogously, figure (a) shows that an enthalpy relaxation peak can also be observed for the COP filaments. In the WAXD pattern of the drawn CoPA filament (figure (b)), the distinct arc in equatorial direction and the surprisingly sharp reflection in the meridional direction indicate a high degree of orientation induced during drawing. Particularly in the filament direction, a highly regular periodicity is suggested. The general aspect of the WAXD pattern is similar to WAXD patterns of the γ-form of some semi-crystalline polyamides, e.g. PA 6 [Citation33] or PA 12 [Citation34, Citation35], where the crystals are composed of pleated sheets of parallel or antiparallel chains joined by hydrogen bonds between the adjacent chains [Citation36, Citation37].
Bending recovery
Figure shows the bending recovery behavior for different amorphous and semi-crystalline polymer filaments including the in-house melt-spun COP and CoPA fibers. The bending recovery behavior is also summarized in table . It can be observed that the three amorphous filaments (COP, PMMA and CoPA) have a better performance than the three semi-crystalline filaments (PA66, PP and PET). In particular, the COP filament has a superior performance with respect to all other filaments. With an initial recovery of more than 97% at 0.01 s, a bending recovery of more than 99% is reached by COP in only 4.5 s after the filament has been released from the bending deformation imposed by the plunger. In contrast, the PMMA filament reaches a recovery of 99% after 8.5 s, whereas CoPA shows a recovery of more than 98% after 11 s. Within the semi-crystalline filaments, PA66 shows the best performance, with a recovery of almost 98% after 14 s. This result is not surprising, as PA fibers in general are known for their excellent resilience [Citation4]. In the case of the PP and PET filaments, recoveries of 97% after 22 s and 95% after 5.5 s are achieved, whereas the initial recovery of PP at time = 0.01 s is less than 80%. The reproducibility of these values has been confirmed by testing multiple specimens for each polymer.
Figure 7. Bending recovery behavior for different melt-spun filaments. Each data point represents the average of three measurements.
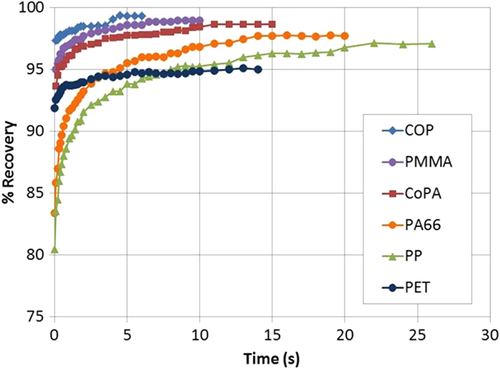
Table 2. Results of bending recovery test for various filaments.
The improved performance in bending recovery of the amorphous filaments with respect to their semi-crystalline counterparts shown in figure is in agreement with the observations of Kolgjini et al [Citation8], who have found that the bending recovery of single LLDPE filaments is directly proportional to the amount of amorphous phase present in the fiber. Although Kolgjini et al conclude that, in the case of LLDPE, the limit for complete bending recovery is 64% of amorphous phase in the filament, parameters such as distribution of crystalline and amorphous regions and structure of the crystalline domains will also have an effect on filament bending recovery; parameters that no longer come into play in the case of the purely amorphous filaments under discussion.
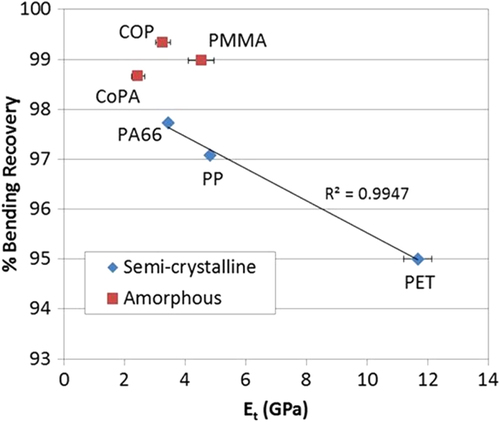
In terms of its mechanical response, the bending behavior of a polymer will be dictated by the corresponding material properties in tension and compression. In this sense, Lamb et al [Citation6, Citation38] have concluded that a filament with low elastic modulus generally achieves better bending recoveries than a fiber with higher stiffness. Figure shows the experimentally measured final bending recoveries for both semi-crystalline and amorphous filaments plotted against fiber tensile modulus. A linear correlation between bending recovery and modulus can be observed for the semi-crystalline fibers, in agreement with the observations of Lamb et al. In contrast, the amorphous filaments seem to fall outside the linear trend. The amorphous materials have a lack of domains with a long-range ordered structure. This characteristic limits the possibility of spinning stiff amorphous filaments. In this sense, amorphous filaments should generally be expected to achieve good bending recoveries. The fact that filaments with similar tensile modulus values such as COP and PA66 achieve significantly different bending recovery values indicates that tensile modulus is not the only material property affecting the filament’s resiliency.
Figure 8. Correlation between final bending recovery and axial tensile modulus for different melt-spun filaments.
Compressive properties
Polymer filaments are anisotropic materials which typically show reduced performance under compression with respect to their tensile behavior [Citation7]. As a result, the bending behavior of a filament will be to a large extent a function of its compressive response. For this reason, it has been intended to establish an experimental technique to quantify the compressive response of the melt-spun amorphous filaments under discussion in the present study and contrast their performance with that of traditional semi-crystalline melt-spun filaments.
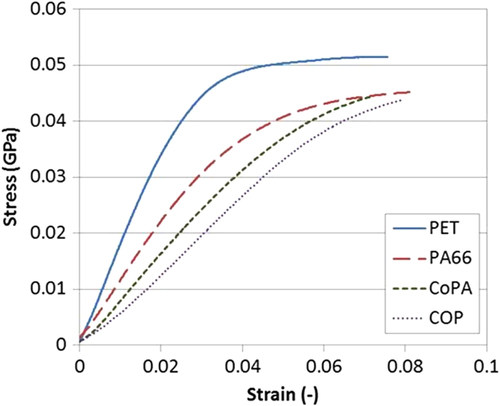
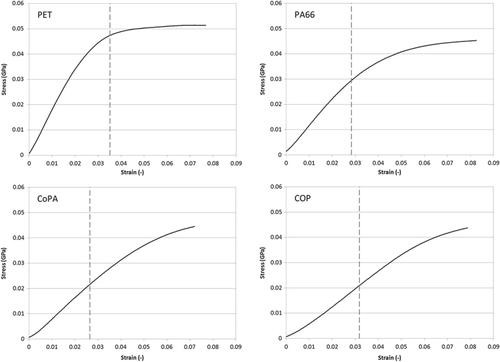
Typical stress–strain curves in axial compression for the different monofilaments of interest are shown in figure . The specimen preparation technique yielded freestanding single filaments with aspect ratios (length/radius) between 1.5 and 6.5. The specimens do not follow Euler’s buckling behavior and therefore the axial compressive moduli were determined directly from the stress–strain curves. The specimens were tested at a rate of 0.5 μm s−1. From figure it can be seen that maximum compressive strains in the order of 0.07–0.08 were applied to the filaments. For these strain levels, a clear transition into plastic deformation can be observed from the PET and PA66 curves, while COP and CoPA appear to stand at the limit between elastic and plastic deformation. The influence of this behavior on the bending recovery of the different filaments will be discussed in the following section.
Figure 9. Stress–strain curves in axial compression for different melt-spun monofilaments.
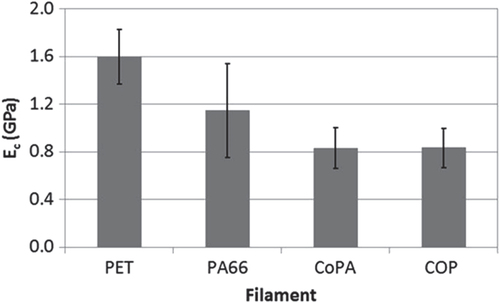
The measured axial compressive modulus values for PET, PA66, CoPA and COP filaments are displayed in figure . The standard deviation observed for the PA66 specimens is relatively large (coefficient of variation of 34%). Although a student’s t-test of hypothesis with a significance level of α = 0.1 indicates that the mean modulus value of PA66 is statistically different than that of PET, CoPA and COP, the error bar shown for PA66 in figure (± one standard deviation) does overlap substantially with the error bars observed for PET, CoPA and COP. Figure shows that the compressive modulus value of PET is almost 30% higher than the value observed for PA66, and about 50% higher than in the case of the amorphous CoPA and COP polymers. PET filaments are known to have a higher stiffness in comparison to other polymer textile fibers [Citation39, Citation40]. This is mainly due to its tendency to develop a conformation with stretched polymer chains together with the presence of aromatic rings in the polymer’s backbone [Citation40, Citation41], as shown in figure . One of the main parameters affecting the compressive properties of polymer fibers is their ability to form lateral intermolecular interactions [Citation7], which in most cases consist of secondary type of bonding. In the case of PET, the aromatic rings tend to stack regularly in the crystalline domains, giving place to secondary bonding by aromatic ring association [Citation40]. In contrast, the flexible aliphatic polymer chain structure of PA66 results in reduced stiffness values with respect to PET. Nevertheless, the fact that PA66 is able to establish intermolecular hydrogen bonds (the strongest type of secondary bonding) between amide groups of adjacent polymer chains [Citation42, Citation43] allows the filament to achieve a compressive modulus value that is 30% smaller than PET, while the tensile modulus of the PA66 filament is 70% lower than PET. Inversely, the amorphous COP and CoPA polymers are inherently designed to hinder the development of the molecular order needed, among other things, to achieve high modulus values. The CoPA under analysis is reported by EMS-CHEMIE AG to be composed of aliphatic and cycloaliphatic blocks (figure ). Vanhaecht et al have reported that the incorporation of cycloaliphatic moieties into a polyamide can lead to increases in inter-sheet distances that hinder the formation of intermolecular hydrogen bonds [Citation44]. Additionally, Glomm et al have shown that in the case of polyamide fibers, the presence of substituents attached to the polymer backbone tend to affect the interactions between polymer chains, which has a direct impact on mechanical characteristics such as compressive strength and torsional modulus [Citation45]. As already discussed, the WAXD data of CoPA indicate the presence of a high degree of orientation and periodicity in the filament direction. However, this regularity and order are apparently not able to compensate for the lack of intermolecular hydrogen bonds needed to achieve higher compressive modulus values. Finally, the COP filaments show a compressive modulus value which is identical to that observed for CoPA. Although it is not expected to see intermolecular hydrogen bonding in this polymer, the presence of substituents attached to the polymer backbone reported by Yamazaki [Citation15] will also inhibit the development of other types of secondary bonding which leads, as in the case of CoPA, to a reduced compressive modulus value.
Figure 10. Axial compressive modulus for different melt-spun filaments. E c values are the average of 8 to 12 measurements. Error bars represent the standard deviation.
With respect to the failure mode of the single filaments subjected to axial compressive loading, all four polymers under analysis (regardless of whether they are amorphous or semi-crystalline) fail due to the formation of bands of shear deformation, as seen for the PET and CoPA filaments in figure , where both filaments were subjected to a maximum compressive strain of 10%. When the maximum applied strain is further increased, the kink bands propagate giving way to fiber buckling at the points where the bands of shear deformation were initially developed. Figure also shows that, even at the maximum applied compressive strain value, the fiber-resin interface does not present any damage, indicating that a pillar sink-in correction is not necessary.
Figure 11. PET filament before (a) and after (b) axial compressive testing, and CoPA filament before (c) and after (d) axial compressive testing.
Relationship between compressive properties and bending recovery
It can be concluded from the axial compressive modulus values reported in the previous section that the filaments under analysis display a significant degree of anisotropy in their tensile and compressive behavior, which results in ratios of compressive to tensile modulus (E c/E t) in the order of 0.14 to 0.34. As a reference, E c/E t values of about 0.3 have been previously reported by Leal et al for the high performance fiber PBO, a material that is unable to establish strong lateral interactions between polymer chains. In contrast, aramid filaments achieve E c/E t values around 0.6 as a result of their ability to develop a one-dimensional network of intermolecular hydrogen bonds between carbonyl and secondary amine groups of adjacent polymer chains [Citation7].
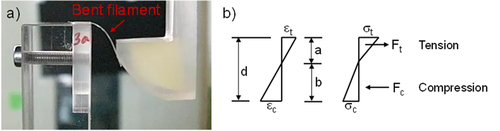
In light of the strong difference in tensile and compressive response of the polymer filaments, it can be assumed that when a filament is subjected to flexural loading, it is the axial compressive response which will dictate the degree of recovery after bending. Based on this, a quantification of the axial compressive strain applied with the bending recovery test can be very useful in understanding the recovery behavior of the different filaments after bending. Based on the analysis of the flexural response of a fiber with different modulus in tension and compression previously reported [Citation18], knowing E c and E t it is now possible to determine the applied compressive strains during bending based on the strain and stress distribution for a fiber of circular cross-section and diameter 2r illustrated in figure .
Figure 12. Bent filament during bending recovery testing (a), and strain (ε) and stress (σ) distribution for a fiber of circular cross-section and diameter d, with different modulus in tension and compression (b) [Citation18].
Knowing that the tensile and compressive stresses can be defined as(3) with a and b representing the distance from the fiber’s neutral axis to the points of maximum tensile and compressive strain. The bending moment M equals EI/R, where EI is the bending rigidity and R is the radius of curvature of the bent filament. Expressing the tensile and compressive forces as a function of the corresponding stresses:
(4) where the area of the segment of the fiber’s circular cross-section which corresponds to the regions of tensile and compressive deformation is defined in the following form:
(5)
We can obtain the final expressions for the force components:(6a)
(6b)
Using the equilibrium of forces F
t − F
c = 0, equation (6) are solved in order to determine the value of a, the distance between the neutral axis and the point of maximum tensile strain. From equation (Equation3(3) ) and the definition of bending moment, the maximum axial compressive strain ε
c applied on the bent fiber is calculated as
(8)
Following this methodology, the applied axial compressive strains during bending have been determined. The radius of curvature of the bent filament needed in equations (Equation6(6a) ) and (Equation7
(8) ) has been determined directly from a still image extracted from the video acquired during the bending test for each specimen. Care was taken in each case to extract the image from the video at the point of maximum filament bending. The (x, y) coordinates of the bent filament are obtained from the still image and the data points are fitted to a polynomial function of the form
(8)
With this expression the curvature κ is evaluated as9
and from R = 1/κ the minimum radius of curvature in the bent filament is found, which represents the point of maximum applied strain.
Using this methodology, the average maximum compressive strains applied to the different filaments with the bending recovery test were determined. Figure shows the maximum applied strains as dashed vertical lines overlapping the typical stress–strain curves of the different materials. For the amorphous filaments, figure clearly shows that the maximum applied compressive strain lays well within the region of elastic deformation for both COP and CoPA, which correlates well with the good bending recovery observed for both filaments (> 99% for COP and > 98% for CoPA). In the case of the semi-crystalline PA66 filament (bending recovery of 97%), it can be seen that the maximum applied compressive strain is located at the region of the stress–strain curve where the deformation begins to transition from elastic to plastic, a lot closer to the compressive yield strain than in the case of the amorphous filaments. Lastly, the curve of the semi-crystalline PET filament (bending recovery of 95%) shows that the maximum applied compressive strain is already in the region of plastic deformation. From the strain distribution depicted in figure , it can be observed that the maximum strains will always appear at the outermost layers of the bent filament. Additionally, the applied strain sees a maximum at the point of minimum radius of curvature of the bent filament. This consideration allows us to conclude that even though the maximum applied axial compressive strain on the PET filaments probably induces a plastic deformation which would be expected to produce permanent damage, the actual portion of filament that may be exposed to the plastic deformation is relatively small, and therefore in spite of the potential compressive damage caused during testing, the PET filaments are still able to reach a bending recovery in the order of 95%.
Figure 13. Typical stress–strain curves in axial compression for the monofilaments of interest. The dashed vertical lines indicate the calculated maximum axial compressive strain applied to the filaments with the bending recovery test.
Applying the same analysis to the case of tensile deformation, it is found that, for all materials under consideration, the maximum applied tensile strains remain well within the region of elastic deformation. From the present analysis it can be generalized that the bending recovery of polymer filaments depends on the combination of two factors. The first factor is the ratio of compressive to tensile modulus, which defines the maximum axial compressive strain applied to the filament by a given bending deformation. The second factor is the axial compressive yield strain of the material. The amorphous filaments demonstrate, as expected, that the best bending recovery values are obtained when the maximum axial compressive strain remains well below the corresponding yield strain.
Conclusion
The high-speed melt spinning and drawing of fully amorphous polymer monofilaments has been achieved. The melt-spun amorphous filaments show an enhanced bending recovery and a reduced tensile stiffness with respect to their semi-crystalline counterparts. Although the attachment of moieties and substituents to the polymer backbone is responsible for the retention of a non-crystalline structure in the melt-spun filaments, it also hinders the formation of lateral intermolecular interactions, resulting in limited compressive modulus values. An analysis of the effect of compressive properties on bending recovery shows that the maximum axial compressive strain applied to a bent filament is defined by the ratio of compressive to tensile modulus. The degree of recovery after bending for the material in question will then be mainly a function of its axial compressive yield strain in relation to the applied maximum axial compressive strain. An analysis of the relationship between degree of crystallinity and bending recovery for specific semi-crystalline filament systems will be the subject of a future work.
Acknowledgments
The authors would like to thank Benno Wuest for the melt spinning of the COP and CoPA polymers, Pierluigi Barbadoro for conducting tensile tests, Kathrin Haefliger for running the DSC scans, Joel Gaechter for analyzing the effect of MEK exposure on the filaments, and the Laboratory of Crystallography at ETH Zurich for the opportunity to perform the WAXD measurements. Monosuisse AG is acknowledged for providing the PP, PET and PA66 monofilaments used in this study. Funds by the Swiss Commission for Technology and Innovation (CTI) and by NanoTera (TecInTex), Switzerland for parts of this work are gratefully acknowledged. Gaurav Mohanty would like to acknowledge funding from the Empa Postdoc program co-funded by FP7: Marie Curie Actions.
References
- LiuX YYuW D 2005 J. Appl. Polym. Sci. 97 310 315 310–5 10.1002/(ISSN)1097-4628
- LarssonFSvenssonL 2002 Composites A 33 221 231 221–31 10.1016/S1359-835X(01)00095-1
- GroverGZhuSTwilleyI C 1993 Textile Res. J. 63 257 266 257–66 10.1177/004051759306300502
- HufenusRAffolterCCamenzindMReiflerF A 2013 Macromol. Mater. Eng. 298 653 663 653–63 10.1002/mame.v298.6
- MarchesiM CVangosaF BPavanA 2012 Textile Res. J. 82 463 473 463–73 10.1177/0040517511427964
- LambG E RButlerR HPrevorsekD C 1975 Textile Res. J. 45 267 272 267–72 10.1177/004051757504500314
- LealA ADeitzelJ MGillespieJ W 2007 Compos. Sci. Technol. 67 2786 2794 2786–94 10.1016/j.compscitech.2007.02.003
- KolgjiniBSchoukensGKiekensP 2012 J. Appl. Polym. Sci. 124 4081 4089 4081–9 10.1002/app.v124.5
- SongS SCakmakMWhiteJ L 1991 Int. Polym. Process. 6 332 336 332–6 10.3139/217.910332
- YilmazFCakmakM 1994 Int. Polym. Process. 9 141 147 141–7 10.3139/217.940141
- HongM HWhiteJ L 2002 Int. Polym. Process. 17 53 59 53–9 10.3139/217.1672
- WrightD DLautenschlagerE PGilbertJ L 2002 J. Biomed. Mater. Res. 63 152 160 152–60 10.1002/(ISSN)1097-4636
- KimH JJeonH G 2009 Polyalkenamer compositions and golf balls prepared therefrom US Patent 7,528,196 B2
- TulsyanK 2008 Amorphous polyamide nanocomposites: effects of thermal stability of the nanoclay modifier Master’s thesis University of Massachusetts Lowell
- YamazakiM 2004 J. Mol. Catal. A-Chem. 213 81 87 81–7 10.1016/j.molcata.2003.10.058
- HufenusRReiflerF AManiura-WeberKSpieringsAZinnM 2012 Macromol. Mater. Eng. 297 75 84 75–84 10.1002/mame.v297.1
- WarnerS B 1995 Fiber Science Englewood Cliffs, NJ Prentice-Hall
- LealA ADeitzelJ MGillespieJ W 2009 J. Compos. Mater. 43 661 674 661–74 10.1177/0021998308088589
- Rodriguez-NavarroA XRD2DScan displaying and analyzing software V4.1. 4.1 ed. Universidad de Granada
- ASTM D2256 Standard Test Method for Tensile Properties of Yarns by the Single-Strand Method 2010
- RabeR 2004 Thin Solid Films 469 206 213 206–13 10.1016/j.tsf.2004.08.096
- UchicM DDimidukD M 2005 Mater. Sci. Eng. A 400–401 268 278 268–78 10.1016/j.msea.2005.03.082
- ObuchiKKomatsuMMinamiK 2007 High performance optical materials cyclo olefin polymer ZEONEX (R) Optical Manufacturing and Testing VII BurgeJ HFaehnleO WWilliamsonR (San Diego, CA: SPIE) U399 U407 U399–407
- AlexanderL E 1969 X-Ray Diffraction Methods in Polymer Science New York Wiley
- SchönhalsAKremerF 2012 Amorphous polymers Polymer Science: A Comprehensive Reference–Volume 1: Basic Concepts and Polymer Properties Amsterdam Elsevier 201 226 201–26
- StribeckN 2007 X-Ray Scattering of Soft Matter Berlin Springer
- KlugH PAlexanderL E 1974 X-ray diffraction procedures 2nd edn New York Wiley
- MurthyN SMinorHBednarczykCKrimmS 1993 Macromolecules 26 1712 1721 1712–21 10.1021/ma00059a034
- MurthyN SBednarczykCRimP BNelsonC J 1997 J. Appl. Polym. Sci. 64 1363 1371 1363–71 10.1002/(ISSN)1097-4628
- RischeTWaddonA JDickinsonL CMacKnightW J 1998 Macromolecules 31 1871 1874 1871–4 10.1021/ma971067i
- Technical Data Sheet, Grilamid TR 90. 2001
- HammerA 2010 Thermische Analyse von Polymeren; Teil 1: DSC an Thermoplasten Thermal Analysis UserCom 31 1 6 1–6 (http://www.masontechnology.ie/x/Usercom_31.pdf)
- ArimotoHIshibash.MHiraiMChataniY 1965 J. Polym. Sci. A Gen. Pap. 3 317 326 317–26 10.1002/pol.1965.100030132
- InoueKHoshinoS 1973 J. Polym. Sci. B Polym. Phys. 11 1077 1089 1077–89 10.1002/pol.1973.180110604
- DenchevaNNunesT GOliveiraM JDenchevZ 2005 J. Polym. Sci. B Polym. Phys. 43 3720 3733 3720–33 10.1002/(ISSN)1099-0488
- AlemánCCasanovasJ 2004 Colloid Polym. Sci. 282 535 543 535–43 10.1007/s00396-003-0957-3
- KohanM I 1995 Nylon Plastics Handbook Munich Hanser
- ButlerR HLambG E RPrevorsekD C 1975 Textile Res. J. 45 426 433 426–33 10.1177/004051757504500513
- NaskarA KMukherjeeA KMukhopadhyayR 2004 Polym. Degrad. Stabil. 83 173 180 173–80 10.1016/S0141-3910(03)00260-X
- PerepelkinK E 2001 Fibre Chem. 33 340 352 340–52 10.1023/A:1013944806849
- HajiARahbarR S 2012 Chem. Ind. Chem. Eng. Quart. 18 233 243 233–43 10.2298/CICEQ111020064H
- AtkinsE D THillMHongS KKellerAOrganS 1992 Macromolecules 25 917 924 917–24 10.1021/ma00028a063
- ColombanPSagonGLesageMRamirezJ M H 2005 Vib. Spectrosc. 37 83 90 83–90 10.1016/j.vibspec.2004.06.007
- VanhaechtB 2004 Macromolecules 37 421 428 421–8 10.1021/ma035103r
- GlommB HNeuenschwanderPSuterU W 2000 Macromol. Chem. Phys. 201 1487 1492 1487–92 10.1002/(ISSN)1521-3935