
Abstract
In this article, we review the characteristic features of icosahedral cluster solids, metallic–covalent bonding conversion (MCBC), and the thermoelectric properties of Al-based icosahedral quasicrystals and approximants. MCBC is clearly distinguishable from and closely related to the well-known metal–insulator transition. This unique bonding conversion has been experimentally verified in 1/1-AlReSi and 1/0-Al12Re approximants by the maximum entropy method and Rietveld refinement for powder x-ray diffraction data, and is caused by a central atom inside the icosahedral clusters. This helps to understand pseudogap formation in the vicinity of the Fermi energy and establish a guiding principle for tuning the thermoelectric properties. From the electron density distribution analysis, rigid heavy clusters weakly bonded with glue atoms are observed in the 1/1-AlReSi approximant crystal, whose physical properties are close to icosahedral Al–Pd–TM (TM: Re, Mn) quasicrystals. They are considered to be an intermediate state among the three typical solids: metals, covalently bonded networks (semiconductor), and molecular solids. Using the above picture and detailed effective mass analysis, we propose a guiding principle of weakly bonded rigid heavy clusters to increase the thermoelectric figure of merit (ZT) by optimizing the bond strengths of intra- and inter-icosahedral clusters. Through element substitutions that mainly weaken the inter-cluster bonds, a dramatic increase of ZT from less than 0.01 to 0.26 was achieved. To further increase ZT, materials should form a real gap to obtain a higher Seebeck coefficient.
1. Introduction
Since the discovery of icosahedral quasicrystals in liquid-quenched Al–Mn alloys by Shechtman et al [Citation1], extensive studies have been performed on the structural [Citation2], electrical [Citation3, Citation4], thermal [Citation5], and magnetic properties [Citation6] of many stable quasicrystals and related approximant crystals [Citation7]. Quasicrystals and their approximants are recognized as complex metallic phases constructed from clusters with icosahedral symmetry, which cannot coexist with periodicity. In particular, Al-based quasicrystals, which are called Al-based icosahedral cluster solids (ICSs), exhibit non-metallic behavior. This can be understood by the formation of a deep pseudogap near the Fermi energy and the electron localization effect arising from the quasiperiodic arrangement [Citation8]. The origins of the pseudogap and the stabilization mechanisms of quasicrystals are the Fermi surface–Brillouin zone interactions, the Hume-Rothery mechanism [Citation9–Citation12], and covalent bonds including sp–d hybridization [Citation13, Citation14]. From comparative studies of Al- and B-based ICSs, the concept of metallic–covalent bonding conversion (MCBC) has been proposed by Kimura et al [Citation13, Citation15], and this is the first topic of this review article. For the related approximants, band structure calculations are a powerful tool because they provide beneficial information about atomic orbital hybridization, the electron density distribution, and pseudogap formation in the electronic density of states (DOS) of both real materials and hypothetical structure models [Citation16, Citation17].
Al-based icosahedral quasicrystals represented by Al–Pd–Re and Al–Pd–Mn ternary systems exhibit a semiconductor-like transport property with high Seebeck coefficient (S) [Citation18]. Because of their giant unit cells and complex crystal structures, their thermal conductivities are close to 1 W/(m K), which is comparable to the thermal conductivity of glass materials as demonstrated by Chernikov et al [Citation5]. Therefore, one of the possible applications of quasicrystals is as thermoelectric materials, which is the second topic of this review article. It is possible to obtain a high dimensionless figure of merit (ZT), ZT = S 2σT/κ, where σ, κ, and T are the electrical conductivity, thermal conductivity, and temperature, respectively, by optimizing the individual parameters [Citation19]. Pope et al first reported the ZT for the Al–Pd–Mn quasicrystal in 1999 [Citation20]. In 2002, the composition dependence of the thermoelectric properties of Al–Pd–Re quasicrystals was systematically investigated by Kirihara and Kimura [Citation21]. Maciá performed theoretical calculations of various types of quasicrystals and approximants using an analytical model, and recently published a review [Citation22]. For Al-based approximant crystals, Takeuchi et al reported the band structure and phonon dispersion calculations, and discussed the intrinsic properties caused by a deep pseudogap [Citation23, Citation24].
This review contains three parts. First, we outline the characteristic features of both Al- and B-based ICSs and discuss their possible applications, such as thermoelectric [Citation21], superconducting [Citation25], and high-resistive chip [Citation26] materials. Next, we explain the bonding nature in the related approximants revealed by the maximum entropy method and Rietveld refinement for powder x-ray diffraction (MEM/Rietveld) analysis. Discussions include the relationship between the bonding nature, electronic structure, and electrical and thermal properties. Finally, we overview the thermoelectric properties and ZT enhancement using the guiding principle of weakly bonded rigid heavy clusters (WBRHCs) proposed by Kimura et al [Citation27].
2. ICS: characteristic features and potential applications
Figure shows an outline of the characteristic features and potential applications of Al- and B-based ICSs constructed by Kimura et al [Citation15]. (1) ICSs have complex structures, such as quasicrystals or giant-unit-cell crystals, because the icosahedral symmetry cannot coexist with periodicity. (2) B and Al are located at both sides of the boundary between elements, which have covalent and metallic bonds. Among the group-13 elements, an elemental crystal of only boron has covalent bonds and is a semiconductor. Of course, pure Al has metallic bonds and its crystal is a metal. However, the 1/1-AlReSi approximant, which consists of Al12 icosahedra without a central atom like B12, exhibits a covalent bonding nature and shows semiconductor-like transport properties. On the other hand, the isolated Al13 icosahedral cluster and the Al12Re icosahedron in the 1/0-Al12Re approximant have metallic bonding nature with an atom in the center of the icosahedra. The latter crystal has metallic transport properties. Therefore, MCBC is expected. The details of the chemical bonding nature of Al-based approximants are discussed in section 3. (3) ICSs can have a very deep pseudogap near the Fermi energy because of the high isotropy of the icosahedral symmetry according to the Hume-Rothery mechanism. (4) The opposite of (3): ICSs can have a high density of states at the Fermi energy because of high degeneracy of electronic states caused by the high symmetry of the structure.
Figure 1. Characteristic features and potential applications of Al- and B-based icosahedral cluster solids (ICS).
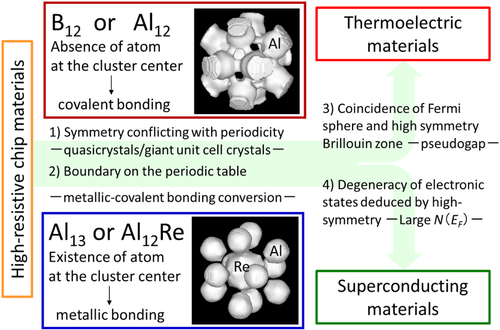
Feature (4) is advantageous for high superconducting transition temperature materials. Indeed, a superconducting transition was recently discovered in Li-doped α-boron [Citation25]. One of the possible applications using the bonding conversion (feature (2)) is high-resistive chip materials [Citation26]. V-doped amorphous boron can simultaneously have a relatively high electrical resistivity and a very small temperature dependence of the electrical resistivity. The strong covalency would deepen the pseudogap, which results in a high S. Using this bonding conversion can control the transport properties, such as the coexistence of high σ and large S values [Citation18]. Furthermore, five-fold symmetry conflicting with the periodicity decreases κ because of a giant unit cell and its complex crystal structure. These features are favorable for thermoelectric materials [Citation21], which can generate power through the direct conversion of heat energy into electrical energy.
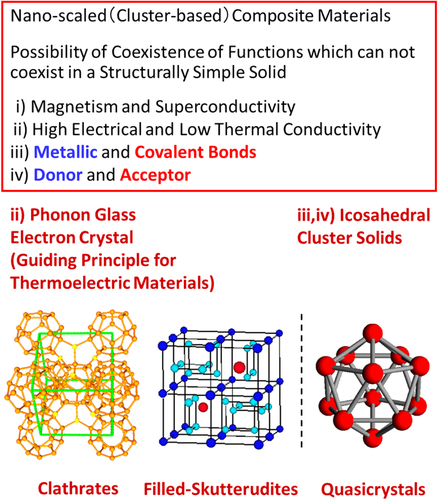
Table lists the differences between structurally simple and complex solids. Structurally simple solids have small unit cells and only one atomic site for each element, while structurally complex solids are giant-unit-cell crystals, quasicrystals, and amorphous solids with many types of atomic site for each element. These structurally complex solids are considered to be nanoscale, cluster-based composite materials and there is the possibility for the coexistence of functions that cannot coexist in structurally simple solids, as shown in figure . For example, (i) magnetism and superconductivity, (ii) high electrical and low thermal conductivity, (iii) metallic and covalent bonds, and (iv) electron donors and electron acceptors. Feature (ii) agrees with the well-known guiding principle of phonon glass, electron crystals (PGECs) proposed by Slack [Citation28] for high-performance thermoelectric materials such as clathrates [Citation29] and skutterudites [Citation30]. ICSs possess features (iii) and (iv), and (iii) is favorable for high-performance thermoelectric materials, as described in section 4.
Table 1. Comparison between structurally simple and complex solids.
Figure 2. Icosahedral cluster solids (ICS) as structurally complex solids.
3. MCBC and bonding distribution in Al-based ICSs
Table shows a comparison between (a) the well-known metal–insulator transition and (b) MCBC. (a) is the whole solid phenomenon but is determined by the electronic states only at the Fermi energy (EF). When the density of states at EF (D(EF)) is finite and the wave function at EF is extended, the solid is a metal. When D(EF) is zero or the wave function at EF is localized, the solid is an insulator. On the other hand, (b) is a local phenomenon but is related to all valence electrons. The concept of MCBC (b) is closely related to the metal–insulator transition (a), although both are clearly distinguishable. A typical example is doped silicon. When boron or phosphorus is heavily doped in silicon, it can be metallic, i.e., the metal–insulator transition occurs, but its sp3 covalent bond does not change, i.e., MCBC does not occur.
Table 2. Comparison between (a) the metal–insulator transition and (b) metallic–covalent bonding conversion.
To experimentally investigate MCBC, we performed a MEM/Rietveld analysis using the BL02B2 beamline at the SPring-8 synchrotron facility (Hyogo, Japan). This method is widely used to visualize the electron density distribution between atoms in real-space, and was developed by the group of Sakata and Takata [Citation31–Citation33]. First, we investigated the pure elements Si and Al as typical examples of covalent and metallic bonding networks, respectively. Figure shows the equidensity surfaces for pure Si and Al by MEM/Rietveld analysis. Covalently bonded (sp3-hybridized) electrons can be clearly seen between the atoms in Si even in the high equidensity surface (0.40 e Å−3). On the other hand, such bonding electrons are not observed and the electron density distribution is completely spherical for Al even if the equidensity surface level is lowered to 0.25 e Å−3. Because the average valence electron densities of Si and Al are 0.20 and 0.18 e Å−3, respectively, the above situation does not change when the charge densities are normalized using the average valence densities, i.e., that of Al increases by only about 10%. From this result, MEM/Rietveld analysis can clearly show the difference between covalent and metallic bonds.
Figure 3. Equidensity surfaces (0.25–0.40 e Å−3) of the electron density for (a) Si (covalent bonding nature) and (b) Al (metallic bonding nature).
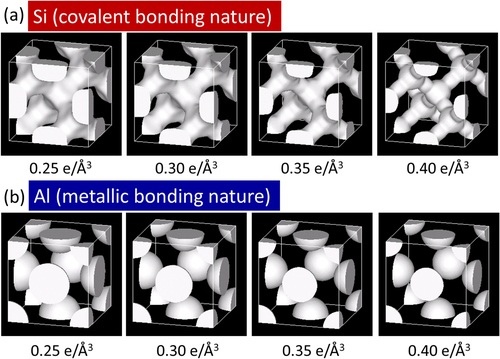
In figure (a), there is a small charge density maximum at the bond midpoint, which is an artifact and originates from the insufficient d-spacing range of the experimental structure factors [Citation33]. Although this maximum completely disappears using the d-spacing range d > 0.343 [Citation33], d > 0.76 was used in figure because a similar range (d > 0.80) was used in figure . The magnitude of this maximum was estimated to be less than 0.03 e Å−3 [Citation32, Citation33] and does not affect the qualitative discussion of figures and (b).
Figure 4. Equidensity surfaces (0.25–0.40 e Å−3) of the electron density for icosahedral clusters of (a) the 1/1-AlReSi approximant and (b) the 1/0-Al12Re approximant [Citation13].
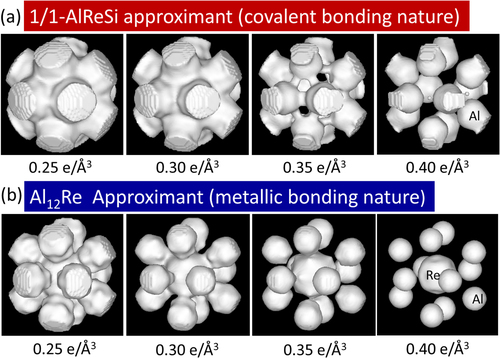
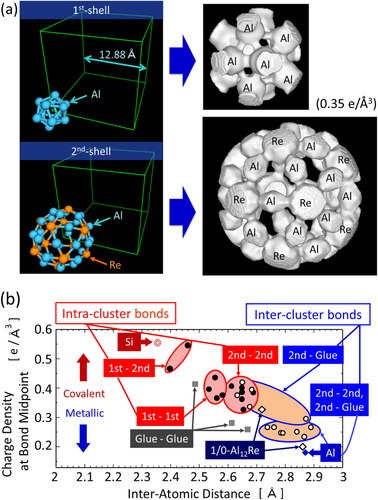
Next, we discuss the results of icosahedral approximants containing an Al12 icosahedron without the central atom (1/1-AlMnSi and 1/1-AlReSi icosahedral approximants) and the Al12Re icosahedron with a central atom (1/0-Al12Re icosahedral approximant) [Citation13, Citation34, Citation35]. Figure shows the equidensity surfaces of the first-shell cluster of the 1/1-AlReSi and 1/0-Al12Re approximants. Both compounds have the same Al12 icosahedron building block, although the Al12 cluster is slightly strained because of the cubic symmetry of the crystalline structure. The structural difference between the two structures arises from the occupation of the cluster center site. In the 1/1-AlReSi approximant, the center of the first-shell Al12 icosahedron is vacant, whereas the center is occupied with Re in the 1/0-Al12Re approximant, as confirmed by Rietveld analysis. For the 1/1-AlReSi approximant, there is high electron density between Al atoms in the first-shell cluster and also between Al atoms in the first-shell cluster and Re atoms in the second-shell cluster at 0.35 e Å−3 (figure (a)). The latter bonds are the very thick bonds directed towards the outside of the icosahedron along the five-fold direction in figure (a). This covalent bond is considered to be sp- (Al) and d-electron (Re) hybridization. On the other hand, 1/0-Al12Re does not have such strong bonds between Al atoms in the first-shell cluster, and the electron density distribution is almost spherical at 0.35 e Å−3. Because the average valence electron densities of 1/1-AlReSi and 1/0-Al12Re are 0.24 and 0.20 e Å−3, respectively, the above situation, whether a covalent bond exists between Al atoms in the icosahedron or not, does not change when the charge densities are normalized using the average valence densities, i.e., that of 1/1-AlReSi decreases by about 20%. From the above comparison between Al12 and Al12Re icosahedra, the occupation of the central site with a Re atom induces the bonding conversion from more covalent to more metallic, which was called MCBC by Kimura et al [Citation13, Citation15, Citation36].
Figure 5. (a) Equidensity surfaces (0.35 e Å−3) of the electron density of the first- and second-shell clusters and (b) electron density at the bond midpoint in the 1/1-AlReSi approximant, together with the data of 1/0-Al12Re, and pure Si and Al [Citation13].
It is mentioned that most features of the electron density obtained by ab initio calculations of 1/1-AlMnSi [Citation37] are in qualitative agreement with the experimental result [Citation34], which was obtained from the same MEM/Rietveld analysis as that used for figures 4 and 5 [Citation13]. It has also been confirmed that MCBC occurs for 13 atom (with a central atom and metallic) and 12 atom (without a central atom and covalent) icosahedral clusters of Al and B using semi-empirical [Citation36] and ab initio molecular orbital calculations [Citation38, Citation39]. In the latter two cases of [Citation38] and [Citation39], not only the electron density but also its Laplacian and the electron localizability indicator, which were proposed to study the chemical bonding nature by Bader [Citation40] and Kouhout [Citation41, Citation42], respectively, were investigated. MCBC from the 13-atom metallic to the 12-atom covalent icosahedron is consistent with the packing fractions of 0.726 and 0.604, respectively. The former value is close to 0.744 for the close-packed structure and the latter value approaches 0.340 for the diamond structure.
Figure 5(a) shows the equidensity surfaces of the electron density for the first- and second-shell clusters of the 1/1-AlReSi approximant. It was found that the bond thicknesses, i.e. strengths, are distributed, as mentioned for figure (a) in the second previous paragraph. To determine the bond strength distribution, the charge (electron) densities at various bond midpoints are plotted in figure (b) [Citation13], together with those for the 1/0-Al12Re approximant, and pure Si and Al. The bond strength is widely distributed from strong covalent bonds for Si to weak metallic bonds for Al. The coexistence of covalent and metallic bonds and the wide distribution of bond strengths are characteristic features of structurally complex solids, as described in section 2. Furthermore, the bond strengths of the intra-cluster bonds are significantly stronger than those of the inter-cluster bonds, suggesting that this crystal is partly molecular-solid-like. For 1/0-Al12Re, the bond strengths of Al–Re and Al–Al are much weaker than those for 1/1-AlReSi, which is consistent with the qualitative conclusion in the second previous paragraph.
The above situation, where the charge density at the bond midpoint is well-correlated with the inter-atomic distance from weak purely metallic to strong purely covalent bonds in Al, 1/0-Al12Re, 1/1-AlReSi, and Si, is a simple case and is not necessarily general. For example, in the RuGa2, which is a similar 13 group and transition metal elements compound, the highest electron density bond has a longer bond length than several of the other bonds [Citation43].
Unfortunately, MEM analysis cannot be applied to quasicrystals. Instead, indirect evidence by comparing the experimental quasi-lattice constants (parameters) and the average atomic radii has been used to determine the covalent bonding nature in Al–Pd–Re quasicrystals [Citation44]. According to this analysis, the covalent bonding nature increases with increasing transition metal concentration, because the electron density of the strong covalent bond between Al and the transition metal elements increases with increasing transition metal concentration.
Finally, we discuss the relationship between the bonding nature, electronic structure, and electronic transport properties. Although MCBC is clearly distinguishable from the metal–insulator transition, they are closely related. If the covalent bonds in the 1/1-AlReSi approximant are sufficiently strong, they should contribute to form a (narrow) band gap in the vicinity of E F, such as that seen in the related RuAl2 and RuGa2 crystals [Citation45, Citation46]. However, band structure calculations indicate that the 1/1-AlReSi approximant forms a deep pseudogap instead of a real gap, as shown in figure (a), which is consistent with a previous result [Citation23] and table . The minimum density of states (D(E)) near E F is about 1/10 of the free electron value. The origin of the finite D(E F) is considered to be the weak inter-cluster bond, which is close in strength to the pure Al–Al bonds as shown in figure 5(b). On the other hand, although the 1/0-Al12Re approximant has weak metallic bonds between the Al atoms of the first shell, the bonds between the Al atoms and the central Re atom are slightly stronger, which can be seen by the weak bonds in the equidensity surfaces for ⩽0.30 e Å−3 in figure (b). The weak Al–Re bonds may cause formation of a shallow pseudogap at E F, as shown in figure (b) and table . The minimum D(E) near E F of the 1/0-Al12Re approximant is about 1/2 of the free electron value and about five times larger than that of the 1/1-AlReSi approximant. From comparison of the 1/0-Al12Re and 1/1-AlReSi approximants, a stronger covalent bonding nature results in a deeper pseudogap.
Figure 6. Bonding nature of the first-shell Al icosahedral cluster and the electronic density of states of (a) 1/1-AlReSi and (b) 1/0-Al12Re approximants. (c) The temperature dependence of the electrical resistivity of the icosahedral Al–Pd–Re quasicrystal, and 1/1-AlReSi, 1/1-AlMnSi, and 1/0-Al12Re approximants.
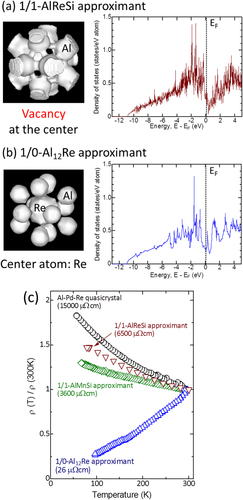
Table 3. Minimum electronic density of states near E F and calculated density of states at E F using the free electron model for 1/1-AlReSi and 1/0-Al12Re approximants.
To investigate the electrical and thermal properties in detail, band structure calculations are a powerful tool and widely used to calculate the thermoelectric properties [Citation47]. The DOS calculation can qualitatively explain the experimental electrical resistivity measurement results shown in figure (c). The 1/1-AlReSi approximant with a deep pseudogap exhibits a negative temperature coefficient of resistivity (TCR) with high electrical resistivity (ρ 300K) of 6500 μΩ cm at 300 K. The origin of the negative TCR is considered to be localization tendency, which is usually stronger for smaller D(E). On the other hand, the 1/0-Al12Re approximant with a shallow pseudogap shows a positive TCR with a low value of ρ 300K =26 μΩ cm because of the large D(E F). Both the intra- and inter-cluster bond strengths in the 1/1-AlReSi approximant are significantly stronger than those in the 1/1-AlMnSi approximant [Citation13, Citation34, Citation35]. Indeed, the 1/1-AlMnSi approximant forms a shallower pseudogap than the 1/1-AlReSi approximant from the band structure calculation by Takeuchi [Citation48]. Thus, a relatively low value of ρ 300K = 3600 μΩ cm and shelving TCR was observed in the 1/1-AlMnSi approximant. Among the examples shown in figure (c), the icosahedral Al–Pd–Re quasicrystal exhibits the highest room temperature electrical resistivity of ρ 300K = 15000 μΩ cm and the most negative TCR, indicating that the Al–Pd–Re quasicrystal should have the deepest pseudogap because of the strong covalent bonds between the Al and Re atoms, as mentioned above.
It should be noted that some arc-melted and annealed Al–Pd–Re quasicrystals and 1/1-AlReSi approximants have porous microstructures. Although the absolute value of ρ is affected by pores and cracks in the sample microstructure, the TCR is hardly affected by them. S is also not greatly affected by such porous microstructures [Citation49], but strongly depends on the local electronic structure near E
F. S can be approximated by1 From equation (Equation1
1 ), a large S is obtained when D(E) is small and the gradient of D(E) is large at E
F. Therefore, a deep pseudogap can increase S. Indeed, large S values of 90–100 and 50–60 μV K−1 were obtained for Al–Pd–Re quasicrystals [Citation21] and 1/1-AlReSi approximants [Citation23], respectively. On the other hand, the metallic 1/0-Al12Re approximant with a shallow pseudogap has an S value of 2 μV K−1 [Citation50]. Among these materials, the Al–Pd–Re quasicrystal with strong covalency should form the deepest pseudogap, which is suitable for obtaining a large S. Details of the effect of improving the microstructure on the thermoelectric properties is described in section 4.
Although the electronic transport properties are well explained by the electronic structure near EF, it is not clear how to control it. Controlling the carrier concentration is easy and frequently effective to control the bulk thermoelectric properties when the rigid band scheme is applicable [Citation23, Citation51]. Because the bonding nature greatly affects the pseudogap formation near EF, which has a large influence on the bulk thermoelectric properties, it can be an easily controllable factor, when the rigid band scheme is not applicable. We have proposed a new guiding principle to increase the thermoelectric performance by controlling the bonding nature, and it will be explained in section 4.
4. Thermoelectric properties of Al–Pd–(Re, Mn) icosahedral quasicrystals and a guiding principle to increase ZT: WBRHCs
As described in section 2, Al-based ICSs have several advantages for thermoelectric materials. In particular, Al–Pd–(Re, Mn) icosahedral quasicrystals are the most promising candidates because they have the strongest bonds, the deepest pseudogap, and the largest S, as discussed in section 3. Furthermore, as described in section 3, 1/1-AlMnSi and 1/1-AlReSi approximants have a continuous range of bond strengths from covalent to metallic. Overall, the bond strengths of intra-cluster bonds are stronger than those of inter-cluster bonds. This mean that these approximants are considered to be an intermediate state among the three typical solids: metals, covalently bonded networks (semiconductors), and molecular solids, as shown in figures (a) and (b). This unique situation is considered to be the same for Al–Pd–(Re, Mn) icosahedral quasicrystals because they have similar icosahedral cluster building blocks to Mackay icosahedral (MI) clusters.
Figure 7. (a) Main building block, Mackay icosahedral (MI) clusters, and glue atoms (magenta atoms) in Al-based icosahedral approximants and quasicrystals. (b) Diagram of the guiding principle of weakly bonded rigid heavy clusters (WBRHCs). The effective mass (m*) increases by weakening of inter-cluster bonds (V o) or strengthening of intra-cluster bonds (V i). The composition dependences of the effective mass ratio ((c) and (d)) and the maximum dimensionless figure of merit ((e) and (f)) for Al–Pd–Re ((c) and (e)) and Al71Pd20(Re1 − x Ru x )9 ((d) and (f)) quasicrystals. m e* and m h* are the effective masses of the electron and hole, respectively, obtained from fitting the data in figure by the two-band model, and m e is the electron mass in vacuum. e/a is the mean number of valence electrons per atom ratio, and decreases with increasing transition metal concentration. The letters A, B, C, and D in (b)–(f) correspond to each other [Citation53].
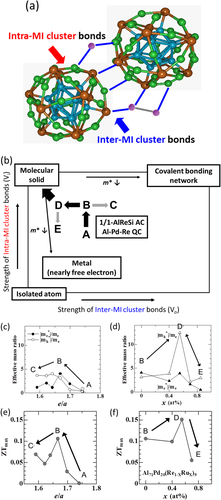
To further improve the thermoelectric performance of the Al–Pd–(Re, Mn) quasicrystals, we have proposed a guiding principle for increasing ZT: WBRHCs [Citation27]. To increase ZT, it is essential to simultaneously optimize σ, S, and the electron and phonon thermal conductivities (κ e and κ p). Although there are several suggested guides for increasing ZT represented by PGECs [Citation28], WBRHCs are different from the other cases and was also introduced in the News and Views of Nature Materials by Thiel [Citation52]. In PGECs, phonon transfer is difficult (like in glass) but electron transfer is easy (like in crystals), such as in clathrates and filled-skutterudites, as described in section 2. Figure (b) shows a schematic diagram of the WBRHCs scheme with varying intra- and inter-MI-cluster bonds strengths (V i and V o, respectively). At the limit of the molecular solid, V i and V o determine the band interval and band width, respectively. The effective mass (m*) decreases with increasing band width, i.e., V o. On the other hand, m* decreases with decreasing V i because of the small m* of typical (nearly free electron) metals. Increasing V i and decreasing V o (WBRHCs, the direction of thick black arrow in figure (b)) increases m* and enhances the thermoelectric performance (i.e., increases ZT) as follows. For the nearly free electron model with m*, the power factor2 which is the numerator of ZT, is simply proportional to m* and τ, and inversely proportional to n 1/3. κ p can be expressed as
3 where C, a, K, M, and τ p are the specific heat, the distance between clusters, the force constant of bond between clusters, the mass of a cluster, and the relaxation time of a phonon, respectively. In the WBRHCs scheme, m* increases by weakening the inter-cluster bonds and strengthening the intra-cluster bonds, and thus S 2σ should increase. Simultaneously, K, i.e. κ p, decreases by weakening of the inter-cluster bonds. By both increasing S 2σ and decreasing κ p, ZT should increase through weakening of the inter-cluster bonds and strengthening of the intra-cluster bonds. Additionally, M increases through heavy element substitution, and τ p can be decreased by an alloying effect. Heavy metal substitution and alloying effect also decrease κ p and increases ZT.
From m* analysis using the two-band model of the ternary Al–Pd–Re and quaternary Al–Pd–Re–Ru quasicrystals, we confirmed that the WBRHCs was effective [Citation53]. Figure shows the temperature dependences of σ and S for Al71Pd20(Re1 − x Ru x )9. The solid lines are fitted curves obtained using the two-band model. From the bond strength analysis of the isostructural 1/1-AlMnSi and 1/1-AlReSi approximants described in section 3, the intra-cluster bonds are stronger than inter-cluster bonds (i.e., V i > V o), and both the intra- and inter-cluster bonds of the 1/1-AlReSi approximant are stronger than those of the 1/1-AlMnSi approximant [Citation13, Citation34, Citation35]. This indicates that the bond strengths of 5d transition metal elements are higher than those of 4d transition metal elements, and that the bond strengths of 4d transition metal elements are higher than those of 3d transition metal elements, as shown in figure .
| (i) | In the ternary Al–Pd–Re quasicrystal, transition metals are considered to first occupy the intra-cluster transition metal sites and then the inter-cluster site, because the former sites have stronger bonds, like in figure 5(b). Accordingly, m* (i.e., ZT max) has been experimentally confirmed to increase with increasing V i (A → B in figures (b), (c) and (e)), where the number of transition metal atoms in the intra-cluster sites increases, and then to decrease with increasing V o (B → C in figures (b), (c) and (e)), where the number of transition metal atoms in the inter-cluster sites increases. | ||||
| (ii) | In the quaternary Al–Pd–Re–Ru system, starting from the highest ZTmax composition of the ternary system (B in figure ), Ru is considered to first substitute at weak inter-cluster Re sites with low Ru concentration and decrease the bond strength Vo (B → D in figure (b)), because Ru forms a weaker bond than Re. At high Ru concentration, after the inter-cluster sites are fully occupied by Ru, Ru substitutes at intra-cluster Re sites, and Vi decreases (D → E in figure (b)). In this case, m* has been experimentally confirmed to first increase and then decrease with increasing Ru concentration (B → D → E in figures (d) and (f)). | ||||
| (iii) | The higher m* than that of D should be obtained in the direction of decreasing Vo and increasing Vi (the thick black arrow in figure (b)). | ||||
Figure 8. Temperature dependence of (a) electrical conductivity and (b) Seebeck coefficient for Al71Pd20(Re1 − xRux)9. The solid lines are fitted curves obtained using the two-band model [Citation53].
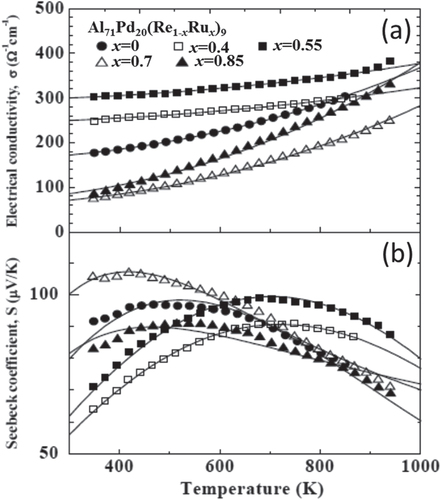
Figure 9. Transition metal elements that are candidates for substitution in the Al–Pd–Re quasicrystal. The bond strength will decrease with decreasing atomic number in congener. Route (1) is Ru and Fe substitution in the Re site, and route (2) is full replacement of Mn in Re sites.
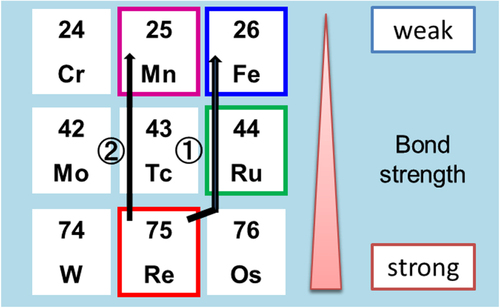
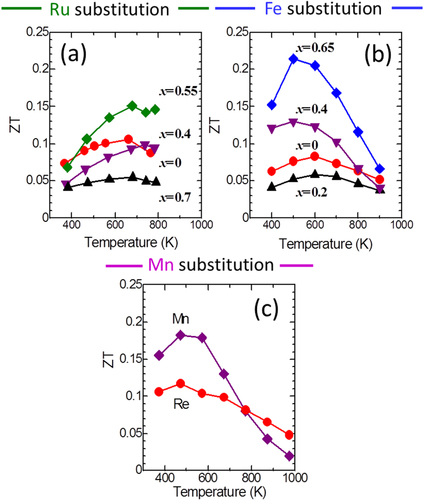
According to the WBRHCs scheme, we performed two more substitutions, as shown in figure . One was Fe substitution following Ru substitution for Re, and the other was full replacement of Mn for Re. From the composition optimization for high ZT with Al–Pd–Re quasicrystals as a starting material [Citation21], we selected Al71Pd20Re9 as the composition (B in figure ). In the Al–Pd–Re quasicrystals, ZT greatly increased from less than 0.01 to 0.11 by composition optimization. However, one remaining issue is that σ is difficult to reproduce because the sample contains a lot of pores and cracks. The effects of pores and cracks depend on the measurement sample area, as will be discussed later. Through Fe substitution for Re in the Al71Pd20Re9 quasicrystal [Citation54], it is expected that the inter-cluster bond strength decreases, which then decreases the intra-cluster bond strength at high Fe concentration, similar to the Ru case. In these cases, σ and S significantly increased at medium forth-element concentrations, that is, substitution of x = 0.55 Ru and x = 0.65 Fe. Thus, S2σ significantly increased from an increase in m*. Substitution with a fourth element decreased the phonon thermal conductivity because of the decrease of both K by weakening the inter-cluster bonds and τp by an alloying effect. As a result, maximum ZT values of 0.15 and 0.22 were obtained for optimized Al71Pd20(Re1 − xRux)9 (x = 0.55) [Citation53] and Al71Pd20(Re1 − xFex)9 (x = 0.65) [Citation54], respectively, as shown in figures (a) and (b).
Figure 10. Dimensionless figure of merit (ZT) as a function of temperature for (a) Al71Pd20(Re1 − xRux)9 (x = 0, 0.4, 0.55, 0.7) [Citation53], (b) Al71Pd20(Re1 − xFex)9 (x = 0, 0.2, 0.4, 0.65) [Citation54], and (c) Al71Pd20(Mn, Re)9 [Citation55] quasicrystals.
Before discussing the effect of Mn replacement for Re, we will briefly mention the improvement of the porous microstructure in Al–Pd–Re quasicrystals. After arc-melting and annealing the Al–Pd–Re quasicrystal, a large number of pores and cracks are observed, as shown in figure (a). In this case, the relative density is less than 70%. These extrinsic factors result in poor electrical properties and anisotropy, which is often disadvantageous for thermoelectric materials in terms of the difficulty in controlling the microstructure and brittleness. Therefore, various ZT values have been reported for the same composition of the Al–Pd–Re quasicrystal [Citation21, Citation53, Citation54], as shown for x = 0 in figures (a) and (b). To avoid the influence of the extrinsic factors on the electrical conductivity, we used the spark plasma sintering (SPS) method to obtain samples with no cracks and fewer pores as shown in figure (b) [Citation49]. After successfully synthesizing a nearly 100% relative density sample, we found that both the electrical and thermal conductivities increased, but the pores and cracks did not have a large influence on S [Citation49]. As a result of increasing σ by increasing the electron mobility, a ZT value of 0.12 was obtained for the sintered Al71Pd20Re9 quasicrystal as shown in figure (c). Al–Pd–Mn quasicrystals do not contain a large number of pores, but they do contain some cracks. The relative density of Al–Pd–Mn quasicrystals is typically greater than 95%, indicating that it is not necessary to improve the microstructure.
Figure 11. (a) Typical example of the porous microstructure in arc-melted and annealed Al–Pd–Re quasicrystal. The black area represents macroscopic pores and/or cracks. (b) That of the dense microstructure in SPS sintered one. The magnifications are the same for (a) and (b).
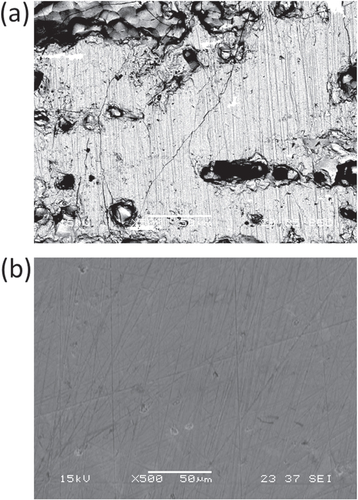
Figure (c) shows the temperature dependence of ZT for Al71Pd20Mn9 and sintered Al71Pd20Re9 quasicrystals [Citation55]. Note that, the composition of Al71Pd20Mn9 shows the highest S2σ, which is the same situation as in the Al–Pd–Re system. The Al71Pd20Mn9 quasicrystal exhibited a relatively high ZT value of 0.16 at 373 K, which is much higher than that of the different composition Al70.8Pd20.9Mn8.3 (0.08 at room temperature) [Citation20]. Similarly, in Al–Pd–Re quasicrystals, the thermoelectric properties are sensitive to the sample’s composition, which can be understood by the average valence electron number per atom (e/a) [Citation49]. This is mainly because of a deep pseudogap near EF in both Al–Pd–Re and Al–Pd–Mn quasicrystals. The Al71Pd20Mn9 quasicrystal shows a higher ZT value than that of the Al71Pd20Re9 quasicrystal mainly because of its high σ. The differences in S and σ between the Re and Mn quasicrystals can be explained by the difference of the DOS near EF, which is caused by weakening of both the inter- and intra-cluster bond strengths. To further increase ZT in Al-based icosahedral quasicrystals, we used the Al71Pd20Mn9 quasicrystal as a new starting material.
Next, we discuss the effect of Ga substitution for Al in the Al71Pd20Mn9 quasicrystal. The reason why we selected Ga as a substitution element is that the bond strengths of typical elements is weaker in later periods of the periodic table (figure (a)), which is the opposite to that of the transition metal elements (figure ). We succeeded in increasing ZT from 0.18 to 0.26 through Ga substitution for Al, as shown in figure (c) [Citation55, Citation56]. In this case, we found that Ga substitution below 4 at.% did not greatly change m*, because there was no significant change in both σ and S. To investigate the Ga substitution effect on the DOS for the Al–Pd–Mn quasicrystal, Zijlstra et al calculated the DOS using the Quandt–Elser model [Citation57–Citation59], which we were able to reproduce. The calculated results are shown in figure . Deep pseudogaps form at EF for both the Al–Pd–Mn and Al–Ga–Pd–Mn (4 at.% Ga substituted for Al) systems. However, there is no significant difference in the DOS (figure ). On the other hand, κ (especially κp) beneficially decreased by Ga substitution, as shown in figure (b) and table , by the combination of weakening of the inter-cluster bonds and an alloying effect (phonon scattering by the disordered lattice induced by the alloying) [Citation55]. κ near room temperature was at the level of the theoretical minimum thermal conductivity (κmin). κp was obtained by subtracting the electron thermal conductivity (κe) determined using the Wiedemann–Franz law from κ.
Figure 12. (a) Ga substitution of Al sites in the Al–Pd–Mn quasicrystal to weaken the inter-cluster bonds. (b) The thermal conductivity (κ) and (c) the dimensionless figure of merit (ZT) as a function of temperature for Al71 − xGaxPd20Mn9 (x = 0, 2, 3) [Citation56].
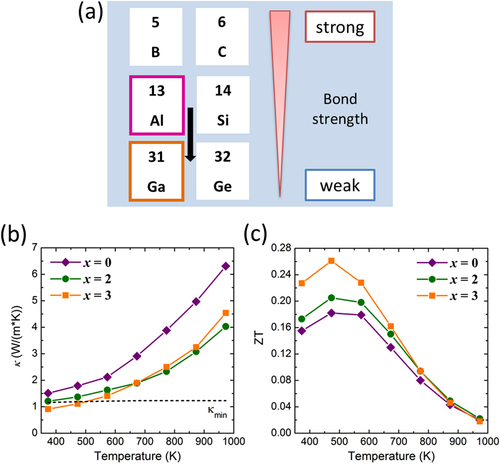
Figure 13. Electronic density of states (DOS) for Al–(Ga)–Pd–Mn quasicrystals using the Quandt–Elser model [Citation57–Citation59]. The inset shows the DOS in the vicinity of the Fermi energy.
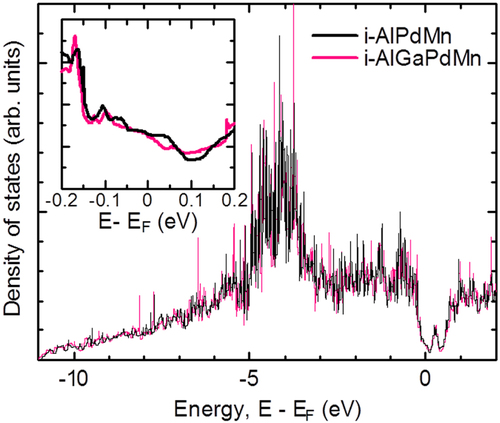
Table 4. Average speed of sound (vs), Debye temperature (θD), relative change in the relaxation time of the phonon (Δτp/τp), and phonon thermal conductivity (κp) for Al71 − xGaxPd20Mn9 quasicrystals (x = 0, 2, 3) at room temperature [Citation55].
To confirm the weakening of the inter-cluster bonds by Ga substitution for Al, we performed a speed of sound measurement because MEM/Rietveld analysis cannot be directly applied for quasicrystals. The average speed of sound (vs), the Debye temperature (θD), the relative change in the relaxation time of the phonon (Δτp/τp), and κp for Al71 − xGaxPd20Mn9 quasicrystals (x = 0, 2, 3) are listed in table 4 [Citation55]. The vs and θD values of the samples with x = 0 and 2 are almost identical, but those of the sample with x = 3 significantly decrease, indicating that the force constant (K) should be lower for x = 3 than for x = 0 and 2. vs can be expressed as4
To confirm the decrease of K by the Ga substitution, we substituted the parameters vs (or θD, −7.6%), a (+0.1%), and M (+2.8%) for the x = 3 sample into equation (Equation44 ) and obtained −15% of K, which is in good agreement with the WBRHCs picture. The experimental value of κp decreased by more than 50% after Ga substitution. Therefore, from equation (Equation3
3 ), Δτph should decrease by about 35% through the alloying effect.
Finally, we briefly mention the recent progress in Ga-substituted Al70Pd21Re9 quasicrystals. Although very small amounts of the Al11Re4 and Al3Pd2 binary phases are observed in sintered samples, σ and S increase with Ga substitution [Citation60], which is a different trend to Al–Ga–Pd–Mn quasicrystals. Ga substitution leads to a decrease in the phonon thermal conductivity, and results in ZT increasing from 0.12 to 0.18 [Citation60]. However, this value does not exceed the maximum value of 0.26 for the Al68Ga3Pd20Mn9 quasicrystal.
The above experimental results demonstrate that our established guiding principle (WBRHCs) provides a route for increasing ZT in cluster-based complex structure solids, especially by weakening the inter-cluster bonds. However, this principle does not yet offer the upper ZT limit of a target material. As frequently discussed in the thermoelectric society, it is essential to have a suitable electronic structure, such as a narrow band gap, to obtain a large power factor. Since quasicrystals have complex crystal structures, the phonon thermal conductivity is less than 1 W/(m K) at room temperature, which is almost the theoretical minimum thermal conductivity. Therefore, to obtain a high-ZT quasicrystal material, the materials should possess a real gap rather than a pseudogap; that is, it should be a semiconductor quasicrystal. We are now furthering the search for semiconductor quasicrystal based on theoretical and experimental studies [Citation61].
Acknowledgement
The authors acknowledge the collaborators Prof. M Sakata at Nagoya University, Prof. M Takata at the RIKEN SPring-8 Center, Prof. E Nishibori at Tsukuba University, and Dr K Kirihara in our laboratory for MEM/Rietveld analysis. We also thank Dr K Kirihara, Dr T Nagata, Dr J T Okada, Dr S Hosoi, Mr T Hamamatsu, and Mr T Kamimura in our laboratory for sample preparation, thermoelectric properties measurement, and their analysis.
References
- ShechtmanDBlechIGratiasDCahnJ W 1984 Phys. Rev. Lett. 53 1951 1953 1951–3 10.1103/PhysRevLett.53.1951
- TakakuraHGomézC PYamamotoADe BoissieuMTsaiA P 2006 Nat. Mater. 6 58 63 58–63 10.1038/nmat1799
- KimuraKIwahashiHHashimotoTTakeuchiSMizutaniUOhashiSItohG 1989 J. Phys. Soc. Japan 58 2472 2481 2472–81 10.1143/JPSJ.58.2472
- AkiyamaHHondaYHashimotoTEdagawaKTakeuchiS 1993 Japan. J. Appl. Phys. 32 L1003 L1004 L1003–4 10.1143/JJAP.32.L1003
- ChernikovM ABianchiAOttH R 1995 Phys. Rev. B 51 153 158 153–8 10.1103/PhysRevB.51.153
- FisherI RCheonK OPanchulaA FCanfieldP CChernikovM AOttH RDennisK 1999 Phys. Rev. B 59 308 321 308–21 10.1103/PhysRevB.59.308
- TsaiA PInoueAMasumotoT 1987 Japan. J. Appl. Phys. 26 L1505 L1507 L1505–7 10.1143/JJAP.26.L1505
- KimuraKTakeuchiS 1999 Experimental studies of electronic transport in quasicrystals Quasicrystals: The State of the Art DiVincenzoDSteinhardtP J 2nd edn Singapore World Scientific 325
- Hume-RotheryW 1926 J. Inst. Met. 35 295
- JonesH 1937 Proc. Phys. Soc. London 49 250 10.1088/0959-5309/49/3/307
- TsaiA P 2004 J. Non-Cryst. Solids 334 & 335 317 10.1016/j.jnoncrysol.2003.11.065
- MizutaniU 2011 Hume-Rothery Rules for Structurally Complex Alloy Phases Boca Raton, FL CRC Press
- KiriharaKNagataTKimuraKKatoKTakataMNishiboriESakataM 2003 Phys. Rev. B 68 014205 10.1103/PhysRevB.68.014205
- IshiiYFujiwaraT 2008 Electronic structures and stability mechanism of quasicrystals Quasicrystals FujiwaraTIshiiY Amsterdam Elsevier 171
- KimuraKTakedaMFujimoriMTamuraRMatsudaHSchmechelRWerheitH 1997 J. Solid State Chem. 133 302 309 302–9 10.1006/jssc.1997.7491
- FujiwaraT 1989 Phys. Rev. B 40 942 946 942–6 10.1103/PhysRevB.40.942
- KrajčíMHafnerJ 2007 Phys. Rev. B 75 024116 10.1103/PhysRevB.75.024116
- KiriharaKKimuraK 2000 Sci. Technol. Adv. Mater. 1 227 236 227–36 10.1016/S1468-6996(00)00021-8
- SnyderG JTobererT 2008 Nat. Mater. 7 105 114 105–14 10.1038/nmat2090
- PopeA LTrittT MChernikovM AFeuerbacherM 1999 Appl. Phys. Lett. 75 1854 1856 1854–6 10.1063/1.124850
- KiriharaKKimuraK 2002 J. Appl. Phys. 92 979 986 979–86 10.1063/1.1486030
- MaciáE 2012 Crit. Rev. Solid State Mater. Sci. 37 215 242 215–42 10.1080/10408436.2012.703978
- TakeuchiTOtagiriTSakagamiHKondoTMizutaniUSatoH 2004 Phys. Rev. B 70 144202 10.1103/PhysRevB.70.144202
- TakeuchiTNagasakoNAsahiRMizutaniU 2006 Phys. Rev. B 74 054206 10.1103/PhysRevB.74.054206
- NagatochiTHyodoHSumiyoshiASogaKSatoYTerauchiMEsakaFKimuraK 2011 Phys. Rev. B 83 184507 10.1103/PhysRevB.83.184507
- TanabeKSogaKHosoiSOsumiKYamaguchiHUrugaTKimuraK 2011 J. Phys. Soc. Jpn. 80 024709 10.1143/JPSJ.80.024709
- KimuraKOkadaJ TKimHHamamatsuTNagataTKiriharaK 2006 MRS Proc. 886 0886-F06-10 10.1557/PROC-0886-F06-10
- SlackG A 1995 New materials and performance limits for thermoelectric cooling CRC Handbook of Thermoelectrics RoweD M Boca Ratio FL Chemical Rubber Company 407
- AvilaM ASuekuniKUmeoKFukuokaHYamanakaSTakabatakeT 2008 Appl. Phys. Lett. 92 041901 10.1063/1.2831926
- NolasaG SKaeserMLittletonR T IVTrittT M 2000 Appl. Phys. Lett. 77 1855 1857 1855–7 10.1063/1.1311597
- SakataMSatoM 1990 Acta Crystallogr. A 46 263 270 263–70 10.1107/S0108767389012377
- TakataMSakataM 1996 Acta Crystallogr. A 52 287 290 287–90 10.1107/S0108767395014917
- NishiboriESunaoshiEYoshidaAAoyagiSKatoKTakataMSakataM 2007 Acta Crystallogr. A 63 43 52 43–52 10.1107/S0108767306047210
- KiriharaKNakataTTakataMKubotaYNishiboriEKimuraKSakataM 2000 Phys. Rev. Lett. 85 3468 3471 3468–71 10.1103/PhysRevLett.85.3468
- KiriharaKNakataTTakataMKubotaYNishiboriEKimuraKSakataM 2000 Mater. Sci. Eng. A 294-296 492 495 492–5 10.1016/S0921-5093(00)01069-8
- FujimoriMKimuraK 1997 J. Solid State Chem. 133 310 313 310–13 10.1006/jssc.1997.7492
- ZijlstraE SBoseS K 2003 Phys. Rev. B 67 224204 10.1103/PhysRevB.67.224204
- FujimoriM 2000 Doctor thesis The University of Tokyo
- YamaguchiMOhishiYHosoiSSogaKKimuraK 2009 J. Phys.: Conf. Ser. 176 012027 10.1088/1742-6596/176/1/012027
- BaderR F W 1990 Chemical models and the Laplacian of the charge density Atoms in Molecules: A Quantum Theory New York Clarendon 248 351 248–351
- KouhoutM 2004 Int. J. Quantum Chem. 97 651 658 651–8 10.1002/(ISSN)1097-461X
- PendasA MKouhoutMBlancoM AFranciscoE 2012 Beyond standard charge density topological analyses Modern Charge-Density Analysis GattiCMacchiP Berlin Springer 303 358 303–58
- TakagiwaYKimuraK unpublished
- KiriharaKKimuraK 2001 Phys. Rev. B 64 212201 10.1103//PhysRevB.64.212201
- KrajčíMHafnerJ 2002 J. Phys.: Condens. Matter. 14 5755 5783 5755–83 10.1088/0953-8984/14/23/309
- TakagiwaYOkadaJ TKimuraK 2010 J. Alloys Compd. 507 364 369 364–9 10.1016/j.jallcom.2010.07.204
- ScheidemantelT JAmbrosch-DraxlCThonhauserTBaddingJ VSofoJ O 2003 Phys. Rev. B 68 125210 10.1103/PhysRevB.68.125210
- TakeuchiT 2009 J. Electron. Mater. 38 1354 1359 1354–9 10.1007/s11664-009-0662-1
- TakagiwaYKamimuraTHosoiSOkadaJ TKimuraK 2009 Z. Kristallogr. 224 79 83 79–83 10.1524/zkri.2009.1061
- TakagiwaYKimuraK unpublished
- NishinoYDeguchiSMizutaniU 2006 Phys. Rev. B 74 115115 10.1103/PhysRevB.74.214416
- ThielP 2007 Nat. Mater. 6 11 12 11–2 10.1038/nmat1814
- NagataTKiriharaKKimuraK 2003 J. Appl. Phys. 94 6560 6565 6560–5 10.1063/1.1611636
- OkadaJ THamamatsuTHosoiSNagataTKimuraKKiriharaK 2007 J. Appl. Phys. 101 103702 10.1063/1.2716212
- TakagiwaYKamimuraTOkadaJ TKimuraK 2010 J. Electron. Mater. 39 1885 1889 1885–9 10.1007/s11664-009-1065-z
- TakagiwaYKamimuraTHosoiSOkadaJ TKimuraK 2008 J. Appl. Phys. 104 073721 10.1063/1.2990772
- QuandtAElserV 2000 Phys. Rev. B 61 9336 9344 9336–44 10.1103/PhysRevB.61.9336
- ZijlstraE SBoseS KKlanjšekMJegličPDolinšekJ 2005 Phys. Rev. B 72 174206 10.1103/PhysRevB.72.174206
- ZijlstraE SBoseS KDolinšekJ 2005 Phys. Rev. B 72 0922031 0922034 0922031–4 10.1103/PhysRevB.72.174206
- TakagiwaYKamimuraTOkadaJ TKimuraK 2014 Mater. Trans.
- KitaharaKTakagiwaYKimuraK unpublished