Figures , and appear incorrectly in this paper. Please see below the corrected versions of these figures.
Figure 3. (A) Chronoamperometric curves and (B) the calibration plot for measurement of glucose in AU. The solid line in (B) represents a linear fit to experimental data with regression equation: y = 0.041x + 0.054 (R2 = 0.996, n = 5).
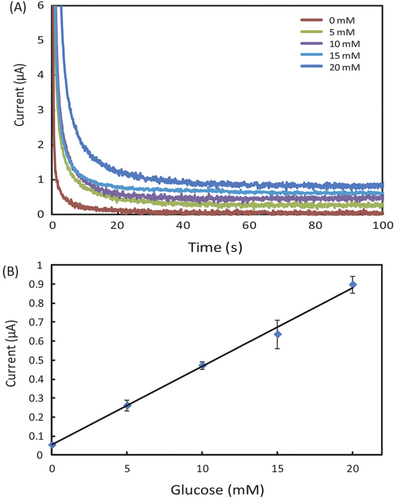
Figure 4. (A) Chronoamperometric curves and (B) the calibration plot for measurement of lactate in AU. The solid line in (B) represents a linear fit to experimental data with regression equation: y = 0.0076x + 0.025 (R2 = 0.995, n = 5).
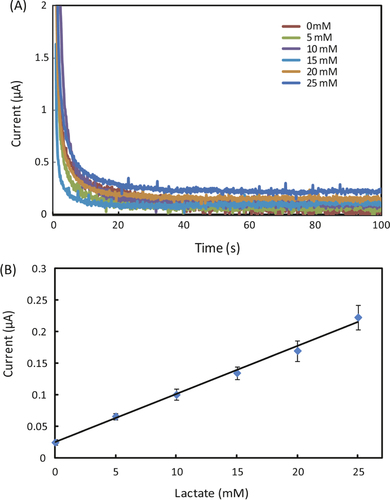
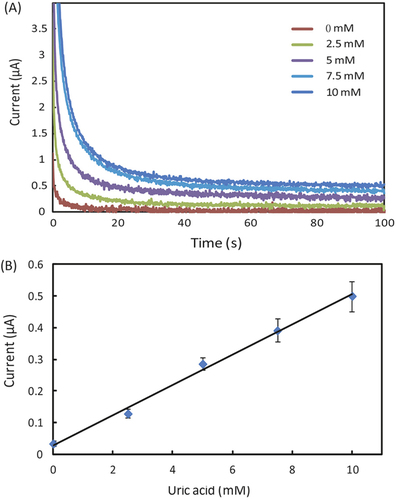
Figure 5. (A) Chronoamperometric curves and (B) the calibration plot for measurement of uric acid in AU. The solid line represents a linear fit to experimental data with regression equation: y = 0.048x + 0.029 (R2 = 0.994, n = 5).