Abstract
By using the concepts of the short-range order (SRO) and middle-range order (MRO) characterizing structures, an attempt has been made to describe the glass forming ability (GFA) of liquid alloys. This includes the effect of more than two kinds of SRO in the liquid caused by the addition of second and third elements to a metallic solvent. The minimum solute concentration is related to the atomic volume mismatch estimated from the cube of the atomic radius. The optimum solute concentration for good glass formability in several binary and some ternary alloys is discussed on the basis of the empirical guideline. A new approach to obtaining good GFA of liquid alloys is based on four main factors: (i) formation of new SRO and coexistence of two or more kinds of SRO, (ii) stabilization of dense random packing structure by restraining the atomic redistribution for initiating the nucleation and growth process, (iii) formation of a stable cluster (SC) or the MRO by the harmonious coupling of SROs, and (iv) difference between SRO characterizing the liquid structure and the near-neighbor environment in the corresponding equilibrium crystalline phases. The use of interaction parameters, widely used in the thermodynamics of multicomponent metallic solutions, is proposed for effectively selecting the third solute element (X3) for enhancing the GFA of a metallic liquid (M) containing the second solute (X2). Fe70-B20-(X3)10 alloys (X3=Cr, W, Nb, Zr and Hf) are used for illustration. Two typical model structures denoted by the Bernal and chemical-order types are used in describing the new glass structure as a function of solute concentration.
Introduction
Many attempts to produce different types of metallic glass have been reported following the pioneering work of Klement Jr et al in 1960 [Citation1] on glassy Au–Si alloys produced by rapid quenching from a melt. Numerous alloy systems have been found to form a glassy phase by direct melt processing techniques such as the chill block casting of ribbon and the free jet spinning of wire. The quenching rate is on the order of 106 K s−1. Glassy samples are generally obtained in the form of a ribbon with a thickness of 30 μm or a wire with a diameter of 100 μm. Furthermore, the addition of third elements that exhibit different properties, such as atomic size and crystalline symmetry, to a binary alloy markedly enhances the ease of glass formation. One of the reasons for this is the lowering of melting temperature. For example, the addition of Ge to a binary Au–Si alloy lowers the liquidus temperature by 10 K [Citation2–4]. The quenched Au–Ge–Si alloy manifests thermal glass–liquid transition in DSC scan at 10 K min−1. The glass transition temperature is ∼300 K with a supercooled liquid region of 13 K or a reduced supercooled range of 0.05, which is commonly observed for different types of bulk metallic glass. These observations provide the first confirmation of metallic glass and have contributed enormously in the development of different types of bulk metallic glass. Some exceptional systems such as Pd–Cu–Si, Pd–Ni–P and Pt–Ni–P have been found. These ternary alloys have been produced as cylindrical rods of 1–3 mm diameter in the glassy state at a quenching rate of only 102 K s−1 [Citation5, Citation6].
Inoue and coworkers [Citation7, Citation8] in 1990 discovered new ternary alloy systems of Zr–X–Y (X=Al, Y=Co, Ni, Cu) that require a quenching rate on the order of 102 K s−1 to produce the glass phase. These alloy systems show a wide supercooled liquid region of more than 100 K and contain no nonmetallic elements such as P and Si. Peker and Johnson [Citation9] independently reported a highly processable metallic glass made of Zr–Ti–Cu–Ni–Be alloys in 1993. These pioneering results marked the advent of second-generation metallic glasses, so called ‘bulk metallic glass’ or `bulk amorphous alloy’ [Citation10, Citation11]. Not only cylindrical rods of several millimeters diameter, but also pipes with an inner diameter of 10 mm and a wall thickness of 2 mm and ingots with diameter or thickness larger than several centimeters [Citation12, Citation13] have been recently fabricated with bulk metallic glass.
Inoue and his colleagues have found a large number of alloy systems, which produce glassy phases with a wide supercooled liquid region, based on the following three empirical guidelines [Citation13–15]:
use of a multicomponent system consisting of more than three elements, | |||||
significant difference in atomic size (above 12%) among the main constituent elements, and | |||||
negative enthalpy of mixing of their elements. | |||||
The purpose of this work is to describe the GFA of liquid alloys using the short-range order (hereafter referred to as SRO), characterizing the atomic scale structure of liquid alloys, and the effect of additives to the solvent. The basic premise is that a good GFA of liquid alloys can be achieved when the liquid phase is stabilized by enhancing the local structure ordering in the near-neighbor region and by restraining the progress of the nucleation and growth of crystallites starting from the embryo in the liquid phase. An attempt will be made to describe the effects of additive elements on the liquid structure using the following four main factors: (i) formation of new SRO and coexistence of two or more kinds of SRO, (ii) stabilization of dense random packing structure by restraining the atomic redistribution for initiating the nucleation and growth process, (iii) formation of a stable cluster (hereafter referred to as SC) or middle range order (hereafter referred to as MRO) by the harmonious coupling of SROs, and (iv) difference between SRO characterizing the liquid structure and the near-neighbor environment in the corresponding equilibrium crystalline phases that may precipitate under more normal conditions.
Note that the present idea can be applied to both metal–metalloid (for example, Pd–Si and Fe–B) and metal–metal (for example, Cu–Zr and Ni–Hf) combinations without any modification. In addition, the contribution of the third element to the GFA of liquid alloys is explained by interaction parameters widely used for the thermodynamic calculation of activity coefficients in multicomponent metallic solutions.
Brief background of crystallization of liquid alloys
Crystallization from liquid phase can be classified into ‘melt growth’ arising from supercooling and ‘solution growth’ due to supersaturation [Citation22]. The present work is concerned with melt growth and our target is phase transformation at the solid/liquid interface on decreasing temperature. A good GFA of liquid alloys of interest may be obtained when the conditions of ‘liquid phase stabilization’ induced by increasing the local structure ordering in the extended near-neighbor region and ‘restraint of crystallization in liquid phase’ by stopping the progress of the nucleation and growth of crystalline phases are satisfied.
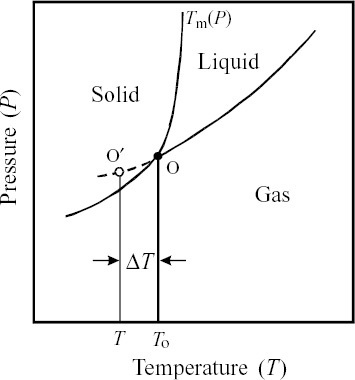
Many studies in the literature clearly indicate that no pure liquid metals have been quenched into a glass phase by applying rapid solidification methods. The admixture of metals to form binary alloys or the addition of third elements is required to induce relatively low-temperature eutectic reactions and good stability as well as ease of glass formation. At high temperatures, liquid alloys are in thermodynamic equilibrium with the corresponding vapor phase and triple point (see point O in figure corresponding to To) is reached by decreasing temperature. When the temperature is further decreased to T in the absence of suitable crystal nuclei, the liquid phase enters the supercooled state (see a point O′ in figure ), which is described by a smooth downward extrapolation of the liquid/gas boundary from the triple point. Such a liquid phase is not the most stable state of aggregation. However, the liquid structure is effectively frozen to form glass when suitable crystallization nuclei do not exist and develop. The degree of supercooling is given by ΔT=To−T. Since the variation in the melting temperature Tm of metals and alloys with pressure in the vicinity of atmospheric pressure is insignificant, the approximation ΔT=Tm−T is acceptable. In the region of ΔT the progress of nucleation and growth is restrained. The larger the ΔT, the more enhanced the ease of glass formation.
Figure 1 Schematic phase diagram of pure metal as function of pressure and temperature. Tm: melting temperature; O: triple point; T0: the temperature of triple point; O′: point reached by super-cooling; and ΔT: degree of supercooling.
Very small crystal embryos produced by fluctuations in the liquid easily dissolve in the liquid phase. For the progress of nucleation and growth, a crystal embryo should be larger than the critical size, which depends on the differences in bulk Gibbs energy between the solid and liquid phases and in interface energy [Citation23, Citation24]. More details on this subject are given in previous reports [Citation24–26]. Thus, a good GFA for liquid alloys is considered here by introducing factors that restrain the progress of nucleation and growth. One of these factors is experimentally established: the SRO characterizing the liquid structure differs from that in the corresponding equilibrium crystalline phases that can precipitate from the melt [Citation27].
General features of structure of metallic liquids
Atoms in crystals vibrate around fixed points in a regular three-dimensional lattice. Hence, several discrete peaks are seen in the x-ray scattering intensity pattern. All atomic positions in the crystalline state can be described by a few parameters such as distance and angle. However, such a simple depiction is not possible in noncrystalline systems such as liquids and different types of glass because of the lack of long-range structural periodicity. On melting, metals and alloys lose the characteristics of their crystal structure, and the measured x-ray scattering intensity pattern has a common feature consisting of a relatively sharp first peak followed by a few smaller peaks [Citation28]. The absolute intensity is very low but it is observed at all angles. The first peak height of the liquid (or glass) is about 10% relative to that in the crystal case. Since even in noncrystalline systems that lack long-range periodicity, if scattered beams from two atoms coherently interfere with each other, then scattering intensity results depending on the relative positions of the two atoms. This is the origin of x-ray scattering intensity pattern for liquids.
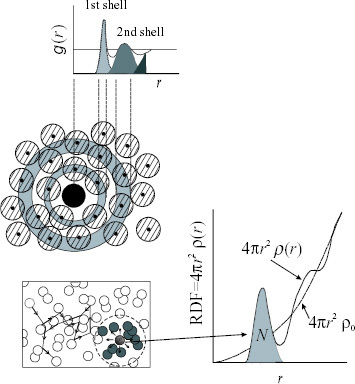
The atomic scale structure of liquids (or different types of glass) can only be quantitatively described in terms of the so-called radial distribution function (frequently referred to as RDF) indicating the average probability of finding another atom in a specified volume from an atom at the origin as a function of radial distance (see figure ). The RDF gives unique quantitative information for describing the structure without long-range periodicity. In a liquid system, RDF=4πr2ρ(r) can be defined by considering a spherical shell of radius r and thickness dr centered on the atom at the origin, where ρ(r) is the radial density function. As shown in the schematic diagram (figure ), RDF gradually approaches the parabolic function of 4πr2ρo at a larger r, where ρo is the average number density of atoms, because the positional atomic correlation disappears with increasing distance in the liquid. The area under the respective peaks in RDF yields the average coordination numbers of the liquid both over time and space. Note that the coordination numbers obtained for liquids clearly differ from those in the crystal case, where fixed coordination numbers can be defined, for example, 8 for the 1st, 6 for the 2nd and 12 for the 3rd-nearest neighbors in bcc.
Figure 2 Schematic diagram of radial distribution function for liquid and its atomic distribution. Dotted line shows the example of SRO in liquid.
The hard sphere solution of the Percus–Yevick equation moderately reproduces the fundamental profile of the measured x-ray scattering intensity of most liquid metals, as long as the packing density is appropriately selected[Citation29, Citation30]. The packing density is given by η=πρoσ3/6, where σ and ρo are the hard sphere diameter and average number density, respectively. The packing density of 0.45 is suggested for most liquid metals at temperatures close to the meting point [Citation28]. This implies that the structure of liquid metals can be simply expressed by the random distribution of hard spheres and that such a structural feature is predominated by the repulsive core part of the effective pair potential. In other words, a topological factor plays an important role in the atomic scale structure of liquid metals.
The SRO detected in the random distribution of hard spheres provides average coordination numbers between 10 and 12. This is not far from those (8 for bcc or 12 for fcc type crystal structure) expected from the atomic distribution in the nearest-neighbor region. However, we should not discuss the direct relevance of the SRO found in liquid metals to the crystal case. This is based on the fact that the ratio (r2/r1) of the position of the first peak (r1) to that of the second peak (r2) is nearly constant at 1.90 for most liquid metals, whereas the ratio (r2/r1) should differ, depending on the crystal structure. [Citation28].
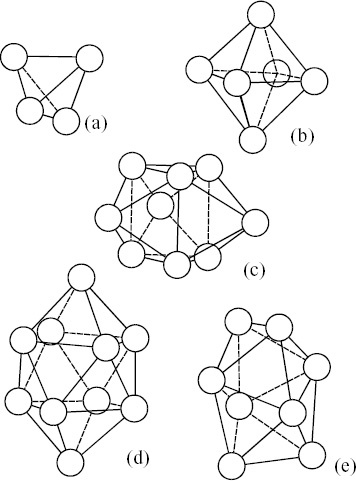
According to the pioneering works of Bernal [Citation31, Citation32] and Finny [Citation33] on the liquid structure described by the hard sphere model with a random distribution, one can readily find some particular polyhedra formed by packing equal spheres or cluster consisting of tetrahedral units as a local atomic configuration (corresponding to SRO). These topological SRO (frequently referred to as TSRO) are shown in figure [Citation34, Citation35]. These particular TSROs also frequently appear in the structure of ultrafine particles. The tetrahedron in figure (a) and the octahedron in figure (b) are the main components of crystalline structures classified as fcc and hcp. The triangular prism capped with three half-octahedra in figure (c), the Archimedian anti-prisms capped with two half-octahedra in figure (d), and the tetragonal dodecahedron in figure (e) are not normally detected in the crystal structure of pure metals. However, two polyhedra of figures (c) and (d) are suggested to show a close relation with the local atomic distributions found in some binary compounds such as Fe3C and Pd3Si. Some noncrystallographic unit structures such as 13-atom icosahedra and 55-atom Mackay icosahedral clusters have also been used for explaining the characteristic structure of liquid and glass [Citation36]. This implies that some particular local orderings as well as conventional SROs are quite likely to exist in the liquid and glassy states of metals and alloys.
Figure 3 Five polyhedra formed by packing equal spheres found in model structure for liquid by Bernal [Citation27–29]: (a) tetrahedron, (b) octahedron, (c) triangular prism capped with three half-octahedra, (d) Archimedian anti-prisms capped with two half-octahedra, and (e) tetragonal dodecahedron.
In a system containing more than two kinds of component, the liquid structure becomes more complicated. However, when we introduce compositionally averaged functions, an approach similar to that for the simple one-component liquid systems is found to be applicable to liquid alloys without any significant modification, although there are differences in detail [Citation28]. Note that the hard-sphere mixture model well reproduces the fundamental profile of the measured x-ray scattering intensities of most liquid binary alloys [Citation37]. This implies that the essential features of liquid alloy structures can again be described by the random distribution of hard spheres with different sizes. Nevertheless, we should consider the chemical SRO (frequently referred to as CSRO) in discussing the structure of liquid alloys if needed, because the surroundings of each atom in liquid alloys generally differ from those of other atoms [Citation38].
Some selected features of structure of liquid alloys with good GFA
The growing scientific and technological curiosity about different types of bulk metallic glass has stimulated many studies of the structure of these materials using x-ray and neutron diffraction methods. This includes structural changes in different types of metallic glass induced by annealing under various conditions. However, structural information on liquid alloys showing good GFA is available for only a few compositions. This is mainly because of experimental difficulties arising from the chemical reactivity of liquid samples with container materials at higher temperatures. Here, the results of Pd40Ni10Cu30P20 alloy, which produces a glass ingot as large as 72 mm in diameter [Citation12], in both liquid and glassy states are given together with those of Pd40Ni40P20 alloys as [Citation39]. Note that this work enables us to provide environmental RDF around a specific element, as well as average RDF data using an anomalous x-ray scattering (AXS) method [Citation38] for the following reason. Since the Pd40Ni10Cu30P20 alloy contains four elements, measured structural data contains ten possible atomic pairs: Pd–Pd, Pd–Ni, Pd–Cu, Pd–P, Ni–Ni, Ni–Cu, Ni–P, Cu–Cu, Cu–P and P–P. Ni–Ni, Ni–P, Cu–P and P–P can be ignored in the interpretation of RDFs because the atomic fraction of Ni is much less than those of the other three elements (Pd, Cu and P) and the scattering factor of P is considerably less than those of the metallic elements (Pd, Ni and Cu). In spite of this assumption, the remaining six partial structures still overlap in ordinary RDF. However, the environmental RDF around Cu obtained by the AXS method contains information on only four partials of Cu–Pd, Cu–Cu, Cu–Ni, and Cu–P. Similarly, the environmental RDF around Ni consists of four partials of Ni–Ni, Ni–Pd, Ni–Cu and Ni–P.
The solid lines in figure (a) show the RDFs of liquid alloys of Pd40Ni40P20 and Pd40Ni10Cu30P20, respectively. Figure (b) shows the RDFs of these alloys in the glassy state for comparison. Note that the vertical scale in environmental RDF differs from that in average RDF owing to the difference in weighting factors. There are two common features: (i) general profiles of the glass structure appear to be the same as those of the liquid state, although a characteristic shoulder or the separation of the second peak is usually detected in various glassy alloys including metalloid elements, becomes obscure after melting, and (ii) a small hump between the first and second peaks in the environmental RDF around Cu in the Pd40Ni10Cu30P20 alloy are clearly observed at r=0.36 nm (see arrow in figure ) in both liquid and glassy states. No such small hump is detected in environmental RDF for Ni, as well as in average RDF for Pd40Ni10Cu30P20 alloy.
Figure 4 Average RDF and environmental RDFs for Cu and Ni of Pd40Ni10Cu30P20 alloy in liquid (a) and glassy (b) states. Dotted lines show the results calculated using the nonlinear least-squares fitting method so as to reproduce the experimental data using a model structure formed by eight Pd atoms around Cu [Citation33].
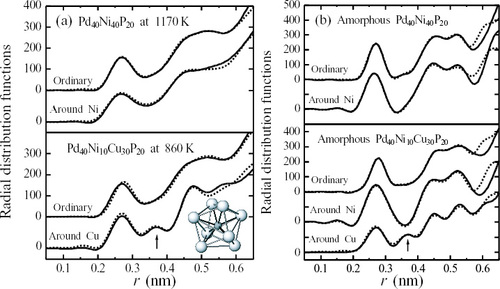
The difference in RDF between the liquid and glassy states can be attributed to the structural inhomogeneity in a given state. Nevertheless, the present authors maintain the view that the local ordering in the structure of the Pd40Ni10Cu30P20 alloy in both liquid and glassy states deviates from that of the Pd40Ni40P20 alloy, when substituting Ni with Cu.
The nonlinear least-squares fitting method is frequently used for refining the local ordering structure in noncrystalline systems, so as to reproduce the average and environmental structural functions simultaneously [Citation38] by coupling with a model structure as the input. The dotted lines in figure represent the results of calculation. In this calculation, a model structure of the tetragonal dodecahedron (see figure (e)) formed by eight metal atoms around a P atom was used and equal probabilities for the Pd, Ni and Cu atoms occupying vertices in these polyhedra were also assumed. In this tetragonal dodecahedron model structure (see insert of figure ), the distance of metal atoms around Cu is found close to 0.37 nm. This reproduces well the small hump at r=0.36 nm observed in both liquid and glassy states of the Pd40Ni10Cu30P20 alloy. Such particular local ordering structure around a specific element is cited for other alloys systems. A few selected examples are given below.
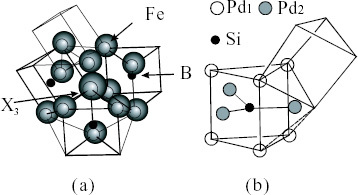
An x-ray scattering study of different types of Fe70-B20-(X3)10 alloy glass (X3=Cr, W, Nb, Zr and Hf) has been systematically performed [Citation40] with respect to one of the thermal stability factors defined by the temperature span (ΔTX), which is the difference between the crystallization and glass transition temperatures. ΔTX shows a decreasing order as follows: 89 K for Hf>87 K for Zr>53 K for Nb>41 K for W>0 K for Cr. These types of metallic glass show three common features in terms of their local ordering. (i) The local structural unit is a trigonal prism consisting of one B atom at the center and six Fe atoms at the vertices in all types of alloy glass and is independent of X3. (ii) Most of the trigonal prisms in the different types of Fe70-B20-(X3)10 (X3=W, Nb, Zr and Hf) alloy glass are connected by sharing their edges, as shown in figure (a), and the local structural unit changes to a slightly distorted trigonal prism because of the replacement of Fe at the vertices by a larger atomic-sized X3. The more pronounced the distortion of the prism, the more thermally stable the glass structure becomes. (iii) The trigonal prisms in the less stable Fe70B20Cr10 alloy are connected by both edge sharing and vertex sharing. The results suggest the formation of a particular local order leading to SC or MRO by the harmonious coupling between more than two kinds of SROs in these ternary alloys.
Figure 5 Local orderings consisting of trigonal prisms including M proposed for Fe70-B20-(X3)10 (X3=Hf, Zr, Nb, W and Cr) glassy alloys (a) [Citation34], and Pd80Si20 glassy alloy (b) [Citation36]. The distances between Si and Pd1 and Si and Pd2 are 0.24 nm and 0.28 nm, respectively.
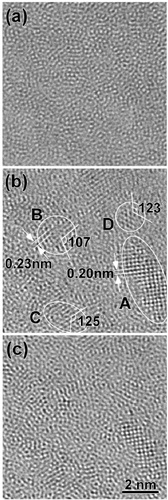
Recently, Hirotsu et al [Citation41] reported the results of the through-focus imaging of local structures of Pd40Ni40P20 alloy glass by spherical-aberration-corrected high-resolution TEM. The spherical aberration constant of the objective lens was Cs=2 μm. Images taken at underfocus values Δf=1, 5 and 9 nm are shown in figures (a)–(c), respectively. For comparison, typical high-resolution images obtained by the conventional TEM are normally taken at Cs=0.6 mm and Δf∼60 nm. A distribution of local crystalline-like atomic clusters is shown in figure (b). In (a), in the same region, no such cluster contrasts are observed. In (c), the same clusters seen in (b) lose cluster contrast owing to a higher background image noise. A clear imaging of such local crystalline-like clusters (region of the middle-range order) embedded in a glassy structure can be realized by taking advantage of the Cs-corrected TEM by choosing appropriate Cs and Δf values. In figure (b), images in clusters A and B are identified as [100]- and [110]-oriented fcc-Pd type clusters (including Ni and P). The clusters C and D have lattice fringes with fringe spacing similar to those of fcc-Pd, but with cross-angles of ∼125°, quite different from those expected from fcc-Pd. Close examination revealed that the cluster images are those of Ni2P. From the direct local structure observation study, Hirotsu et al [Citation41] concluded that ‘nano-scale phase separation’ with the formation of fcc-Pd(Ni,P) and phosphide nanophases occurs while cooling the Pd–Ni–P melt.
Figure 6 High-resolution images of local structures for the Pd40Ni40P20 glassy alloy taken from results obtained by spherical-aberration(Cs)-corrected high-resolution TEM. The spherical aberration constant of the objective lens was Cs=2 μm. Images are taken at underfocus Δf=1 nm (a), 5 nm (b) and 9 nm (c) [Citation35].
Such particular local ordering has also been suggested for different types of binary metallic glass. For example, for Pd80Si20 alloy glass, Gaskell [Citation42] reported in 1979 that the local order shown in figure (b) could reproduce well-measured x-ray and neutron scattering intensity profiles. In this case, the particular local ordering is based on a trigonal prism consisting of one Si atom at the center and six Pd atoms at the vertices with an edge-sharing arrangement. A slight distortion is allowed for model construction [Citation42]. Note that such local ordering can be found in the precipitated metastable phases with a relatively large lattice parameter when these types of alloy glass are annealed, for example, Fe23B6 (a=1.074 nm [Citation43]), Pd15P2 (a=0.711 nm, c=1.709 nm [Citation44]) and Zr2Ni (a=1.227 nm [Citation45]). In the Zr2Ni case, an icosahedral cluster consisting of Zr and Ni is suggested.
All the above results strongly suggest the formation of particular local-ordering structures leading to SC or MRO by coupling in harmony with more than two kinds of SRO in multicomponent liquid alloys.
New approach to achieving glass formability of liquid alloys
The structure of a host metallic liquid (solvent) denoted M is described by the dense random packing (referred to as DRP) of hard spheres of M. In such a solvent liquid structure, one can easily find SRO (referred to as SRO0) consisting of about 10–12 atoms at a distance of the nearest neighbors from the atom at the origin (see figure ). The formation and dissolution of SRO0 itself are repeated because of pronounced atomic vibration in liquid, but it can be defined in the spherical shell at the nearest-neighbor distance when averaging over time and space. In other words, the solvent liquid structure and the atomic distributions of M characterized by both SRO0 and DRP structures are the starting point for further consideration. Also, note that the SRO characterizing the liquid structure differs from those in the corresponding equilibrium crystalline phases that usually precipitate in many alloy cases showing a good GFA [Citation27].
Effect of adding the second element X2 to host metallic liquid M
Let us consider the case of adding the second element X2 with a considerably smaller atomic size than the metallic solvent M. The addition of Si to Pd or B to Fe is included in this category. In this case, the basic structural profile given by the DRP of the host metallic element M (for example, Pd or Fe) is unchanged and the additive element (X2=Si or B) is quite likely to initially occupy the relatively large holes or vacant space present in the DRP structure. Namely, some ‘defects’ in DRP are filled by X2, to be surrounded by M atoms leading to the formation of a new SRO (referred to as SRO2). This also produces a distorted environmental atomic configuration around X2 because of the atomic size difference [Citation46]. These variations contribute to stabilizing the DRP structure of liquid alloys by restraining the atomic redistribution for initiating nucleation and growth processes [Citation47]. This may be true in comparison with the liquid phase consisting of M alone, because X2 is usually selected for strong atomic interactions with M (negative enthalpy of mixing) for easy glass formation.
Polk [Citation34] proposed a simple model with modification by locating all solute metalloid elements of X2 in three holes (given in figures (c)–(e)) inherent in the somewhat expanded DRP structure formed by large host metallic elements. Under this condition, the metalloid elements are surrounded by metallic elements and are never in direct contact with each other. The simplicity of the Polk model is attractive and a good GFA alloy is predicted to be possible at a metalloid concentration of about X2=20 at%, which fits to the experimental results. However, in principle, the large holes inherent in the DRP structure are too few (only 8% of all probabilities of finding the five typical Bernal polyhedra) to accommodate all the added metalloid elements without drastic structural change. This is particularly true from the experimental RDF results that the root mean square displacement of the peak position of a metal-metalloid pair is on the order of 0.01 nm; however, a relatively large variation of 0.05 nm is desired in the Polk model [Citation28].
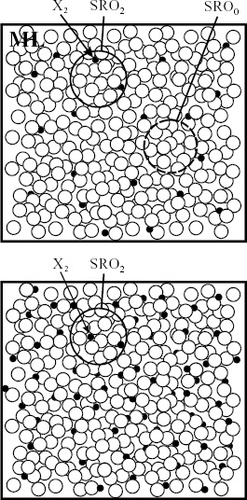
For convenience of discussion, figure shows a schematic of liquid alloys when a small amount of the second element X2 is added to the metallic solvent M and SRO0 coexists with SRO2 in the M–X2 liquid alloy. Since the number of SRO2 depends on the concentration of X2, no glass formation is attained in dilute alloys, as shown in figure (a). When the concentration of the second element X2 is increased, however, many SRO2 are produced while expelling SRO0 from the alloy liquid structure. Such a DRP structure characterized mainly by SRO2, as shown in figure (b), could be sufficiently stabilized and a good GFA is attained. In other words, the minimum solute concentration CX2m necessary to form glass should provide sufficient stabilization of the liquid phase as well as restrain the nucleation and growth of crystallites. This aspect will be discussed in the following section.
Figure 7 Model I for liquid alloys when second element (X2) is added to metallic solvent (M). (a) Image of coexistence of SRO0 and SRO2 in dilute region of X2 and (b) image for liquid structure characterized mainly by SRO2 with increasing X2 concentration. ML: mean liquid structure of solvent M.
Let us consider a metallic binary alloy formed, for example, by the addition of X2=Cu or Ni to M=Zr or Hf. In this case, the basic structural profile is given by the DRP of the host metallic element M with X2. The local ordering at the nearest-neighbor distance slightly changes from the DRP of M alone because of the substitution of X2 for M at random. The local ordering may be given by the deformed polyhedra in figure . Such a situation also leads to the formation of a new SRO consisting of M and X2 (referred to as SRO2). The liquid-phase disorder in the atomic distribution associated with this alloying substitution improves its stability and the ease of glass formation. The nucleation and growth of crystallites may also be restrained by SRO2 in the M–X2 liquid alloy, because X2 that shows strong atomic interactions with M is usually selected for easy glass formation. This may be true when compared with the liquid phase consisting of M alone.
Minimum concentration  of second element X2 required for glass formation
The structural similarity of liquid alloys to their glassy alloys has been frequently suggested and it is possibly characterized by only a size factor similar to the hard sphere model. This may not be far from a suitable solution in describing the structure of different types of metallic glass whose basic structural profiles are close to the DRP of hard spheres with some vacancy-like defects. The solute addition could stabilize the DRP structure of the host metallic constituent by allowing an appropriate distorted environmental atomic distribution with SRO, such a structural feature is primarily induced by the atomic size difference between the constituent elements. The minimum solute concentration required to form glass in this concept could be attributed to the atomic size of the constituent elements.
The minimum solute concentration for the GFA of liquid alloys may be described in terms of the atomic size difference using the following equations involving the cube of the atomic radius of the constituent elements [Citation48].
(1)
(2)
Here, CX2m is the minimum concentration of X2 necessary to obtain glass by rapid quenching from the melt. rX2 and rM are the atomic radii of the second element X2 and the host metal M, respectively. We employ the volume mismatch given by equation (2). The absolute value of |ΔVMX2/VM| may be a suitable indicator of the atomic size difference between the constituent elements. Table 1 shows some numerical examples of |ΔVMX2/VM| and λ for binary alloys [Citation48, Citation49]. Also note that the cube of the atomic radius has the dimensions of atomic volume, but it is not the same as the atomic volume estimated from the density and atomic mass. The estimation of |ΔVMX2/VM| and the atomic size difference factor λ was made for 80 binary systems in which a glass phase was produced [Citation48]. The results are summarized as follows.
A smaller (CX2m) is found in alloys with a large volume mismatch of ΔVMX2/VM, and vice versa. | |||||
λ is 0.10 with a standard deviation of σ=0.02 for 74 systems, except six [Citation48]. | |||||
Some numerical examples of volume mismatch ΔVMX2/VM, minimum concentration CX2m and atomic size difference factor λ for binary alloys [Citation42, Citation43].
The second observation is noteworthy. The effect of the second element on GFA depends not only on the atomic size difference but also on concentration. The simple relation λ=0.10 obtained from many experimental studies clearly covers both metal–metalloid and metal–metal alloys. It is also very interesting to find that this simple relation holds well when the glass formation is reported at both ends of a binary alloy, as exemplified by the results of the nine cases shown in table 2.
Atomic size difference factor of λ for nine binary alloys at both ends of phase diagram [Citation42, Citation43].
From the results, it appears that the atomic size difference primarily contributes to the GFA of liquid alloys so as to stabilize the DRP structure with some defects by alloying. As far as the data shown in tables 1 and 2 are concerned, the chemical interaction between M and X2 appears to have only a secondary effect on the GFA. Nevertheless, the chemical interactions are important in liquid and glassy alloys. The nearly constant λ=0.10 may be compared with the ratio (0.108) of the volume of structural defects (primarily due to the local density fluctuation in the glassy state) to the total volume estimated in the model system by computer simulation for different types of iron-based glass [Citation46]. However, the physical significance of this interestingly simple relation cannot be accurately identified at the present time. In addition, this phenomenological result provides only a necessary condition; it is not the sufficient condition for the GFA of liquid alloys. Nevertheless, one could avoid wasteful experimentation with alloys that do not satisfy the relation.
Effect by adding third element X3 to metallic liquid M containing X2
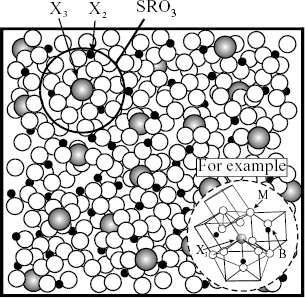
When the third element X3 is added to the binary M–X2 liquid alloy, the formation of SRO3 arising from the interaction of M and X3 is expected, so that the liquid structure is characterized by the coexistence of SRO0, SRO2 and SRO3. This may further enhance the ease of glass formation, compared with that in the two cases of liquid with SRO0 alone or liquid with SRO0 and SRO2. However, the present authors maintain the view that a more important role of the third element is to provide a linkage to more than two kinds of SRO, as shown in figure . Namely, there is a high probability of forming a stable SRO that may be designated SC or MRO, hereafter referred to as SRO3, by the harmonious coupling with more than two kinds of SRO around the third element X3. In other words, the effect of the third element X3 on the liquid structure of M containing X2 can be described by the strong interaction with more than two kinds of SRO, which is comparable to the formation of a new stable SRO. The atomic distribution associated with the formation of a new stable SRO (SRO3, SC or MRO) in the liquid phase considerably improves the stability of the DRP structure of liquid alloys. The nucleation and growth process may also be restrained by increasing the energy requirement for atomic redistribution involving a stable SRO (SRO3). Then, the ease of glass formation is achieved. This is consistent with the fact that both X2 and X3 are usually selected to show strong atomic interactions with M for easy glass forming alloy combination. For convenience of discussion, figure shows a schematic of liquid alloys when a small amount of the third element X3 is added to the metallic solvent M with X2. This corresponds to the image of the formation of a stable SRO (SRO3, SC or MRO) by the harmonious coupling with more than two kinds of SRO. This is also consistent with the TEM results of Hirotsu et al [Citation41] for the Pd40Ni40P20 alloy glass shown in figure .
Figure 8 Model II for liquid alloys when small amount of third element (X3) is added to metallic solvent (M) containing X2. Image of formation of stable cluster (SC) or (MRO, SRO3) by harmonious coupling in harmony with more than two kinds of SRO.
Since topological factors such as the atomic size difference primarily contribute to the GFA of liquid alloys, it is interesting to note that the empirical relation found for binary liquid alloys also gives an optimum criterion for the GFA of ternary liquid alloys [Citation49]. The minimum solute concentration CX2m of the second element X2 to obtain a glassy phase may be described for liquid alloys at a constant CX3 for the third element X3 by the following equation, along the line similar to that in the binary case.
(3)
(4)
The atomic radius of the third element X3 is denoted by rX3. Although systematic experimental studies of the GFA in ternary systems are very limited, rather interesting results have been obtained. λ′ was estimated using equation (3) from available data on the GFAs of Fe-B-X3, Fe-P-X3 and Co-B-X3 ternary liquid alloys, where X3 is either a metal or a metalloid element such as Nb, Mo, Si and C. The results for 27 cases are listed in table 3 [Citation49, Citation50]. Note that these experimental results provide the minimum concentration of boron or phosphorus (the second element) at a constant CX3 for the third element X3. The empirical relation λ′=0.10 is again found to hold well for the ternary alloys. This means that the topological factor primarily contributes to the GFA of liquid alloys so as to stabilize the DRP structure with some defects due to the atomic size difference in harmony among the three elements. In other words, the minimum solute concentration of the second element, CX2m, required for a glassy phase can be obtained from the following empirical relation where λ′=0.10 is assumed.
(5)
Such trial estimation is exemplified using the results of the Fe–Si–B ternary alloys. For the alloy containing 5 at.% Si, the minimum boron concentration necessary to form a glassy phase is 11 at.%, and for the alloy containing 10 at.% Si, it is 7.5 at.% [Citation51]. Equation (5) predicts the corresponding boron concentrations of 9.7 at.% for the 5 at.% Si alloy and 6.5 at.% for the 10 at.% Si alloy. The agreement between the experimental and calculation results is fairly good considering the phenomenology. Equation (3) is given under the assumption that the effects of both X2 and X3 on the atomic size difference factor are simply additive and their mutual interactions are negligible. This is valid only when X2 and X3 are both in the dilute range. Also note that equation (3) provides no direct relation to the effect of the third element X3 on the liquid structure of M containing X2 leading to the formation of a new stable SRO. For this purpose, other sensitive parameters to explain the effect of 1 or 2% X3 addition to the binary M–X2 liquid alloys on the GFA are strongly required. Possible candidates are the lowering in melting temperature [Citation52] and the increase in the temperature coefficient of viscosity near the glass transition temperature [Citation53] as a function of X3 concentration.
Minimum concentration of boron CBm or phosphorus CPm (second element X2) at constant CX3 for third element X3 and atomic size difference factor λ′ for some ternary alloys, namely, Fe-BX-(X3)10, Fe-PX-(X3)10 and Co-BX-(X3)10 [Citation43].
Effective selection of third element X3 for glass formation
The thermodynamic behavior of the solute X in the metallic solvent M is described by the nature and magnitude of the interaction between the solvent and the solute (M–X2). When a third element (a second solute) X3 is added to the liquid alloy M–X2, its thermodynamic behavior is characterized by the relative magnitude of three types of interaction, M–X2, M–X3 and X2–X3. The interaction parameter, which gives the effect of the alloying element on the activity coefficient of a solute in a dilute solution, is one way of explaining such interaction effectively [Citation54]. The interaction parameter denoted by εX2X3 provides information on ‘how the activity coefficient of X2 in the metallic solvent is affected by the presence of X3’. For convenience, figure shows the schematic diagram of the activity of boron in binary Fe-B liquid alloys as a function of boron concentration and its variation when a third element such as Si or Cr is added. Note that in this case the solvent is Fe, X2=B and X3=Si or Cr. The positive εX2X3 (εBSi in figure ) suggests an apparent increase in boron activity caused by the presence of Si, resulting in a decrease in boron solubility in liquid Fe. In other words, the activity of boron at the concentration marked A in the binary Fe-B liquid alloy (see figure ) is the same as that in the ternary Fe-B-Si liquid alloy at the lower boron concentration marked A′. This indicates that the relatively low X2 concentration necessary to satisfy a desired condition (in order to keep the same boron activity in the figure case) could be achieved by adding X3 associated with a positive εX2X3. The reverse correlation is given by adding X3 with a negative εX2X3 (for example, Cr in figure ). Many reports have been published on the determination and systematization of interaction parameters in ferrous liquid alloys because of their importance in the physical chemistry of steel manufacture. These measurements have been assessed and compiled [Citation54, Citation55].
Figure 9 Schematic diagram illustrating use of interaction parameter εX2X3 (solvent: Fe, solute X2: B and solute X3: Si or Cr).
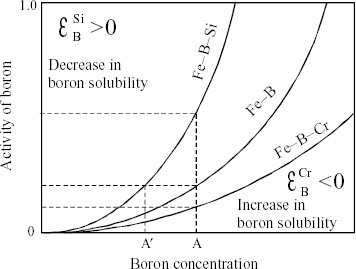
Here, the use of the interaction parameters is proposed for effectively selecting the third element X3 for glass formation of the metallic liquid M containing X2 with the results of Fe70-B20-(X3)10 alloys (X3=Cr, W, Nb, Zr and Hf) as examples. The values of the interaction parameter εBX3 denoting the effect of the third element on the activity coefficient of boron in liquid iron (solvent) are −14.0 for Hf, −13.0 for Zr, −6.6 for Nb, −0.89 for W and −1.3 for Cr [Citation56]. All elements show negative values of εBX3, suggesting an apparent decrease in boron activity caused by the presence of X3 resulting in an increase in boron solubility in liquid Fe. For example, the increase in boron solubility is expected to be on the order of 0.5 mass.% with the addition of 1 mass.% Zr. Consequently, the effect of adding the third element on the GFA of these ternary liquid alloys may be explained by a simple relation, proportional to the magnitude of εBX3. The values of ΔTX for this alloy series are in the following order, 89 K for Hf>87 K for Zr>53 K for Nb>41 K for W>0 K for Cr. The temperature span of ΔTX is defined by the difference between the crystallization and glass transition temperatures. There is a good correlation between εBX3 and ΔTX, except for W. Note that the values of εBX3 in liquid iron are −7.0 for Ta and −9.8 for La. Hence, Ta and La should be effective for improving GFA, similarly to Hf or Zr, whereas Cu (εBX3=+3.7) and Zn (εBX3=+7.8) may not be effective. However, note that the present approach using the interaction parameter for explaining the effect of the third element to the GFA of ternary liquid alloys is effective, in principle, only for alloys in the dilute region of both X2 and X3. Nevertheless, the present authors maintain the view that experimental economy can be achieved using this criterion as a first approximation.
Compositional effect of solutes on liquid structure: two model structures
By adding the second element X to the metallic solvent M, the formation of a new SRO denoted by SRO2 is likely in both metal–metalloid and metal–metal combinations; this produces a distorted atomic distribution including X at the microscopic level mainly owing to the atomic size difference. Such a variation contributes to stabilizing the DRP structure with some defects frequently quoted in metallic liquids [Citation28, Citation46]. When the X concentration increases beyond the minimum solute concentration CXm so that certain numbers of SRO2 coexist with SRO0, sufficient stability is attained and glass formation starts with the satisfaction of the good harmony of DRP with some defects in liquid alloys. It is also quite natural in the relatively dilute region that the additive element is surrounded by host metallic elements. Such local ordering in liquid alloys corresponds to the idea originally proposed by Polk [Citation34] and may be classified into the ‘Bernal type’ [Citation57]. In other words, Bernal type glass can be characterized mainly by the DRP structure of the constituent elements with some vacancy-like defects fully stabilized. This condition contributes to stabilizing the DRP structure of liquid alloys by restraining the atomic redistribution for initiating the nucleation and growth process. The local ordering units found in Bernal type glass often result in intermetallics M3(X2) and M2(X2), which participate in relatively low melting eutectic reactions. From the GFAs of various ternary alloys [Citation6–11], the addition of the third element X3 to liquid alloys containing X2 is found to markedly enhance both the stability and ease of glass formation. However, when the basic feature of the atomic scale structure can be described by the DRP structure of the constituent elements, the glass may be classified as of the ‘Bernal type’.
Another type of structure should be considered when the formation of a stable cluster (SC) or MRO is clearly detected and such a new ordering plays an important role in describing the basic feature of atomic scale structures. Alloys with a well-defined local ordering presumably caused by the strong chemical bonding between the host metal and solute elements are cases in point. Fe70-B20-(X3)10 alloys are included in this category, because the formation of a particular local ordering unit structure by the harmonious coupling between more than two kinds of SROs (see figure (a)) is indicated by the x-ray scattering data. This type of liquid structure may be classified as of the ‘chemical order type’ [Citation57], and corresponds to the ‘stereochemically defined model’ proposed by Gaskell [Citation42]. One of the hallmarks of the chemical order type is having the essential features of the structure using well-defined local orderings. A relatively higher concentration of the solute elements is usually required to form sufficient numbers of such local ordering units. This is consistent with Inoue's report [Citation16, Citation17] that a concentration of solute elements of more than 25 at.% is needed to obtain a glass phase in multicomponent alloy systems. The introduction of the concept of the two typical model structures is also one way of giving a simple image of liquid or glassy alloys for differentiating one from another using a few essential features of the atomic-scale structure. Note that the tendency towards chemical order also exists in the dilute region of solute elements, but no such nature is self-evident. Conversely, the Bernal type features are also shown by concentrated liquid alloys exhibiting SC or MRO, but this feature is constrained. The following comments from the thermodynamic point of view are qualitative but helpful for our understanding of the GFA of liquid alloys.
Let us consider the excess Gibbs energy of the crystal embryo and the noncrystalline cluster in a liquid with a DRP structure. The crystalline embryo as well as the noncrystalline cluster may appear in liquid alloys and these two kinds of ordering are compatible with the TEM observation for Pd40Ni40P20 shown in figure [Citation41]. In addition, such a polycluster concept of amorphous solids is frequently employed [Citation58, Citation59]. Here, the term noncrystalline means that the mutual atomic location in the embryo shows no symmetry, which is consistent with translational invariance. Also note, for example, that crystal embryo may not come mainly from SRO2 in the liquid M-X2, (see figure ) since there is a difference between the SROs characterizing the liquid structure and the near-neighbor environment in the corresponding equilibrium crystalline phases. On the other hand, SRO2 comes with the addition of only X2 to the liquid M and SRO3 comes only with further addition of X3 to the liquid M-X2.
The excess Gibbs energy of the crystal embryo, ΔGce, is defined by the relation ΔGce=Gce−Gl with respect to the reference state of the matrix liquid, Gl. The excess Gibbs energy of the noncrystalline cluster, ΔGSRO, is similarly described by ΔGSRO=GSRO−Gl. Both ΔGce and ΔGSRO have contributions from both the volume and surface of the crystal embryo or the noncrystalline cluster. At a temperature below the melting point or crystallization temperature, the volume term becomes increasingly negative with increasing degree of super-cooling ΔT, and the surface term is positive. ΔGce and ΔGSRO increase initially with the number of atoms in the embryo (Nce) or cluster (NSRO), reach a maximum at a critical size and then decrease, as in homogeneous nucleation [Citation22, Citation58, Citation59]. The size factor may be expressed by the sphere radius of the crystal embryo or noncrystalline cluster. The relative positions of ΔGce and ΔGSRO as functions of Nce or NSRO are illustrated in figure .
Figure 10 Schematic diagram of relative relationships for excess free energies of crystal embryo, ΔGce, and noncrystalline cluster, ΔGSRO, in liquid with respect to reference state of matrix liquid. (a) Non-glass-forming alloys, (b) alloys with X2 showing GFA and (c) alloys with X2 and X3 showing good GFA.
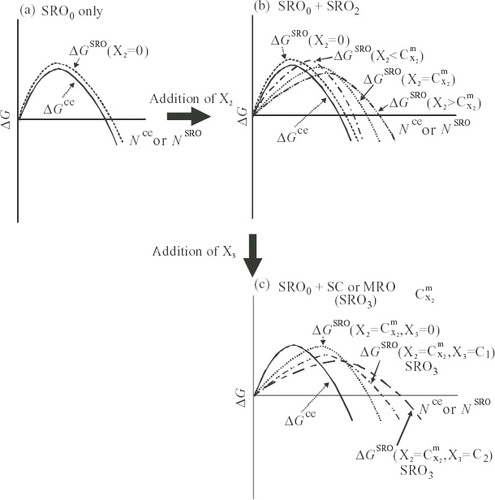
As shown in figure (a), ΔGSRO is greater than ΔGce for all values of N at temperatures below the melting point. Hence, the crystal embryo nucleates and grows and no glass formation is possible. By adding the second element X to host metallic solvent M, more than two SROs are formed in the liquid phase and its disorder can be stabilized to form a DRP distribution including M and X2. The minimum X2 concentration CX2m required for glass formation is reached when the height of the energy barrier is approximately equal between both the crystal embryo and the correlated SROs, as shown in figure (b). With increasing concentration of X2 beyond this level, the correlated SROs show decreasing energy, which hinders the atomic redistribution for the growth of the crystal embryo. Thus, glass formation is favored.
When the third element X3 is added to the binary M–X2 alloy, a stable SRO referred to as SC or MRO is formed by the harmonious coupling of the different SROs around the third element (X3). This further lowers ΔGSRO, as shown in figure (c), where the probability of formation of relatively large size and stable SROs considerably exceeds that of the formation of the crystal embryo for normal crystallization. This condition readily enhances the ease of glass formation. Also note that the larger the sphere radius of the noncrystalline cluster, the wider the temperature span ΔTX (difference between the crystallization and glass transition temperatures) becomes.
Concluding remarks
The GFA of liquid alloys has been discussed using the concept of SRO definitely found in the nearest-neighbor region. The effects of additive elements on the liquid structure can be described by four main factors: (i) formation of new SRO (as described by SRO2 or SRO3) and coexistence of two or more kinds of SROs, (ii) stabilization of dense random packing structure by restraining the atomic redistribution for initiating the nucleation and growth process, (iii) formation of stable cluster (SC) or MRO by the harmonious coupling of different types of SRO and (iv) difference between SRO characterizing the liquid structure and near-neighbor environment in the equilibrium crystalline phases.
The minimum solute concentration could be connected to the atomic volume mismatch estimated from the cube of the atomic radius of solvent and solute. On the basis of the empirical guideline, the optimum solute concentration for good glass formability in various binary alloys and some ternary alloys was determined using a phenomenological approach. The use of the interaction parameters was tested for effectively selecting the third solute element for good GFA in Fe70-B20-(X3)10 alloys (X3=Cr, W, Nb, Zr and Hf). These approaches may help to expand the empirical rules for a good GFA proposed by Inoue and his colleagues [Citation13–15].
Two typical model structures, the Bernal type and the chemical order type, proposed by the present authors (YW and HSC) in 1980 [Citation57] was used again as the basis for a generalized novel description of the glass structure. The energetics of the competition between the crystal embryo and different types of SRO is illustrated.
Finally, the frozen-in structure of the liquid alloys essentially depends on both quenching conditions and alloy composition. This implies that some properties of different types of as-quenched metallic glass vary from one run of production to the other and from one portion of the sample to another.
Acknowledgments
The authors would like to express their gratitude to Professors E Matsubara, Y Hirotsu, A P Tsai, K Fukamichi, A Muramatsu and A Yoshikawa for valuable discussions. The authors are also greatly indebted to Professor Y Hirotsu, Osaka University, for kindly providing photographs of their interesting results. Part of this work was supported by a Grant-in-Aid for Scientific Research Fund from the Japan Society for Promotion of Science (No 17206075 and 18029007).
References
- KlementWJrWillensR HDuwezP 1960 Nature 187 869 http://dx.doi.org/10.1038/187869b0
- ChenH STurnbullD 1968 J. Chem. Phys. 48 2560 http://dx.doi.org/10.1063/1.1669483
- ChenH STurnbullD 1967 Appl. Phys. Lett. 10 284 http://dx.doi.org/10.1063/1.1754813
- ChenH STurnbullD 1970 Acta Metall. 18 261 http://dx.doi.org/10.1016/0001-6160(70)90032-5
- ChenH S 1974 Acta Metall. 22 1505 http://dx.doi.org/10.1016/0001-6160(74)90112-6
- ChenH SJacksonK A 1978 Metallic Glasses Metals Park, OH American Society for Metals Chapter 3 p 74
- InoueAZhangTMasumotoT 1990 Mater. Trans. JIM 31 177
- ZhangTInoueAMasumotoT 1991 Mater. Trans JIM 32 1005
- PekerAJohnsonW L 1993 Appl. Phys. Lett. 63 2342 http://dx.doi.org/10.1063/1.110520
- InoueA 1998 Bulk Amorphous Alloys, Preparation and Fundamental Characteristics Zurich Trans Tech Publications
- InoueA 2000 Acta Mater. 48 279 http://dx.doi.org/10.1016/S1359-6454(99)00300-6
- NishiyamaNInoueA 1996 Mater. Trans. JIM 37 1531
- InoueA 2005 Japan Sci. Mon. 58 584593
- InoueA 1995 Mater. Trans. JIM 36 866
- InoueAZhangTMasumotoT 1993 J. Non-Cryst. Solids 156/158 473 http://dx.doi.org/10.1016/0022-3093(93)90003-G
- InoueA 2005 Kinzoku 58 7
- InoueA 2002 Funct. Mater. 22 43
- NiehT GLinC T 2006 Proc. 4th Int. Conf. Bulk Metallic Glasses (Gatlinburg, TN, USA), Intermetallics 14 855
- LuZ PLiuC T 2002 Acta Mater. 50 3501 http://dx.doi.org/10.1016/S1359-6454(02)00166-0
- Louzguine-LuzginD VInoueA 2007 J. Mater. Res. 22 1378 http://dx.doi.org/10.1557/jmr.2007.0167
- KauzmannW 1948 Chem. Rev. 43 219 http://dx.doi.org/10.1021/cr60135a002
- OhkawaS 1977 Crystal Growth Tokyo Shokabou
- TammanG 1933 Z. Metallkde 25 236
- ZettlemoyerA C 1969 Nucleation New York Marcel-Dekker
- NishiokaI 1975 Bull. J. Phys. Soc. Japan 30 116
- NishiokaI 1975 Bull. J. Phys. Soc. Japan 30 515
- MatsubaraETamuraTWasedaYInoueAZhangTMasumotoT 1992 Mater. Trans. JIM 33 873
- WasedaY 1980 The Structure of Non-Crystalline Materials New York McGraw-Hill
- FurukawaK 1960 Sci. Rep. Res. Inst. Tohoku Univ. A 12 368
- AshcroftN WLeknerJ 1966 Phys. Rev. 145 83 http://dx.doi.org/10.1103/PhysRev.145.83
- BernalJ D 1959 Nature 183 141 http://dx.doi.org/10.1038/183141a0
- BernalJ D 1964 Proc. R. Soc. Lond. A 280 299
- FinnyJ L 1970 Proc. R. Soc. Lond. A 319 479
- PolkD E 1970 Scr. Metall. 4 117 http://dx.doi.org/10.1016/0036-9748(70)90175-4
- PolkD E 1972 Acta Metall. 20 485 http://dx.doi.org/10.1016/0001-6160(72)90003-X
- HoareM R 1978 J. Non-Cryst. Solids 31 157 http://dx.doi.org/10.1016/0022-3093(78)90103-5
- AshcroftN WLangrethD C 1967 Phys. Rev. 159 500 http://dx.doi.org/10.1103/PhysRev.159.500
- WasedaY 2002 Anomalous X-ray Scattering for Materials Characterization Heidelberg Springer
- ParkC YSaitoMWasedaYNishiyamaNInoueA 1999 Mater. Trans. JIM 40 491
- MatsubaraESatoSImafukuMNakamuraTKoshibaHInoueAWasedaY 2001 Mater. Sci. Eng. A 312 136 http://dx.doi.org/10.1016/S0921-5093(00)01903-1
- HirotsuYNiehT GHirataAOhkuboTTanakaN 2006 Phys. Rev. B 73 012205 http://dx.doi.org/10.1103/PhysRevB.73.012205
- GaskellP H 1979 J. Non-Cryst. Solids 32 207 http://dx.doi.org/10.1016/0022-3093(79)90073-5
- ImafukuMSatoSKoshibaHMatsubaraEInoueA 2000 Mater. Trans. JIM 41 1526
- AndersonY 1977 Acta Chem. Scand. A 31 354 http://dx.doi.org/10.3891/acta.chem.scand.31a-0354
- MatsubaraESatoSImafukuMSaidaJInoueA 2001 Mater. Res. Soc. Symp. Proc. 644 L1.1.1
- SrolovizDEgamiTVitekV 1982 Proc. 4th Int. Conf. Rapidly Quenched Metals Sendai Japan Institute Metals p 263
- WasedaYChenH SJacobK TShibataH 2007 High Temp. Mater. Process. 26 at press
- EgamiTWasedaY 1984 J. Non-Cryst. Solids 64 113 http://dx.doi.org/10.1016/0022-3093(84)90210-2
- UenoSWasedaY 1987 J. Mater. Eng. 9 199
- KomoroH 1984 Thesis of Master of Eng. Tohoku University
- InoueAKobayashiKKanehiraJMasumotoT 1981 Sci. Rep. Res. Inst. Tohoku Univ. A 29 331
- DonaldI WDaviesH A 1978 J. Non-Cryst. Solids 30 77
- BohmerRAngellC A 1992 Phys. Rev. B 45 10091
- ElliotJ FGlaserMRamarkrishnaV 1963 Themochemistry for Steelmaking vol 2 Reading MA Addison-Wesley
- See for example, Selected Values of Thermodynamic Properties for Steelmaking The 19th Committee of Japan Society for Promotion and Science 1984
- UenoSWasedaYJacobK TTamakiS 1988 Steel Res. 59 474
- WasedaYChenH S 1980 Sci. Rep. Res. Inst. Tohoku Univ. A 28 143
- BarkerA S 1988 Z. Phys. Neue Forge 158 201
- BarkerA S 1990 J. Non-Cryst. Solids 117/118 252