Abstract
This review summarizes recent results obtained by 11B solid-state nuclear magnetic resonance (NMR) on boron-doped diamond, grown by the high-pressure high-temperature (HPHT) or chemical vapor deposition techniques. Simple single-pulse experiments as well as advanced two-dimensional NMR experiments were applied to the boron sites in diamond. It is shown that magic-angle spinning at magnetic fields above 10 T is suitable for observation of high-resolution 11B spectra of boron-doped diamond. For boron-doped HPHT diamonds, the existence of the excess boron that does not contribute to electrical conductivity was confirmed and its 11B NMR signal was characterized. The point-defect structures (B+H complexes and -B-B-/-B-C-B- clusters), postulated previously for the excess boron, were discarded and graphite-like structures were assigned instead.
Introduction
In 2004, Ekimov et al discovered superconductivity in heavily boron-doped diamond [Citation1]. So far, two major synthesis techniques of heavily boron-doped diamond are known: high-pressure high-temperature (HPHT) method and chemical vapor deposition (CVD). In contrast to the expectation of higher TC (the superconductivity transition temperature) for higher boron concentrations [B], Takano et al [Citation2, Citation3] showed that TC of homoepitaxial (100) thin films, synthesized by the microwave plasma assisted CVD, increases with increasing [B] and reaches a maximum at [B] ∼1×1022 cm−3. They also pointed out that TC ([B]) dependences are similar for diamonds grown by the HPHT method and (100) CVD films. On the other hand, TC for (111) films increases with increasing [B] in the same concentration range, and those TC values are more than twice higher than those of the (100) films [Citation2–4]. These findings indicate that not all boron atoms provide charge carriers.
Detailed studies have been reported on synthesis and characterization of heavily boron-doped diamond [Citation5–9]. Despite the gained insights, the relation between the local structure around boron dopants and physical properties of boron-doped diamond has not been fully clarified. This may be attributed to the difficulty in applying many spectroscopic techniques because the doped boron sites lack a long-range order. Solid-state nuclear magnetic resonance (NMR) is particularly useful in analysis of amorphous inorganic solids without such long-range order; besides, NMR can determine site distributions of each atomic species. Due to the low natural abundance of 13C (1.1%), 11B is expected to be the most accessible nucleus in boron-doped diamond. In this review, we have summarized solid-state 11B NMR results on the disordered local structure in several boron-doped diamonds and, in particular, the structure of the excess boron which does not contribute to electrical conductivity.
Spectral analysis of 11B NMR
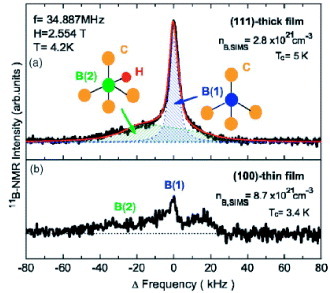
The first 11B NMR study on boron-doped diamond was reported by Mukuda et al [Citation10, Citation11]. They applied 11B solid-state NMR to boron-doped CVD diamond and found that 11B spectra observed in magnetic field of 2.554 T consist of two components—sharp and broad; the broad signal appearing at the lower-frequency side (figure ). They assigned the sharp signal to boron at highly symmetrical site, that is, the substitutional position for the carbon site in the diamond lattice. They also showed that the carriers associated with this boron site are responsible for the superconductivity. Further, on the basis of ab initio calculations and secondary ionization mass spectrometry (SIMS), the other, broad signal was assigned to a boron–hydrogen (B+H) complex, where the positively charged hydrogen compensates the carrier provided by the boron acceptor.
Figure 1 11B NMR spectra for (a) (111) thick film and (b) (100) thin CVD films. The red/dark gray curve are the calculated spectrum for the two components originated from two boron sites, B(1) and B(2). (Reproduced from [Citation10] with permission of the American Physical Society. http://link.aps.org/doi/10.1103/PhysRevB.75.033301.)
To improve spectral resolution, Murakami et al applied magic-angle spinning (MAS) [Citation12]. MAS has been widely applied in high-resolution solid-state NMR of spin-1/2 nuclei, such as 13C and 15N to remove the chemical-shift anisotropy. In this case, MAS removed not only the chemical-shift anisotropy, but also homonuclear 11B–11B and heteronuclear 11B–10B dipolar broadening. To show the effectiveness of MAS in the characterization of boron-doped diamond, Murakami et al compared the 11B MAS NMR spectra of the following four boron-doped diamond samples. Three samples HPHT-1,2,3 were prepared with the HPHT method from different starting materials: HPHT-1 from naphthalene and boron, HPHT-2 from graphite and boron and HPHT-3 from boron-doped graphite. The fourth sample was grown by CVD from a dilute gas mixture of methane and trimethylboron in hydrogen. The transition temperatures are TC∼7.0 K (onset) for the CVD, 3.8 K for HPHT-1, 4.5 K for HPHT-2 and 2.3 K for HPHT-3 samples.
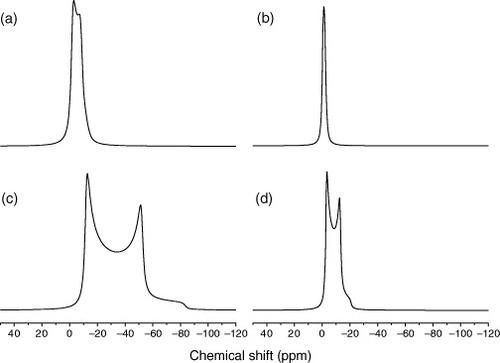
Figure shows 11B MAS-NMR spectra of those four samples recorded at 11.7 T (a1∼d1) and 21.8 T (a2∼d2 and a3∼d3), using a single-pulse excitation with a 90° pulse (a3∼d3) or a 30° pulse (a1∼d1 and a2∼d2). Values 90° and 30° correspond to different pulse widths; the two pulse widths were applied to observe the effects of the quadrupolar interaction on the lineshape, which appear when the strength of the quadrupolar interaction is comparable to or larger than the strength of the rf pulse [Citation13]. Two magnetic fields were used to appreciate second-order quadrupolar effects. Effects of the quadrupolar interaction are discussed below. To compare the resonance shift at different magnetic fields, the frequency offset from the reference signal frequency f0 of BF3·O (C2H5)2 was divided by f0 and given in parts per million (ppm), which is a standard data presentation in NMR.
Figure 2 11B MAS-NMR spectra of B-doped diamond powder: (a1–3) CVD, (b1–3) HPHT-1, (c1–3) HPHT-2 and (d1–3) HPHT-3. The spectra a1–d1 were taken at 11. 7 T and the other spectra at 21.8 T. The pulse-flip angle was 30° for (a1)–(d1) and (a2)–(d2) and 90° for (a3)–(d3). Spectra (e1) and (e2) show the 11B MAS signals calculated with the quadrupolar coupling constant of 1.6 MHz and the asymmetry parameter (η = 0). The peaks marked with * are spinning-side bands which are observed when the MAS frequency is smaller than the line broadening that is averaged by MAS when MAS is much faster. These sidebands belong to the signal at around 0 ppm. (Reproduced from [Citation12] with permission of the Elsevier Ltd.)

Figure reveals that high resolution can be achieved with MAS even at the relatively high magnetic field of 11.7 T. MAS spectra consist of a sharper peak at ∼0 ppm and a broader one at the high-frequency side, however, the relative intensities vary among the four samples examined. For example, the sharp peak near 0 ppm is negligible in the CVD sample and the intensity of the broad signal is low in HPHT-3. Effects of the quadrupolar interaction on the 11B MAS spectra were appreciable in the observed pulse-width and magnetic-field dependences in figure ; the effects are most prominent for the CVD and HPHT-1 samples, as discussed below. Comparison of the spectra of the HPHT-1,2,3 samples suggests that there are at least two signals at around 0 ppm. X-ray diffraction reveals B4C phase in HPHT-1 [Citation5], which has a sharp 11B MAS NMR peak around 0 ppm. Hence, one of the two sharp components may be ascribed to B4C [Citation12]. The other component at ∼0 ppm was tentatively assigned to boron powder (one of the starting materials for HPHT-1 and 2 samples) [Citation12], which has a broader 11B MAS signal at ∼0 ppm than that of B4C.
In the following, the relation is investigated between these spectral features and conductivity in three samples N1–N3 (N3 is identical to HPHT-1). These samples were prepared by the HPHT method with the same starting materials (naphthalene and amorphous boron) but with different initial boron ratios: B/(B+C) = 0.75, 2.4 and 5.0% for N1, N2 and N3, respectively.
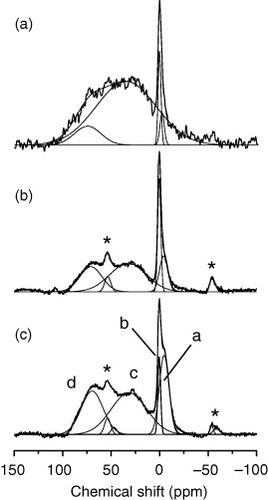
Figure shows the 11B MAS NMR spectra of the N1–N3 samples at 21.8 T [Citation14]. The spectra mainly consist of four signals a–d. The signals a and b were assigned to boron and B4C inclusions and the signals c and d to boron dispersed in the diamond lattice [Citation12]. All MAS spectra of figure can be fitted by a sum of Gaussians (thin lines in figure ) by taking the chemical shifts, the linewidths, and the relative intensities as fitting parameters. The best-fit chemical shifts for the signals a–d are −4.3, 1.3, 28.5 and 65.5 ppm, respectively. Note that these best-fit chemical-shift values are similar for the three spectra. Here, we used the term ‘chemical shift’. Other contributions, such as the Knight shift [Citation15, Citation16], do contribute to the observed shift, as mentioned below. However, as the conductivity is small at room temperature, the contribution of the Knight shift should be relatively small.
Figure 3 11B MAS NMR spectra observed at 21.8 T for N1 (a), N2 (b) and N3 (c). Deconvolution to Gaussian lineshapes is shown by thin lines. The peaks marked with * are spinning-side bands of signals a and b. The MAS frequency was 16 kHz. (Reproduced from [Citation14].)
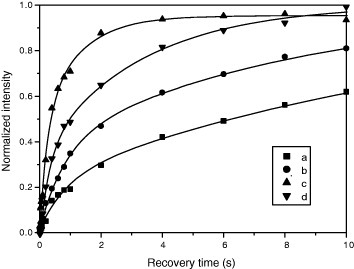
To further investigate the 11B MAS lineshape, the saturation-recovery experiment was conducted for the N3 sample, and the recovery-time dependences of the intensities at the signals a–d are plotted in figure [Citation12]. The recovery-time dependence was successfully fitted for each curve by a sum of two exponents MA{1−exp(−t/T1A)}+MB{1−exp(−t/T1B)}. Because three Zeeman levels exist in a spin-3/2 system, such double exponential recovery is expected [Citation17], however, in the present case, it was attributed to the signal overlap. For example, the envelope of the broad signal at 28.5 ppm overlaps with other signals, leading to the apparent double-exponential recovery. The best-fit T1 values were obtained as 14.6, 8.2, 0.5 and 3.3 s for the signals a–d, respectively [Citation12].
Figure 4 Recovery-time dependence of the 11B signal intensities in sample HPHT-1/N3. The signal intensities at the four chemical shifts, determined in figure as −4.3 ppm (a), 1.3 ppm (b), 28.5 ppm (c), 65.5 ppm (d), are normalized to those taken with the recovery time of 60 s. The solid lines are simulated ones with double exponents (see text). (Reproduced from [Citation12] with permission of the Elsevier Ltd.)
Mukuda et al examined temperature dependence of T1 of the sharper signal in their static spectra of B-doped diamond films prepared by the CVD method [Citation10, Citation11]. They found the Korringa relation, that is, 1/T1 T is temperature independent in the range 0–50 K [Citation10, Citation11]. Ignoring the differences in the preparation method and in the strength of the applied magnetic field, Murakami et al [Citation12] inserted T=300 K into the Korringa relation to have the calculated T1 value of ∼1.5–3 s, which may roughly explain the observed T1 values for the signals c and d [Citation12]. Hence, the sharper signal, found by Mukuda et al (B(1) in figure ) for the CVD sample observed without MAS, corresponds to the signal-c; whereas the broader signal (B(2) in figure ) was associated with the signal-d in figure for the HPHT sample. Please note the different relative intensities of signals c and d in CVD (figure (a)) and HPHT samples that relates to the highest Tc of the CVD sample (∼7.0 K) among those samples. The relative intensity of signal-c in HPHT-1 and 2 samples (figures (b) and (c)) also scales with the observed Tc (Tc∼3.8 K for HPHT-1 and ∼4.5 K for HPHT-2). The reason of the markedly different lineshape of HPHT-3 prepared from boron-doped graphite has not been explained.
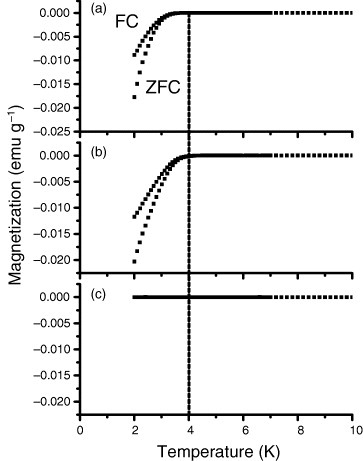
To examine how the 11B NMR spectra relate with electrical conductivity, the temperature dependence of the magnetization was measured for the N1–N3 samples (figure ) [Citation14]. Diamagnetic signals corresponding to superconductivity appeared for the N2 and N3 samples below 4 K. Further the transition temperature for N3 is slightly lower than that for N2, indicating that the increment of the initial amount of boron does not straightforwardly contribute to conductivity. The intensity of the signal-c (hereafter, boron-c) increases with the B/(B+C) ratio in samples N1 and N2. Further increase in the B/(B+C) ratio, however, does not straightforwardly contribute to the increase of boron-c in N3, but boron-d growth up. These results, together with the T1 examination and the lineshape analysis, indicate that the boron-c contributes to the conductivity and the boron-d corresponds to the electrically inactive, ‘excess’ boron.
Figure 5 Temperature dependence of magnetization for samples N3 (a), N2 (b) and N1 (c). Field cooling (FC) and zero-field cooling (ZFC) results are shown. The vertical dotted line drawn at 4 K is for eye guidance. (Reproduced from [Citation14].)
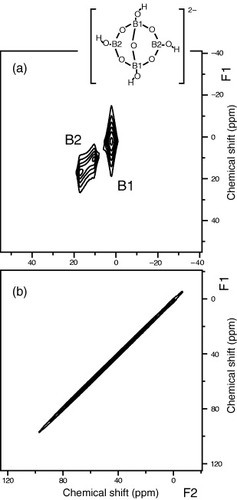
So far, two candidates for the excess boron have been postulated: (i) B+H and (ii) -B-B-/-B-C-B- complexes. To test the B+H model, Murakami et al examined 1H-11B dipolar broadening using a newly developed two-dimensional (2D) NMR technique (2D 1H on/off experiment) [Citation14]. In a 2D spectrum, signal intensity is plotted as a contour in a plane spanned by two frequency axes. Figure (a) shows the contour plot of the 2D 1H on/off spectrum of borax under MAS [Citation14], in which the projection on the horizontal frequency axis (F2) corresponds to 1H-decoupled lineshape and the projection on the vertical axis (F1) to 1H-coupled lineshape. Borax has two boron species B1 and B2 (see, the inset of figure ). From the neutron diffraction study [Citation18], the shortest 1H-11B distance is estimated as 0.2 nm. Figure (a) clearly shows 1H-11B dipolar broadening in the F1 dimension for the two boron species in borax. The 2D 1H on/off spectrum of the N3 sample (figure (b)), however exhibits only sharp diagonal components. There is no dipolar broadening, which should appear in the F1 dimension if an appreciable amount of the 1H+11B complexes existed. This observation ruled out the B+H model of the excess boron. Similar experimental results were obtained with static NMR (without MAS) [Citation19].
Figure 6 2D 1H on/off spectra of borax (a) and HPHT diamond sample N3 (b) measured in 11.7 T. A structure of borax is given as the inset. (Reproduced from [Citation14].)
The existence of the boron–boron (-B-B-/-B-C-B-) clusters has also been discarded [Citation13, Citation17] by examining 11B–11B 2D exchange NMR [Citation20] and observing only diagonal peaks in the 2D exchange spectrum of the N3 sample [Citation14]. Thus if neither the B+H nor -B-B-/-B-C-B- fit into the experiment then what is boron-d?
Two clues: chemical shift and quadrupolar coupling
In this section, the chemical shift and the quadrupolar coupling are used to unravel the structures of boron-c and especially boron-d. From the data for boron-containing organic compounds, it has been well established that 11B chemical shifts of tetrahedrally coordinated boron appear at frequencies ranging roughly from −20 ppm to 10 ppm [Citation21]. The observed chemical shift of boron-c (∼28.5 ppm), which was assigned to the tetrahedrally coordinated boron in the diamond lattice, is therefore slightly shifted to higher frequencies. This could be due to the Knight shift contribution [Citation15, Citation16].
On the other hand, the 11B chemical shifts of trigonally coordinated boron are found at higher frequencies ∼20–100 ppm [Citation21]. Note the wider frequency range for trigonal boron compared to tetrahedral boron. The observed chemical shift of boron-d at ∼68.5 ppm thus suggests that boron-d is a trigonal boron. This is consistent with the assignment of boron-d to the electrically inactive boron—trigonal boron does not provide carriers in diamond. Hereafter we primarily concern with the quadrupolar interaction of 11B in boron-doped diamond.
Trigonally coordinated 11B has appreciable quadrupolar coupling. For example, the quadrupolar coupling of trimesitylborane is 4.75 MHz and that of triphenyl borate is 2.32 MHz [Citation22]. Mukuda et al reported the magnitude of the boron quadrupolar coupling in boron-doped CVD diamond as 1.6 MHz [Citation10, Citation11]. Therefore it is worthy to examine the quadrupolar coupling of boron-d.
If quadrupolar coupling is large, the second-order quadrupolar interaction should be appreciable too. To examine whether the broad lineshape of boron-d can be reproduced by taking into account the second-order quadrupolar interaction, Murakami et al compared the calculated second-order quadrupolar MAS lineshape [Citation23] with the observed lineshape in figure [Citation12]. The sharp signals e1 and e2 in figure are simulated using the reported values for the CVD sample [Citation10, Citation11] of the quadrupole coupling constant (e2qQ/h=1.6 MHz) and the asymmetry parameter (η=0). Clearly, the quadrupolar coupling constant used in calculation is too small to explain the observed large linewidth. Figure shows magnetic field dependence of the calculated MAS lineshape, calculated taking e2qQ/h=5 MHz (a and c) or 2 MHz (b and d); η=0 for the magnetic field of 20 T (a and b) or 10 T (c and d). Figure shows that e2qQ/h5 MHz is required to explain the large width of the boron-d signal at 11.7 T. For such large values, the lineshape dependence on the magnetic field should be apparent. However, the spectral features of the two 11B MAS NMR spectra of sample N3, measured at 21.8 T and at 11.7 T (figure ; b1 and b2), are similar. This weak dependence on the static field indicates small quadrupolar couplings.
Figure 7 11B MAS NMR spectra simulated using e2qQ/h= 5 MHz (a and c) or 2 MHz (b and d), η=0 and magnetic field of 20 T (a and b) or 10 T (c and d).
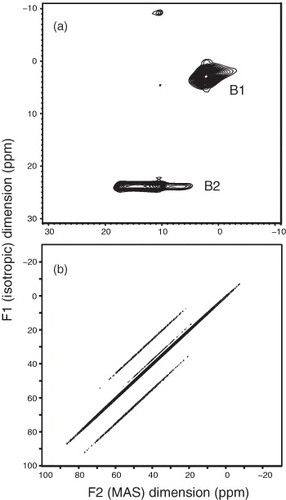
To further examine the quadrupolar interaction, we attempted the multiple-quantum MAS (MQMAS) experiment [Citation24], in which the second-order quadrupolar broadening is removed by correlating the multiple-quantum transitions with the single quantum transitions using 2D NMR spectroscopy. For example, we show in figure (a) the 11B MQMAS spectrum of borax. In the MQMAS spectrum, the vertical axis (F1) is used for the isotropic shift and the horizontal one (F2) is for the second-order quadrupolar broadening. In figure (a), two contour peaks are clearly observed corresponding to the two distinct 11B sites in borax. Figure (b) shows the MQMAS spectrum of sample N3. The sharp diagonal peak reveals small quadrupolar coupling. In other words, the 11B quadrupolar interaction in boron-doped diamond is too small for MQMAS. Further, Murakami et al adopted experiments sensitive to small quadrupolar interactions, that is, the nutation NMR [Citation25–28]. From the two 2D nutation experiments with different rf-strengths, they concluded that the quadrupolar coupling constant of the 11B nuclei in diamond is 100 kHz, and some boron atoms have much smaller quadrupolar coupling [Citation14]. The smaller one should correspond to boron-c, which has been assigned to the tetrahedrally coordinated boron in the diamond structure, and the relatively larger one is boron-d.
Figure 8 MQMAS spectra of borax in 11.7 T (a) and HPHT diamond sample N3 in 21.8 T (b). The two lines parallel to the main diagonal line are ascribed to insufficient data points in the F1 domain of the MQMAS experiment.
The assignment of signal-d
Chemical shift suggests that boron-d is trigonally coordinated. The observed large chemical shift distribution can be attributed to variation in the local environment. As for a possible structure, we note that graphite formation is an intermediate stage of the HPHT synthesis [Citation29]. Presence of disordered graphite in HPHT samples was inferred by Ekimov et al from the broadening of x-ray diffraction and Raman peaks [Citation5]. Hence, it is suggested [Citation14] that boron-d is trigonally coordinated boron in disordered graphite-like structures. This assignment may contradict the observed small quadrupolar coupling, because trigonally coordinated boron in a flat graphite structure should have a large quadrupolar coupling of 3.36 MHz [Citation30]. However, Murakami et al pointed out [Citation14] that the small quadrupolar interaction merely indicates better ‘local’ symmetry of the electric field gradient around boron. They also pointed out these boron-containing graphite structures should be relatively small, otherwise distinct x-ray diffraction lines would have been observed. In summary, the excess boron is the trigonally coordinated boron in non-diamond phase; its local symmetry is high enough to produce small electric field gradient.
Acknowledgments
The diamond samples N1, N2, HPHT-1 (N3) and HPHT-2 were kindly supplied by Dr E A Ekimov and Dr V A Sidorov (Russian Academy of Science). The sample HPHT-3 was prepared by Dr H Sumiya (Sumitomo Electric Industries Ltd.) and CVD films were supplied by Dr H Kawarada (Waseda University). We thank all these co-workers and Professor K Takegoshi at Kyoto University for his general advice on NMR measurements.
MM appreciates support from the ‘Nanotechnology Support Project’ of the Ministry of Education, Culture, Sports, Science and Technology (MEXT) of Japan. TS thanks support from World Premier International Research Center Initiative (WPI Initiative) on Materials Nanoarchitronics (MANA) at NIMS, from MEXT of Japan. YT acknowledges support from the Grant-in-Aid for Science Research of MEXT. We also acknowledge technical support from Tsukuba Magnet Laboratory, NIMS.
References
- EkimovE ASidorovV ABauerE DMel'nikN NCurroN JThompsonJ DStishovS M 2004 Nature 428 542 http://dx.doi.org/10.1038/nature02449
- TakanoYTakenouchiTIshiiSUedaSOkutsuTSakaguchiIUmezawaHKawaradaHTachikiM 2007 Diamond Relat. Mater. 16 911 http://dx.doi.org/10.1016/j.diamond.2007.01.027
- TakanoYNagaoMSakaguchiITachikiMHatanoTKobayashiKUmezawaHKawaradaH 2004 Appl. Phys. Lett. 85 2851 http://dx.doi.org/10.1063/1.1802389
- UmezawaHTakenouchiTTakanoYKobayashiKNagaoMSakaguchiITachikiMHatanoTZhongGKawaradaH 2005 arXiv:cond-mat/0503303
- EkimovE ASidorovV ARakhmaninaA VMel'nikN NSadykovR AThompsonJ D 2006 Sci. Technol. Adv. Mater. 7 S2 http://dx.doi.org/10.1016/j.stam.2006.03.004
- SidorovV AEkimovE ARakhmaninaA VStishovS MBauerE DThompsonJ D 2006 Sci. Technol. Adv. Mater. 7 S7 http://dx.doi.org/10.1016/j.stam.2006.03.005
- YokoyaT et al 2006 Sci. Technol. Adv. Mater. 7 S12 http://dx.doi.org/10.1016/j.stam.2006.02.014
- IshizakaK et al 2006 Sci. Technol. Adv. Mater. 7 S17 http://dx.doi.org/10.1016/j.stam.2006.05.008
- NishizakiTTakanoYNagaoMTakenouchiTKawaradaHKobayashiN 2006 Sci. Technol. Adv. Mater. 7 S22 http://dx.doi.org/10.1016/j.stam.2006.03.007
- MukudaHTsuchidaTHaradaAKitaokaYTakenouchiTTakanoYNagaoMSakaguchiIOguchiTKawaradaH 2007 Phys. Rev. B 75 033301 http://dx.doi.org/10.1103/PhysRevB.75.033301
- MukudaHTsuchidaTHaradaAKitaokaYTakenouchiTTakanoYNagaoMSakaguchiIKawaradaH 2006 Sci. Technol. Adv. Mater. 7 S37 http://dx.doi.org/10.1016/j.stam.2006.03.010
- MurakamiMShimizuTTanshoMTakanoYIshiiSEkimovE ASidorovV ASumiyaHKawaradaHTakegoshiK 2008 Diamond Relat. Mater. 17 1835 http://dx.doi.org/10.1016/j.diamond.2008.04.013
- FenzkeDFreudeDFrohlichTHaaseJ 1984 Chem. Phys. Lett. 111 171 http://dx.doi.org/10.1016/0009-2614(84)80458-3
- MurakamiMShimizuTTanshoMTakanoYIshiiSEkimovE ASidorovV ATakegoshiK 2009 Diamond Relat. Mater. submitted
- KnightW D 1956 Solid State Physics vol 2, FSeitz DTurnbull New York Academic p 93
- KorringaJ 1950 Physica 16 601 http://dx.doi.org/10.1016/0031-8914(50)90105-4
- WoessnerD ETimkenH K C 1990 J. Magn. Reson. 90 411
- LevyH ALisenskyG C 1978 Acta Crystallogr. B 34 3502 http://dx.doi.org/10.1107/S0567740878011504
- MurakamiMShimizuTTanshoMTakanoYIshiiSEkimovE ASidorovV AKawaradaHTakegoshiK 2007 Japan. J. Appl. Phys. 46 L1138 http://dx.doi.org/10.1143/JJAP.46.L1138
- MurakamiMShimizuTTanshoMVinuAArigaKMoriTTakegoshiK 2007 Solid State Nucl. Magn. Reson. 31 193 http://dx.doi.org/10.1016/j.ssnmr.2007.04.003
- ReedD 1996 Encyclopedia of Nuclear Magnetic Resonance vol 2 D MGrant R KHarris Chichester, UK Wiley p 1002
- BryceD LWasylishenR EGeeM 2001 J. Phys. Chem. A 105 3655
- KentgensA P MScholleK F M GVeemanW S 1983 J. Phys. Chem. 87 4357 http://dx.doi.org/10.1021/j100245a008
- FrydmanLHarwoodJ S 1995 J. Am. Chem. Soc. 117 5367 http://dx.doi.org/10.1021/ja00124a023
- SamosonALippmaaE 1983 Phys. Rev. B 28 6567 http://dx.doi.org/10.1103/PhysRevB.28.6567
- SamosonALippmaaE 1983 Chem. Phys. Lett. 100 205 http://dx.doi.org/10.1016/0009-2614(83)87276-5
- SamosonALippmaaE 1988 J. Magn. Reson. 79 255
- KentgensA P MLemmensJ J MGeurtsF M MVeemanW S 1987 J. Magn. Reson. 71 62
- VoronovO ARakhmaninaA V 1992 Inorg. Mater. 28 1408 (in Russian)
- LeeYHanD-YLeeDWooA JLeeS HKimY K 2002 Carbon 40 403 http://dx.doi.org/10.1016/S0008-6223(01)00120-8