Abstract
The plastic deformation of Ti45Zr16Be20Cu10Ni9 bulk metallic glass has been investigated by nanoindentation performed with loads ranging from 10 to 200 mN in a wide range of loading rates. The plastic flow in the alloy exhibited conspicuous serrations at low loading rates. The serrations, however, became less prominent as the rate of indentation increased. Atomic force microscopy showed a significant pile-up of materials around the indents, indicating that a highly localized plastic deformation occurred under nanoindentation. The possible mechanism governing the plastic deformation in bulk metallic glass specimens is tentatively discussed in terms of strain-induced free volume.
Introduction
In recent years, there has been a spurt of studies related to rate-dependent inhomogeneous and homogeneous transitions of plastic deformation during the nanoindentation of bulk metallic glass (BMG) specimens [Citation1–4]. These studies have attempted to clarify the mechanism and mechanics of metallic glass deformation. A careful transmission electron microscopy (TEM) study of indented metallic glass specimens revealed the presence of ordered or nanocrystalline regions that result from local mechanical deformation [Citation1, Citation5–7]. With advances in nanoindentation techniques, it is now possible to investigate the mechanical response during an entire loading sequence [Citation1, Citation8]. In the early 2000s, the occurrence of a serrated flow was reported by Wang et al [Citation9] and Wright et al [Citation10] during the indentation of Zr-based metallic glass; they attributed it to a discrete pop-in phenomenon. However, one or only few pop-ins were thought to indicate the transition from elastic deformation to plastic deformation (i.e. yielding), as in crystalline materials [Citation11]. Golovin et al [Citation12] and Greer and Walker [Citation13] have reported quite an interesting feature of inhomogeneous deformation as continuous serrations (serial pop-ins) in a load displacement (p–h) curve during BMG nanoindentation. Following these investigations, similar discrete flow during nanoindentation has been observed in Pd-, Zr-, La-, Mg-, Cu-, Ce-, and Au-based BMGs [Citation14, Citation15]. It is now well established that serrations are associated with shear band nucleation and propagation. A growing number of authors considered that the formation of individual shear bands by nanoindentation, where displacements burst in the load-displacement (p–h) response have been correlated with discrete shear banding events [Citation14, Citation16]. Schuh et al demonstrated extensively that discrete flow was strongly dependent not only on the chemical composition of the BMGs but also on indentation loading rate [Citation2, Citation14, Citation17, Citation18], that is the serrations in the p–h curve are more pronounced at lower loading rates and vanish or become less prominent with increasing loading rate. This result is basically counterintuitive, because metallic glass exhibits homogeneous flow at low strain rates, whereas it predominantly shows shear instabilities at high rates [Citation18, Citation19]. Because of this apparent inconsistency, several authors have suggested that the rate dependence observed in nanoindentation experiment is due to instrumental artifact [Citation20, Citation21]. In contrast, Schuh et al [Citation17] have proposed that these results in fact demonstrate the true material response and proved its physically distinct appearance on the basis of a new high-rate regime of homogeneous flow on the deformation map of metallic glass specimens. They have also proposed [Citation17] that the counterintuitive nature of deformation behavior arises because of the predominance of shear band nucleation kinetics at high deformation rates. Recently, Burgess et al [Citation22] have studied the nature of displacement burst characteristics in terms of various parameters, e.g. displacement burst frequency, size and duration throughout the load-controlled nanoindentation of an Mg65Cu25Y10 bulk metallic glass, and observed these parameters to be inversely related to loading rate. They also reported that hardness, modulus and both elastic and plastic energies of deformation are independent of loading rate. Most importantly, they reported that the onset of serration is independent of loading rate during nanoindentation and that there is no change in the mechanism of deformation from serrated flow via shear banding at low loading rate to smooth plastic flow at higher loading rate. The latter observation was attributed to the increased resolvability of displacement bursts at lower loading rates. They also proposed a displacement burst model that successfully fitted the experimental data in the investigated range of loading rates. Mukhopadhyay and Paufler [Citation23] reported various theoretical models accounting for indentation mechanics and reviewed their mechanisms in quasicrystals, bulk metallic glass specimens and nanomaterials. The serrated flow is also closely related to the microstructure of the amorphous materials, in addition to the rate dependence, because different BMGs show completely different types of serrated flow behavior [Citation3]. To our knowledge, the plastic deformation behavior of Ti-based bulk metallic glass during nanoindentation has not been investigated yet. The Ti-based bulk metallic glass with a particular composition, namely, Ti45Zr16Be20Cu10Ni9, reported by Park et al [Citation24] exhibits a high glass forming ability, a large supercooled liquid region and excellent mechanical properties. Thus, we have investigated the plastic deformation behavior of Ti45Zr16Be20Cu10Ni9 alloy at room temperature through instrumental nanoindentation. The crystallization behavior of the alloy is also studied to determine its stability. We analyze the plastic deformation of this alloy aiming to understand the mechanisms governing the plastic deformation of bulk metallic glasses
Experimental
Alloy ingots with a nominal composition of Ti45Zr16Be20Cu10Ni9 were prepared by arc-melting mixtures of pure Ti, Zr, Cu, Ni and Be with a purity greater than 99.9% in Ti gettered argon atmosphere. The ingots were remelted five times to ensure chemical homogeneity. The homogenized ingots were then subjected to suck casting into a copper mould, producing 3-mm-thick plates. The amorphous nature of the two as-cast samples was verified by x-ray diffraction (XRD) analysis (Rigaku CN2301) using monochromatic CuKα radiation and TEM (JEOL, 2010F). Thermal analysis was conducted using differential scanning calorimetry (DSC) (Perkin-Elmer, DSC7) in Ar gas flow. Baseline correction was made for each DSC scan. The specimens for nanoindentation measurement were mechanically polished to a mirror finish and tested in MTS, Nano Indenter XP with a Berkovich diamond tip. Fused silica was used as a reference sample for the initial tip calibration. Indentation was performed in a load-control mode to a depth limit of 2 μ m with varying maximum load of 10–200 mN at loading rates of 0.08– 100 mN s-1. The thermal drift correction of the machine was kept constant at ∼0.016 nm s-1 during each test. Hardness and the modulus of elasticity were obtained from the nanoindentation curves using the Oliver–Pharr method [Citation25]. At least six indents at each loading rate were performed to verify the accuracy and scatter of the indentation data. After the nanoindentation, the morphologies of the indents were examined by atomic force microscopy (AFM, JSPM-5200, JEOL Ltd.).
Results and discussion
The as-cast Ti45 Zr16Be20Cu10Ni9 sample examined by XRD analysis appears to be fully amorphous, as demonstrated by the large peak width in figure (a). The amorphous nature of the alloy was also confirmed by TEM, as shown in figure (b). In order to investigate the thermal response and crystallization kinetics of the alloy, differential scanning calorimetry was performed at different heating rates. Figure (a) shows the DSC curves of Ti45Zr16Be20Cu10Ni9 BMGs performed at heating rates of 5, 10, 20, 40 and 80 K min-1. Two pronounced exothermic peaks are present corresponding to the double-stage crystallization. No clear evidence of glass transition temperature was found in the alloy composition. This may be due to the presence of a fine-scale and inhomogeneous distribution of pre-quenched clusters in the as-cast amorphous Ti45Zr16Be20Cu10Ni9 alloy. Those clusters may be responsible for the exclusive formation of icosahedral nanocrystals when annealed at low temperature [Citation24, Citation26, Citation27] and for the absence of an apparent glass transition, similar to that in other reports in Al-rich metallic and Ti-based glass specimens [Citation24, Citation28–30]. Also note that the existence of such a short-range or medium-range ordering in amorphous alloys is synthesis sensitive. The existence of a short-range or medium-range order icosahedral or crystalline clustering [Citation26–29] (not necessarily stable icosahedral quasicrystalline or stable crystals) in the as-cast amorphous state physically explains the preferences for the primary crystallization of icosahedral quasicrystals, as was reported in Zr- and Hf-based glass specimens [Citation26, Citation27], or of crystalline phase [Citation28, Citation29] during devitrification. Moreover, on the basis of other studies, it can be further argued that pre-existing clusters may vary in density and sizes in certain glass specimens [Citation31–34]. Consequently, during continuous DSC scan, these clusters may be energetically and preferentially formed from rich clustering sites (which may still be amorphous) when the temperature approaches, but is still below, the glass transition temperature. Because the viscosity of metallic glass is several orders of magnitude lower near the glass transition temperature than at room temperature [Citation35], a marked decrease in viscosity directly enhances crystallization kinetics since the time needed to nucleate and grow a stable phase from the liquid is proportional to liquid viscosity [Citation35]. Therefore, the resulting crystallization enthalpy is sufficient to obscure the endothermic signal associated with the glass transition temperature, which may be the cause of the apparent absence of a glass transition temperature in the present glass alloy.
Figure 1 (a) XRD pattern of as-cast Ti45Zr16Be20Cu10Ni9 alloy. A broad hump indicates the amorphous structure of the sample. (b) Electron micrograph and corresponding SAD pattern (inset). SAD pattern exhibits a diffuse halo confirming the amorphous structure.
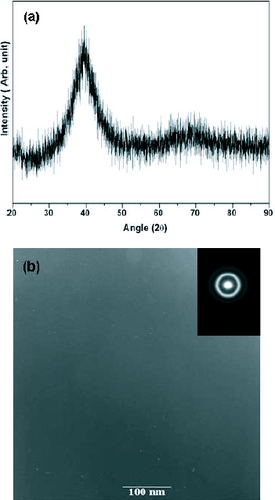
Figure 2 (a) DSC curve obtained from Ti45Zr16Be20Cu10Ni9 BMG alloy subjected to different heating rates. (b) Kissinger plot of Ti45Zr16Be20Cu10Ni9 BMG alloy.
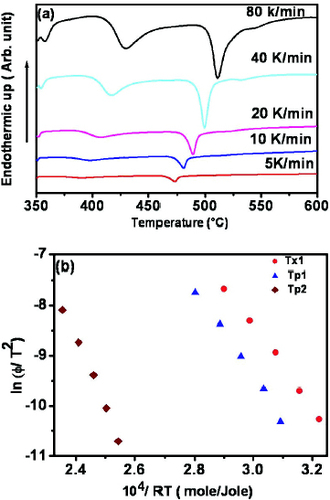
The apparent activation energy for the crystallization of an amorphous alloy under continuous heating condition is often estimated using the Kissinger equation [Citation36], expressed as
(1)
where φ is the heating rate, E is the apparent activation energy of the process, R is the gas constant and T is the specific temperature, such as the onset temperature Tx, or peak temperature Tp of crystallization. By plotting
versus 1/(RT), an approximately straight line with a slope of - Ex or - Ep can be obtained, in which E is the apparent activation energy of the whole reaction. It has been suggested that the Kissinger equation is valid for determining glass transition activation energy [Citation37]. In this work, no clear endothermic peak due to glass transition was observed similar to the observation reported by Park et al [Citation24]. Therefore, the onset of crystallization temperature Tx, and the first and second peak temperatures Tp1 and Tp2, respectively, of crystallization were selected as the specific temperatures for evaluating the activation energies of crystallization for amorphous Ti45Zr16Be20Cu10Ni9. Table 1 shows a summary of the characteristic temperatures of the Ti45Zr16Be20Cu10Ni9 alloy at different heating rates. Kissinger plots are shown in figure (b). The activation energies Ex, Ep1 and Ep2 are deduced as 80.68 ± 0.25, 88.13 ± 0.35, 137.26 ± 0.54 kJ mol-1, respectively. Note that the activation energy observed for the present alloy is much smaller than the typical activation energy (ranging from 164 to 675 kJ mole-1) reported for most metallic glass specimens [Citation38–40]. The low activation energy of crystallization may be attributed to the presence of pre-quenched icosahedral clusters in as-cast amorphous alloy. Those clusters facilitate crystallization thereby reducing the activation energy. Also note that when the precipitation phase resembles the short-range order of the amorphous solid, crystallization is easier, hence, the barrier to nucleation is relatively small as reported by Xing et al [Citation26].
Characteristic temperatures Tx, Tp1 and Tp2 of bulk amorphous alloy Ti45Zr16Be20Cu10Ni9 at different heating rates.
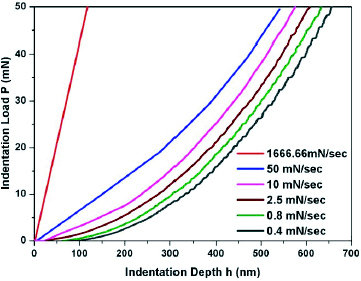
One of the main applications of instrumented indentation, beside simple measurement of hardness or elastic modulus, is to identify discrete signals associated with structural changes beneath the indenter. In metallic glass specimens, a few very small and isolated pop-in events have been observed by Wright et al [Citation10] in Zr-based glass and attributed to the nucleation of shear bands. On the other hand, displacement burst or pop-ins observed in crystalline materials has been attributed to dislocation nucleation or motion [Citation41, Citation42], oxide cracking [Citation43, Citation44], or even phase transformation [Citation45]. Nanoindentation experiment was carried out using the load control mode with the maximum indentation load in the range 10–200 mN under different loading conditions to investigate plastic deformation and plastic serrated flow behavior. The loading and unloading rates during each experiment were kept constant. The load-displacement (p–h) curves obtained with nanoindentation, performed up to a maximum load of 50 mN on Ti45Zr16Be20Cu10Ni9 BMG, under different loading rates are shown in figure . To clearly distinguish each p–h curve while presenting all of them in the same plot, some of the curves were shifted along the displacement axis and only the loading portion of the p–h curves is shown. The p–h curves obtained at maximum loads of 10, 100 and 200 mN are not shown here. The p–h curves obtained at each maximum load show strong rate dependence. At low loading rates, the p–h curves are punctuated by a number of distinct discrete bursts of displacement (or pop-ins). As loading rate increased, the serrated displacement could be observed less prominently, as shown in figure , and the p–h curves were smooth for the loading rate higher than 0.5 mN s-1. A similar behavior of such a transition from a serrated p–h curve to a smooth p–h curve as a function of loading rate was observed in each loading mode. These observations are consistent with the results by Schuh et al [Citation1]. Serrations are thought to correlate with the motion of individual shear bands through the specimens, and each serration contributes a small increment of plastic strain. Regarding the loading and strain rate dependences, Schuh and Nieh [Citation1] suggested that the change in plastic flow from a low rate to a high rate is governed by the accommodation between the shear band and the applied strain. If the strain rate is low, a shear band would have sufficient time to adapt to the applied strain, leading to a distinct strain burst. In contrast, if the applied strain exceeds the rate of relaxation of a single shear band, multiple shear bands can be activated simultaneously, leading to appearance of a less effective serration or finally to the disappearance of serration.
Figure 3 Load displacement (p–h) curve obtained by nanoindentation performed on Ti45Zr16Be20Cu10Ni9 BMG at 50 mN and various loading rates.
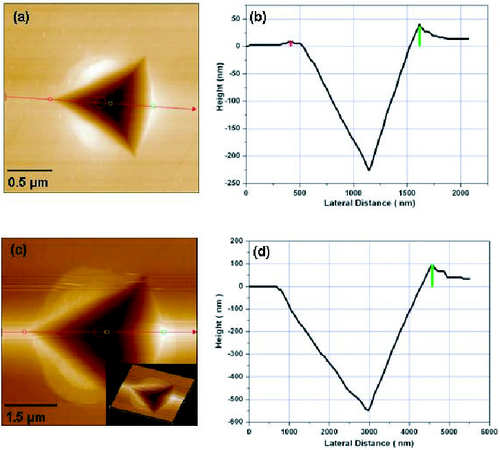
To investigate the deformation morphology in this alloy composition, typical examples of AFM images of the indent and cross-sectional profiles of Ti45Zr16Be20Cu10Ni9 alloy observed at maximum loads of 10 and 50 mN are shown in figure . The surface uplift due to the pile-up of materials can be clearly observed around the indent. From the profile, the height of the pile-up is measured as ∼40 nm (figure (b)) for 10 mN indentation and 94 nm (figure (d)) for 50 mN indentation. Thus, it appears that with increasing load, the degree of pile-up also increases, i.e. the occurrence of the softening effect. A significant pile-up around the indenter also suggests that a highly localized plastic deformation took place during the nanoindentation, which is very usual for BMGs [Citation2, Citation3]. From the loading-unloading curves, the indentation depth and the ratio of the plastic work WPlast to the total work WTotal with changing load were calculated and are shown in table 2. From table 2, it is also clear that indentation depth increases with increasing indentation load, suggesting the occurrence of inhomogeneous flow in this alloy underneath the indenter.
Maximum indentation depths and ratios of plastic work to total work for Ti45Zr16Be20Cu10Ni9.
Figure 4 AFM morphologies (a, c) and cross profiles of the indents (b, d) at indentation loads of 10 (a, b) and 50 mN (c, d) and loading rate of 0.08 mN s-1.
Two mechanisms have been proposed to explain the localized plastic deformation of amorphous materials at ambient temperatures. The first supports the concept of an increase in temperature (which can even reach Tg) due to local adiabatic heating inside the shear band. In contrast, the second mechanism suggests that, during plastic deformation, the viscosity within the shear bands decreases owing to the formation of an extra free volume, which in turn causes a local softening of the glass, and thus serrated flow can occur under applied strain. To determine which mechanism dominates the plastic flow, we first consider the possible increase in temperature inside the shear band. For the present situation, an estimate by Eshlby and Prutt [Citation46] of the increase in temperature in the shear band is given as
(2)
where σ is the shear yield strength,
is the shear strain rate inside the band, k and cp are, respectively, the thermal conductivity and specific heat of metallic glass, and h and Δ γ b are respectively the thickness of the band and the total shear strain inside the band. For Ti45Zr16Be20Cu10Ni9, σ ≅ 2.10 GPa (average yield strength for Ti-based BMGs [Citation47]) and
[Citation5, Citation26], while for a typical metallic glass k≅ 3.5 J m-1 s-1 K-1 and cp≅5.5×10⁶ J m-3 K-1 [Citation5]. The thickness of the shear band can be estimated from figure (c) as ∼17 nm. This value is in the range of the typical thicknesses of shear bands (10–20 nm) in glass [Citation46–51]. On the other hand, the strain increment in the band can be measured directly from the p–h curve (figure (b)), assuming that the strain originates only from the serrated displacement. This yields a displacement burst of Δh= 6.8 nm, on average, for the serration. Assuming that the plastic deformation proceeds mainly in the direction of the thickness of the band, the strain Δ γ b (= Δh/h) can be calculated as 0.40. Using the above data, equation (2) predicts a negligible temperature increase of 0.04 K. It should be noted that equation (2) considers all the shear bands to be heated simultaneously during the plastic deformation of metallic glass. However, another case may also exist in which the shear is only initiated at one point and then propagates. If so then equation (2) would overestimate the heated area and underestimate the temperature increase. Wright et al [Citation10] considered heating over a more localized area and estimated the maximum temperature increase as ∼102 K for a Zr-based BMG under compression. The above analysis indicates that localized heating may not be the primary cause of the plastic flow in BMGs. Instead, plastic flow is more likely caused by changes in the viscosity associated with increased free volume inside the shear band. It has been proposed [Citation10, Citation18] and verified by direct measurement [Citation52] that the shearing of an amorphous material at temperatures well below its Tg can result in flow dilatation due to the intake of the stress-induced free volume. It is in these regions of free volume where mechanical coupling to the surroundings is weak, such that inelastic relaxation becomes possible by the local atomic rearrangements. This may be the consequence, not the main reason, for the localized plastic flow in metallic glass specimens at low temperatures in this study. Note that the increase in free volume and decrease in viscosity in the shear bands can markedly enhance atomic diffusion coefficient, which can even reach a level corresponding to temperatures higher than Tg. In such a case, nanocrystallization around the indent may take place, as reported previously in Zr-based bulk metallic glass after nanoindentation [Citation5]. The present investigation of plastic deformation during nanoindentation also provides an impetus to clarify whether a similar type of crystallization also occurs in this Ti-based glass. For such clarification, TEM is necessary and will be carried out in future. Such study will be very interesting, particularly for Ti45Zr16Be20Cu10Ni9 BMG, which shows the initial formation of quasicrystals.
Conclusions
Nanoindentation has been used to study the plastic deformation of Ti45Zr16Be20Cu10Ni9 bulk metallic glass. The load displacement (p–h) curves of the glass exhibited significant serrated plastic behavior at low loading rate and almost vanished at high loading rate. A significant pile-up of materials around the indents can be observed, indicating that a highly localized plastic deformation occurred under the nanoindentation performed on Ti45Zr16Be20Cu10Ni9 bulk metallic glass.
Acknowledgments
The authors are grateful to the Global Research Laboratory program. DKM gratefully acknowledges the financial support provided by the Korean Ministry of Education under the grant BK-21 program.
References
- SchuhC ANiehT G 2004 J. Mater. Res. 19 46
- SchuhC AArgonA SNiehT GWadsworthJ 2003 Phil. Mag. A 83 2585 http://dx.doi.org/10.1080/1478643031000118012
- VaidyanathanRDaoMRavichandranGSureshS 2001 Acta Mater. 49 3781 http://dx.doi.org/10.1016/S1359-6454(01)00263-4
- PatnaikM N MNarashimhanRRamamurtyU 2004 Acta Mater. 52 3335 http://dx.doi.org/10.1016/j.actamat.2004.03.028
- KimJ JChoiYSureshSArgonA S 2002 Science 295 654
- JiangW HPinkertonF EAtzmonM 2003 J. Appl. Phys. 93 9287 http://dx.doi.org/10.1063/1.1571234
- MukhopadhyayN KBelgerAPauflerPKimD H 2007 Mater. Sci. Eng. A 449–451 954 http://dx.doi.org/10.1016/j.msea.2006.02.258
- OliverW CPharrG M 2004 J. Mater. Res. 19 3 http://dx.doi.org/10.1557/jmr.2004.19.1.3
- WangJ GChoiB WNiehT GLiuC T 2000 J. Mater. Res. 15 798 http://dx.doi.org/10.1557/JMR.2000.0114
- WrightW JSahaRNixW D 2001 Mater. Trans. JIM 42 642 http://dx.doi.org/10.2320/matertrans.42.642
- BeiHLuZ PGeorgeE P 2004 Phys. Rev. Lett. 93 125504 http://dx.doi.org/10.1103/PhysRevLett.93.125504
- GolovinY IIvolginV IKhonikV AKitagawaKTyurinA I 2001 Scr. Mater. 45 947
- GreerA LWalkerI T 2002 Mater. Sci. Forum 386–388 77
- SchuhC ANiehT G 2003 Acta Mater. 51 87 http://dx.doi.org/10.1016/S1359-6454(02)00303-8
- BhowmickRRaghavanRChattopadhyayKRamamurtyU 2006 Acta Mater. 54 4221 http://dx.doi.org/10.1016/j.actamat.2006.05.011
- GreerA LCastelleroAMadgeS VWalkerI TWildeJ R 2004 Mater. Sci. Eng. A 375–377 1182 http://dx.doi.org/10.1016/j.msea.2003.10.032
- SchuhC ALundA CNiehT G 2004 Acta Mater. 52 5879 http://dx.doi.org/10.1016/j.actamat.2004.09.005
- SpapenF 1997 Acta Metall. 25 40
- ArgonA S 1979 Acta Metall. 27 47 http://dx.doi.org/10.1016/0001-6160(79)90055-5
- JiangW HAtzmonM 2003 J. Mater. Res. 18 755 http://dx.doi.org/10.1557/JMR.2003.0103
- KovácsZ SCastelleroAGreerA LLendvaiJBariccoM 2004 Mater. Sci. Eng. A 387–389 1012 http://dx.doi.org/10.1016/j.msea.2004.03.089
- BurgessTLawsK JFerryM 2008 Acta Mater. 56 4829 http://dx.doi.org/10.1016/j.actamat.2008.05.039
- MukhopadhyayN KPauflerP 2006 Int. Mater. Rev. 51 209 http://dx.doi.org/10.1179/174328006X102475
- ParkJ MChangH JHanK HKimW TKimD H 2005 Scr. Mater. 53 1 http://dx.doi.org/10.1016/j.scriptamat.2005.03.024
- OliverW CPharrG M 1992 J. Mater. Res. 7 1564 http://dx.doi.org/10.1557/JMR.1992.1564
- XingL QHufnagelT CEckertJLöserWSchultzL 2000 Appl. Phys. Lett. 77 1970 http://dx.doi.org/10.1063/1.1313255
- SordeletD JRozhkovaEBesserM FKramerM J 2002 Appl. Phys. Lett. 80 4735 http://dx.doi.org/10.1063/1.1488686
- JacovkisDXiaoYRodriguez-ViejoJClavaguera-MoraM TClavagueraN 2004 Acta Mater. 52 2819 http://dx.doi.org/10.1016/j.actamat.2004.02.028
- GaoM CGuobFPoonS JShifletG J 2008 Mater. Sci. Eng. A 485 532 http://dx.doi.org/10.1016/j.msea.2007.08.009
- ChangH JKimW TKimD H 2005 Mater. Sci. Forum 475–479 3409
- TsaiA PKamiyamaTKawamuraYInoueAMasumotoT 1997 Acta Mater. 45 1477 http://dx.doi.org/10.1016/S1359-6454(96)00268-6
- TsaiA P 2008 Sci. Technol. Adv. Mater. 9 013008 http://dx.doi.org/10.1088/1468-6996/9/1/013008
- YanMZouJShenJ 2006 Sci. Technol. Adv. Mater. 7 806 http://dx.doi.org/10.1016/j.stam.2006.11.009
- KeltonK FCroatT KGangopadhyayA KXingL QGreerA LWeylandMLiXRajanK 2003 J. Non-Cryst. Solids 317 71 http://dx.doi.org/10.1016/S0022-3093(02)02004-5
- BuschRBakkeEJohnsonW L 1998 Acta Mater. 46 4725 http://dx.doi.org/10.1016/S1359-6454(98)00122-0
- WangH RGaoY LYeY FMinG HChengYTeng X Y 2003 J. Alloys Compd. 353 200 http://dx.doi.org/10.1016/S0925-8388(02)01208-2
- OthmanAAmerHOsmanM ADahshanA 2005 J. Non-Cryst. Solids 351 130 http://dx.doi.org/10.1016/j.jnoncrysol.2004.09.029
- KhonikV AKitagawaKMoriiH 2000 J. Appl. Phys. 87 8440 http://dx.doi.org/10.1063/1.373560
- InoueA 1998 Bulk Amorphous Alloys Zurich Trans Tech Publications
- NishiyamaNInoueA 1999 Acta Mater. 47 1487 http://dx.doi.org/10.1016/S1359-6454(99)00030-0
- GerberichW WNelsonJ CLilleoddenE TAndersonPWyrobekJ T 1996 Acta Mater. 44 3585 http://dx.doi.org/10.1016/1359-6454(96)00010-9
- GouldstoneAKohH JZengK YGiannakopoulosA ESureshS 2000 Acta Mater. 48 2277 http://dx.doi.org/10.1016/S1359-6454(00)00009-4
- KramerD EYoderK BGerberichW W 2001 Phil. Mag. A 81 2033 http://dx.doi.org/10.1080/01418610108216651
- PangMBahrD F 2001 J. Mater. Res. 16 2634 http://dx.doi.org/10.1557/JMR.2001.0362
- ZarudiIZhangL CSwainM V 2003 Appl. Phys. Lett. 82 1027 http://dx.doi.org/10.1063/1.1541110
- EshlbyJ DPruttP L 1956 Acta Metall. 4 560 http://dx.doi.org/10.1016/0001-6160(56)90056-6
- ParkJ MKimY CKimW TKimD H 2004 Mater. Trans. 42 595 http://dx.doi.org/10.2320/matertrans.45.595
- YangFGengKLiawP KFanGChooH 2007 Acta Mater. 55 321 http://dx.doi.org/10.1016/j.actamat.2006.06.063
- ZhangYGreerA L 2000 Appl. Phys. Lett. 89 071907 http://dx.doi.org/10.1063/1.2336598
- MasumotoTMaddinR 1971 Acta Metall. 19 725 http://dx.doi.org/10.1016/0001-6160(71)90028-9
- DonovanP EStobbsW M 1981 Acta Metall. 29 1419 http://dx.doi.org/10.1016/0001-6160(81)90177-2
- MegusarJArgonA SGrantN JKearB HGiessenB CCohenM 1982 Rapid Solidified Amorphous and Crystalline Solids Amsterdam Elsevier