Abstract
We outline the ability of zinc phosphate coatings, obtained by chemical conversion, to protect mild steel rebars against localized corrosion, generated by chloride ions in alkaline media. The corrosion resistance of coated steel, in comparison with uncoated rebars and coated and uncoated steel rebars embedded in mortar, were evaluated by open-circuit potential, potentiodynamic polarization, cronoamperometry and electrochemical impedance spectroscopy. The coated surfaces were characterized by x-ray diffraction and scanning electron microscopy. First, coated mild steel rebars were studied in an alkaline solution with and without chloride simulating a concrete pore solution. The results showed that the slow dissolution of the coating generates hydroxyapatite Ca10(PO4)6(OH)2. After a long immersion, the coating became dense and provided an effective corrosion resistance compared with the mild steel rebar. Secondly, the coated and uncoated steel rebars embedded in mortar and immersed in chloride solution showed no corrosion or deterioration of the coated steel. Corrosion rate is considerably lowered by this phosphate coating.
Introduction
Steel rebars in concrete are protected against corrosion by an oxide protective layer, called the passive layer, formed by the alkalinity of a concrete pore solution (pH close to 13). The localized attack of this protective layer leads to an expansion in the cross section of the reinforcement due to the formation of high-volume corrosion products. This process can lead to the cracking or spalling of concrete and a dangerous loss of structural stability. The most common cause of the corrosion of marine structures, marine garages, and bridge decks is attack of chlorides present in salts. The effect of Cl− ions in depassivating steel surfaces even at high pH can be seen as a function of the net balance between two competing process: the stabilization (and repair) of the film by OH− ions and the damage of the film by Cl− ions [Citation1].
Thus, many studies have been performed to determine the best method of preventing corrosion in reinforcing bars [Citation2, Citation3]. Among the possible anticorrosion methods, the use of phosphated reinforcing bars is commonly employed to extend the lifetime of such rebars in concrete structures [Citation2, Citation4]. The literature shows that the alkaline stability of phosphate coatings depends on their chemical composition and crystal structure [Citation5]. These phosphate coatings are generally composed of hopeite
and phosphophyllite
. Hopeite has a higher alkaline solubility than phosphophyllite [Citation6–10]. Thus, alkaline solutions first dissolve the coating composed of hopeite. Then, the dissolution continues for layers rich in iron and those mainly composed of phosphophyllite [Citation11].
There are few published fundamental studies of the alkaline stability of the phosphate coating, particularly in Ca2+-saturated solution.
The aim of this work is to develop zinc phosphate coatings on reinforcing bars to study their stability and corrosion behaviour in alkaline solutions. Synthetic media, saturated with Ca2+ ions, was used to simulate the aqueous solution existing in concrete pores at early stages, and chloride ions were added to simulate degraded concrete. These tests, in simulated concrete pore solutions are necessary to understand the protection ability of zinc phosphate coatings, prior to their application on reinforcing bars embedded in concrete.
Experimental
Substrate and coating
Experiments were conducted using mild steel bars (with 0.2 wt.% C, and with a diameter of 8 mm), denoted MS. The phosphated surface (denoted PMS) was approximated as a cylinder with a height of 2 cm corresponding to a surface area of 5.5 cm2. The surfaces were chemically pickled with 36.5% HCl for 1 min, and then rinsed 3 times with deionized water. After rinsing, the samples were immersed in a phosphating bath. Chemical conversion treatment (denoted CC) was performed in the phosphating bath (pH=2.1) for 10 min at 55 °C. The bath composition is given in table 1. After the phosphate treatment, the samples were rinsed with deionized water and dried in ambient air.
Composition and pH of the phosphating bath.
Electrolytes
The PMS and MS samples were immersed in alkaline solutions simulating the concrete interstitial electrolyte at ambient temperature (table 2). A saturated calcium hydroxide (denoted S) solution was used to simulate the aqueous alkaline content of the concrete pore solutions, with an approximate pH of 12.6. To simulate the aqueous phase of concrete contaminated by chloride, 35 g L−1 NaCl was added to the S solution to obtain an electrolyte denoted SC. The pH of the solution containing chloride was 12.5.
Description of various electrolytes used.
Reinforced mortar specimens
The coated and uncoated steel rebars were embedded in standard mortar (water/cement=0.5). The composition of this mortar is given in table 3.
Composition of mortar.
The samples were defined of their dimensions in a way representative of actual structures. They were cylinders of 30 mm diameter and 90 mm height (figure ).
Figure 1 Reinforced mortar specimen.
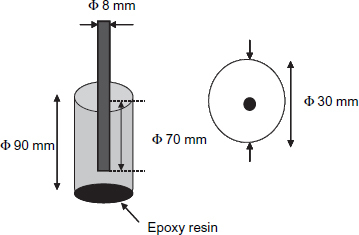
After mixing water, cement and sand, the paste produced was poured into a PVC moulding in which a coated or uncoated mild steel, was placed according to its longitudinal axis. The samples were compacted using a vibrating table for 60 s, then dried in air for 28 days. After the samples were removed from the PVC moulding, an epoxy resin coating was applied to the lower face of the sample to ensure the infiltration of the solution only through the lateral surface.
Electrochemical measurements
Different electrochemical techniques were used to evaluate the corrosion behaviour of the PMS and MS samples: open-circuit potential (denoted Ecorr), and potentiodynamic polarization measurements, and electrochemical impedance spectroscopy (EIS). Ecorr was monitored for 8 days. Polarization curves (I=f(E)) were plotted at a scan rate of 0.1 mV s−1 from −100 mV to 1000 mV versus Ecorr in the anodic direction. EIS was carried out at a corrosion potential with a frequency variation between 100 kHz and 0.01 Hz and a potential sine signal of 10 mV. Impedance data were fitted using ZImp software.
The reinforced mortar specimens were immersed in sodium chloride solution (3.5%). Corrosion was accelerated by an imposed potential of 400 mV SCE−1 [Citation1] and current density was monitored by cronoamperometry for 8 days.
Surface analysis
The morphology and coating compositions were studied by scanning electron microscopy (SEM) in the secondary electron imaging (SEI) and energy dispersive spectroscopy (EDS) modes. The coating crystallographic structure was analysed by x-ray diffraction (XRD) analysis using CuK−L(2,3) radiation.
Results and discussion
Morphology and composition of the coating
The SEM shows that the coating is compact, well-crystallized and completely covers the steel surface (figure ). The structure is characterized by small needles with sizes up to 8 μm. The EDS shows that the coating composition is 60 wt.% zinc and 9 wt.% phosphorus (table 4).
Figure 2 SEM images of mild steel coated surface.

PMS composition.
The x-ray diffraction analysis performed on the coated steel indicates the presence of two phases: hopeite
and phosphophyllite
(figure ). The presence of the phosphophyllite phase is related to the MS dissolution in the acid bath (pH=2.2) during the phosphate treatment [Citation12–14]. According to Donofrio [Citation6], the possible reactions (equations (1) and (2)) for the hopeite and phosphophyllite formations are
(1)
(2)
Figure 3 X-ray diffraction pattern of PMS.

Corrosion behaviour in alkaline medium (pH 12.6)
Corrosion potential evolution
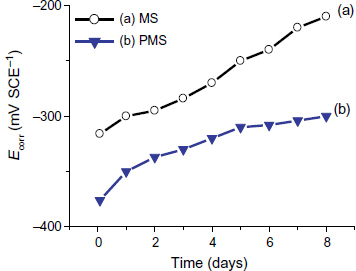
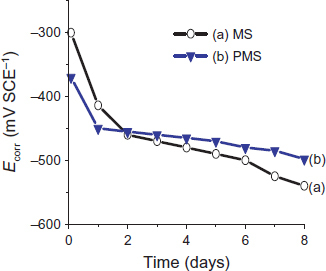
The Ecorr monitoring of the PMS and MS samples shows a trend toward values higher than those recorded during the immersion. For the MS sample (figure (a)), the corrosion potential after passivation is approximately −250 to −300 mV SCE−1 [Citation15]. Thus, after three days of immersion in the S solution, Ecorr is stabilized in the passive region throughout the test period. For the coated steel, Ecorr increases to −300 mV SCE−1 This indicates a slow dissolution of the coating without resulting in uncovered steel zones. Indeed, the coating is dissolved rapidly in NaOH/KOH solutions [Citation5]; in our medium, the presence of calcium is responsible for the slow dissolution of the coating and for the obtained trend of the corrosion potential curves.
Figure 4 Ecorr evolution for (a) MS and (b) PMS in S solution.
Polarization curves
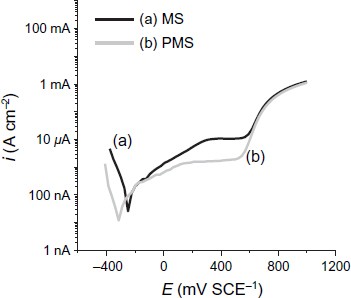
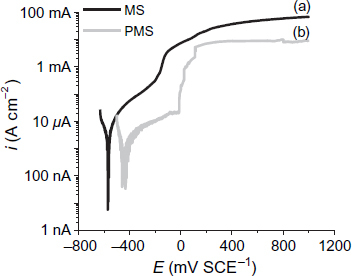
Figure shows the polarization curves of the PMS and MS specimens after 8 days of immersion in the S solution. It is shown that an extended passive region exists in the anodic polarization part for the uncontaminated chloride solution. This region starts immediately after Ecorr and continues up to the pitting potential (Epit) at ∼560 mV SCE−1 (for both specimens). PMS has a lower passive current density (about 0.8 μA cm−2) than MS (about 8 μA cm−2) (table 5). PMS has a lower current density that MS, which can be related to the difference in nature between their passive layers, because a zinc phosphate coating is applied on the surface. It can be concluded that PMS in a Ca2+-saturated solution has a higher stability than MS, and that the zinc phosphate coating has an extra corrosion resistance to MS after 8 days of immersion.
Figure 5 Polarization curves for MS and PMS after 8 days of immersion in S solution.
Corrosion potentials, current densities (at corrosion potential) and pitting potentials of MS and PMS specimens after 8 days of immersion in S solution.
Electrochemical impedance spectroscopy
The electrochemical impedance diagrams, at the corrosion potential, are obtained by EIS after 2 h, and 1, 4, 6 and 8 days of steel and coated steel immersions.
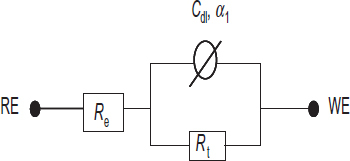
For the untreated steel, Nyquist plots and Bode diagrams are respectively presented in figures (a) and (b). The electrical parameters obtained through fitting EIS data using an electric equivalent circuit R(QR) are listed in table 6. The proposed electric equivalent circuit is given in figure where Re∼190 Ωcm2 corresponds to the electrolyte resistance, while Cdl and Rt, respectively, represent the double-layer capacitance and charge transfer resistance of the steel/solution interface.
Figure 6 (a) Nyquist diagram and (b)–(c) Bode diagrams of MS from 2 h to 8 days of immersion in S solution: experimental values (dots) and fitted values (solid lines).
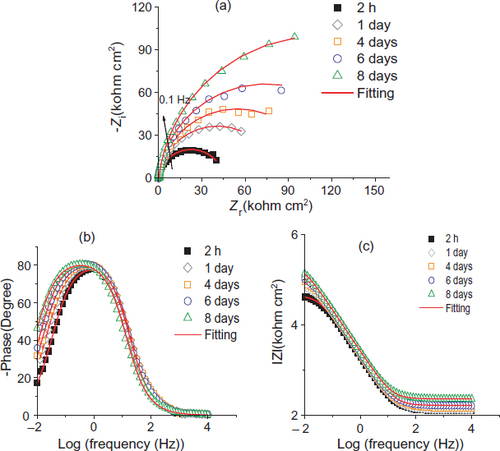
Figure 7 Equivalent circuit used for modelling the EIS data.
Electrical parameters for MS immersed in S solution obtained through fitting EIS data.
The above representations show one capacitive loop whose diameter increases with the time of immersion. Thus, Rt increases simultaneously with a decrease in Cdl. These evolutions characterize the blocking increase in the extent of charge transfer at the steel surface and the decrease in the area of the contact surface related to passive film formation.
Nyquist plots and Bode diagrams of the coated steel (PMS) are represented in figure . These EIS diagrams show two capacitive loops, even though one capacitive loop is clearly visible. Indeed, if we use a single circuit consisting of R and C in parallel, the electrical parameters obtained through fitting EIS data gives a systematic variation, indicating that the R(QR) model is not adequate for this case. The first three diagrams were modelled by an electric equivalent circuit with two time constants R(Q(R(QR))) shown in figure (a), and the last two diagrams were modelled by the proposed electric circuit R(Q(R(Q(RW)))) shown in figure (b). In this case, the increase in film resistance (RF) suggests the formation of a protective layer causing a decrease in the area of the active steel surface. In conjunction with this phenomenon, there is a capacity film reduction (CF) that leads to a film thickness increase (equation (3)) expressed as
(3)
where ε0 is the vacuum permittivity (8.85×10⁻¹⁴ F cm−1), εr is the dielectric constant, A the active surface and d the thickness of film.
Figure 8 Nyquist (a) and (b)–(c) Bode diagrams of PMS from 2 h to 8 days of immersion in S solution: experimental values (dots) and fitted values (solid line).
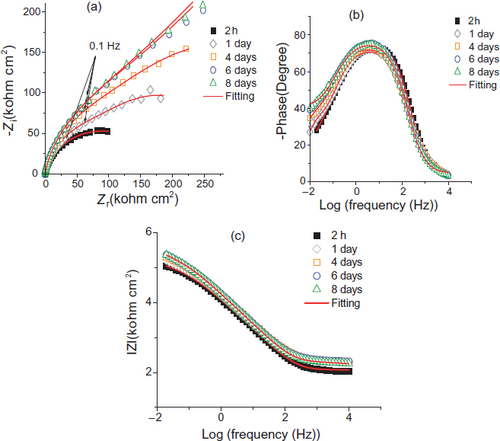
Figure 9 Equivalent circuit used for modelling the EIS data of PMS up to (a) 4 and (b) 6–8 days.
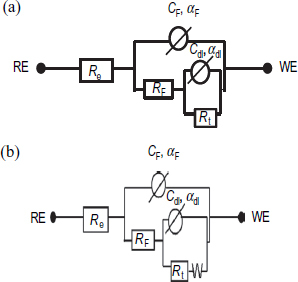
Indeed, these parameters indicate the existence of two time constants associated with two electric circuits: RFCF and RtCdl. After four days of immersion, other elements relating to Warburg diffusion was observed [Citation16, Citation17].
SEM images (figure ) and results of the surface analyses (EDS and XRD) of the coated steel after 8 days of immersion in S solution reveal a different morphology for this protective coating. Crystal size decreases considerably during the 8-day immersion in a solution of pH 12.6. Indeed, even after one day of immersion, we observe the dissolution of zinc phosphate coating and the germination of small crystals.
Figure 10 SEM images of PMS after 8 immersion days in S solution: (a) 200 and (b) 20 μm scales.
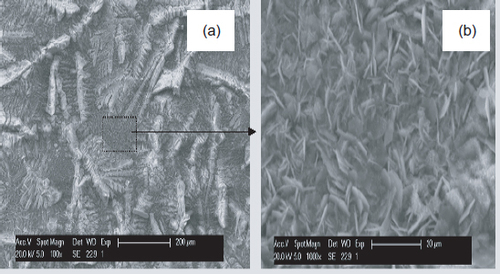
During the eight days of immersion, the larger crystals remains unchanged morphologically, but were covered uniformly by small hexagonal plates (figure (b)). EDS analysis shows that, after 8 days of immersion, the coating became composed of P, Ca, Fe and very little Zn (figure ).
Figure 11 EDS composition of PMS after 8 days of immersion in S solution.
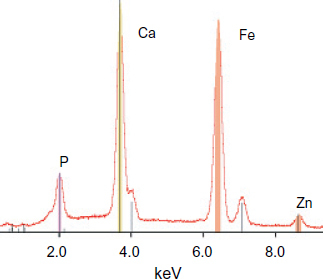
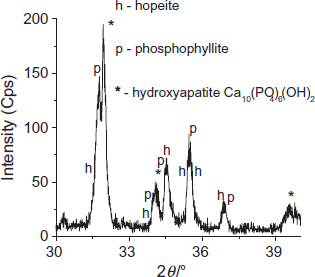
The XRD analysis of these crystals (figure ) shows the presence of low-intensity lines, related to the formation of small hexagonal crystals composed of hydroxyapatite Ca10(PO4)6(OH)2. This compound is stable in alkaline media (pH=11–13), as was shown by Shih et al [Citation18].
Figure 12 X-ray diffraction pattern of coated steel after 8 days of immersion in S solution.
SEM observations and surface analyses (EDS and XRD) confirm the electrochemical impedance results and show that the changes at the coated steel surface improve the anticorrosive properties of the coating obtained by chemical conversion.
Corrosion behaviour in alkaline medium contaminated by chloride (SC)
Corrosion potential evolution
Figure shows the Ecorr evolution of the PMS and MS samples during the immersion in an alkaline medium contaminated by chloride. The Ecorr of MS samples decreases (figure (a)) and stabilizes to −550 mV SCE−1 after 8 days of immersion. This evolution corresponds to an active state of the steel. For the coated steel, the decrease in Ecorr is slower and after 2 days of immersion, the Ecorr values are slightly higher than those of MS.
Figure 13 Ecorr evolution for (a) MS and (b) PMS in SC solution.
The comparison of these results with Ecorr evolution measured in the S solution (figure ) shows that the PMS sample is subject firstly to coating deterioration by medium alkalinity, and secondly to steel corrosion through open pores of the coating.
Polarization curves
The polarization curves of both PMS and MS samples after 8 days of immersion in the SC solution are shown in figure . A potential shift of 110 mV is observed between the coated and uncoated steels.
Figure 14 Polarization curves for MS and PMS after 8 days of immersion in SC solution.
Increases in passive current density with the modified pitting potential from 560 to −80 mV SCE−1 (for MS) and from 556 to −20 mV SCE−1 (for PMS) were observed. The drop of one decade in current density at the corrosion potential of PMS with respect to that of MS shows the positive role of the zinc phosphate coating obtained by CC. The measured current density (at corrosion potential) reaches a reproducible value of 2 μA cm−2 (table 7).
Corrosion potentials, current densities (at corrosion potential) and pitting potentials of MS and PMS samples after 8 days of immersion in SC solution.
In conclusion, after 8 days of immersion in the SC solution, PMS shows a lower current density than MS, and decreases the pitting susceptibility by increasing pitting potential at about 160 mV compared with MS.
EIS
The electrochemical impedance diagrams (Nyquist and Bode) of the steel and coated steel obtained at the corrosion potential after 1 and 8 days of immersion in the SC solution are shown in figure . These diagrams present one capacitive loop for steel and two non-decoupled capacitive loops for the coated steel. The equivalent electrical circuit indicating the all phenomena detected during the 8-day immersion has one time constant for the steel (figure ) and two time constants for the coated steel (figure (a)). The electrical parameters obtained after modelling EIS data are listed in table 8.
Figure 15 Nyquit and Bode diagrams of MS and PMS, experimental values (dots) and fitted values (solid line), after (a) 1 and (b) 8 days of immersion in SC solution.
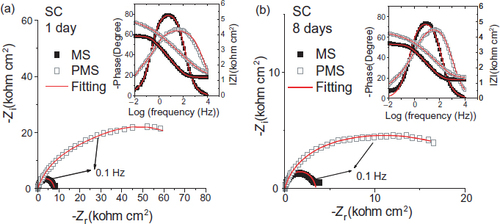
Electrical parameters of MS and PMS immersed in SC solution obtained by fitting EIS data.
The impedance diagram evolution (figure ) with immersion time shows that the chloride presence in the SC solution simultaneously results in a competition between the formation and local destruction of the film obtained by the slow coating dissolution. This classical corrosion mechanism leads to an Rt decrease and an increase in the double layer capacitance Cdl Note that during immersion, for PMS samples, Rt remains higher than that for MS samples. RF is the electrical resistance of ion transfer through open coating pores. It decreases with time: this evolution corresponds to electrolyte diffusion into the coating pores.
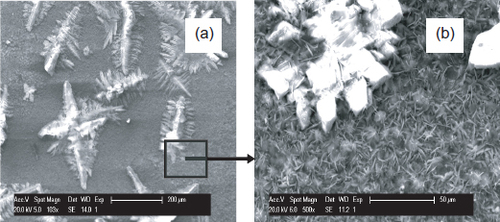
In the case of PMS, the film morphology is similar to that observed in the absence of chloride ions (figure ) and the x-ray diffraction pattern shows the presence of hydroxyapatite Ca10(PO4)6(OH)2 Thus, hydroxyapatite formation occurs even in the presence of chloride ions (figure ). Compared with that of MS, the formation of this film due to the slow dissolution of the coating deposited before, leads to a better protection of the steel, as shown by EIS diagrams (figure ).
Figure 16 SEM images of PMS after 8 immersion days in SC solution: (a) 200 and (b) 50 μm scales.
Corrosion behaviour in concrete
Figure shows the evolution of the current density of the two reinforced mortar specimens (PMS and MS). At the beginning of the tests, the pH in the vicinity of the rebars embedded in mortar exceeds 12. For the mild steel embedded in mortar, the evolution of corrosion current density icorr (figure (a)) shows that at the beginning of immersion, almost constant values less than 1 μA cm−2 are obtained. After 95 h of immersion, an increase in icorr occurs up to 0.4 mA cm−2. These values show that at the beginning of the tests, the steel is in a passive state, whereas after ∼4 days of immersion, it is in an active corrosion state (icorr>1 μA cm−2).
Figure 17 Current density evolution of (a) MS and (b) PMS embedded in mortar.
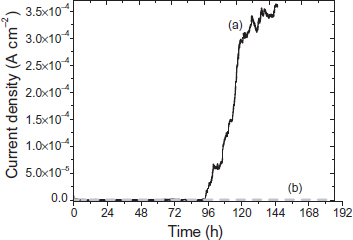
The increase in current density shows that the concentration of chloride at the steel/concrete interface exceeds the critical threshold [Cl−]/[OH−]=0.6 which leads to the start of corrosion and the accumulation of corrosion products [Citation19, Citation20]. These corrosion products generate micro- and macro-cracks in concrete [Citation1]. Thus, after 120 h of immersion, these cracks and disseminated corrosion products become visible to the naked eye (figure ). The coated sample has icorr<0.5 μA cm−2 throughout the test. These results show that the phosphated surface plays an important role in protecting against steel and concrete damage. The coating aspect after this test (figure (b)) shows no rust or localized attack on the coated steel. The SEM images of the PMS sample show the formation of small hexagonal crystals at the phosphate coating/concrete interface (figure ). These crystals are identical to those observed in a simulated concrete solution contaminated by chlorides. Results of the EDS show that these crystals are composed of P, O and Ca (figure ).
Figure 18 MS embedded in mortar after 144 h of immersion in 3.5% NaCl solution and at an imposed potential of 400 mV SCE−1.

Figure 19 (a) MS and (b) PMS observations after removal of the mortar.
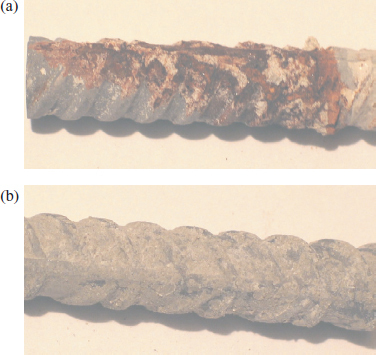
Figure 20 SEM images of mild steel coated surface after removal of mortar.

Figure 21 EDS composition of PMS after removal of mortar.

Indeed, EDS confirms that the zinc phosphate coating protects the reinforcement and delays the initiation of its corrosion when the interstitial concrete pore solution is contaminated by chlorides. Thus, the tests here revealed the potential of phosphate treatment in concrete rebar protection.
Conclusion
New protective coatings have been developed by chemical conversion (CC) in reinforcing bars to prevent its corrosion in concrete. The coatings obtained using the phosphate process are composed of two phases: hopeite and phosphophyllite.
In alkaline solutions with or without chloride, a phosphated mild steel sample (PMS) is more resistant than mild steel (MS) alone. Indeed, this study showed that, during the first immersion days in alkaline media (pH=22.6), a slow dissolution of the coating occurs. Zinc phosphate coating dissolution is accompanied by hydroxyapatite Ca10(PO4)6(OH)2 formation. Hydroxyapatite appears with formation of a phosphate layer, a dense and protective coating.
In a chloride ion solution, at very high concentration exceeding the chloride threshold accepted for steel corrosion in alkaline media ([Cl−]/[OH−]>0.6). The hydroxyapatite film resulting from phosphate coating dissolution contributes to the reduction in chloride aggressiveness and provides an effective protection against the corrosion of steel reinforcement.
References
- AssouliBSimescuFDebickiGIdrissiH 2005 NDT&E Int. 38 682 http://dx.doi.org/10.1016/j.ndteint.2005.04.007
- MannaMChakrabartiIBandyopadhyayN 2006 Surf. Coat. Technol. 201 1583 http://dx.doi.org/10.1016/j.surfcoat.2006.02.041
- MannaMBandyopadhyayNBhattacharjeeD 2008 Surf. Coat. Technol. 202 3227 http://dx.doi.org/10.1016/j.surfcoat.2007.07.001
- BikulčiusGGirčieneOBurokasV 2003 Russ. J. Appl. Chem. 76 1759 http://dx.doi.org/10.1023/B:RJAC.0000018678.02146.d7
- WengDJokielPUebleisAB 1996 Surf. Coat. Technol. 88 147 http://dx.doi.org/10.1016/S0257-8972(96)02860-5
- DonofrioJ 2000 Met. Finish. 98 57 http://dx.doi.org/10.1016/S0026-0576(00)80392-X
- OgleKMeddahiNTomandlAWolpersM 2003 Proc. 1st Int. Surface Treatments Institute of Franche-Comté Conf. Automotive Industry, France
- OgleKTomandlAMeddahiNWolpersM 2004 Corros. Sci. 46 979 http://dx.doi.org/10.1016/S0010-938X(03)00182-3
- TomandlAWolpersMOgleK 2004 Corros. Sci. 46 997 http://dx.doi.org/10.1016/S0010-938X(03)00183-5
- LiG YNiuL YLianJ SJiangZ H 2004 Surf. Coat. Technol. 176 215 http://dx.doi.org/10.1016/S0257-8972(03)00736-9
- ShoeibMFaroukMHannaF 1997 Met. Finish. 95 62 http://dx.doi.org/10.1016/S0026-0576(97)85862-X
- KouisniLAzziMZertoubiMDalardFMaximovitchS 2004 Surf. Coat. Technol. 185 58 http://dx.doi.org/10.1016/j.surfcoat.2003.10.061
- JegannathanSSankara NarayananT S NRavichandranKRajeswariS 2006 Surf. Coat. Technol. 200 4117 http://dx.doi.org/10.1016/j.surfcoat.2005.04.022
- SinhaP KFeserR 2002 Surf. Coat. Technol. 161 158 http://dx.doi.org/10.1016/S0257-8972(02)00521-2
- AndradeCKeddamMNovoaX RPerezM CRangelC MTakenoutiH 2001 Electrochim. Acta 46 3905 http://dx.doi.org/10.1016/S0013-4686(01)00678-8
- MeroufelADeslouisCTouzainS 2008 Electrochim. Acta 53 2331 http://dx.doi.org/10.1016/j.electacta.2007.09.056
- RoutT KBandyopadhyayNVenugopalanT 2006 Surf. Coat. Technol. 201 1022 http://dx.doi.org/10.1016/j.surfcoat.2006.01.027
- ShihWChenYWangSLiWHonMWangM 2005 J. Cryst. Growth 285 633 J http://dx.doi.org/10.1016/j.jcrysgro.2005.08.042
- IdrissiHLimamA 2003 NDT&E Int. 36 563 http://dx.doi.org/10.1016/S0963-8695(03)00064-1
- HuetBL'HostisVSantariniGFeronDIdrissiH 2007 Electrochim. Acta 49 1918