Abstract
This article presents the results of a project to 3D laser scan and digitally model 14 watercraft from the Qatar Museums collection, comprising a range of regional vessels: most had not been surveyed previously. The project used the resulting point clouds generated 2D naval lines and orthographic records of the vessels in their current condition, and photorealistic 3D digital models for gallery display. This case study provides illustrative examples of the intermediate stages and final outputs. It assesses the pros and cons of 3D laser scanning as a survey technology for nautical scholars in terms of the time, cost, and skillset, as well as logistical considerations. It also compares the accuracy of traditional hand survey methods.
摘要
从-船厂到博物馆:多哈的卡塔尔博物馆馆藏-舶的3D激光扫描与数字建模
本文介绍了卡塔尔博物馆馆藏14艘船-3D激光扫描和数字模型项目的研究成果。这14艘-中包含了-部分本地船只:它们其中大部分之前都未经调查。该项目使用点云结果生成2D型线图和当前条件-船只的正投影记录以及用于展厅演示的真实感的3D数字模型。这一研究还给出了中-过程以及最终输出的图示例证。同时此项目评估-3D激光扫描作-一种调查技术手段对海洋学者-言, 在时间、成本、技能以及后勤保障方面的优缺点, 并比较-传统人工调查方法的准确性。
從造船廠到博物館:多哈的卡塔爾博物館館藏-舶的3D激光掃描與數字建模
本文介紹了卡塔爾博物館館藏14艘船-3D激光掃描和數字模型項目的研究成果。這14艘-中包含了-部分本地船只:它們其中大部分之前都未經調查。該項目使用點雲結果生成2D型線圖和當前條件-船只的正投影記-以及用于展廳演示的真實感的3D數字模型。這一研究還給出了中-過程以及最終輸出的圖示例證。同時此項目評估-3D激光掃描作爲一種調查技術手段對海洋學者-言, 在時間、成本、技能以及後勤保障方面的優缺點, 並比較了傳統人工調查方法的准確性。
Abstracto
De Varadero a museo: escaneo laser 3D y modelaje digital de la colección de embarcaciones de los Museos de Qatar, Doha, Qatar
Este artículo presenta los resultados de un proyecto para el escaneo laser y el modelaje digital de catorce embarcaciones de las colecciones de los Museos de Qatar. Las embarcaciones comprenden una gama de bracos regionales. La mayoría no han sido registrados previamente. El proyecto utilizó las nubes de puntos resultantes para generar líneas navales en 2D, registro en ortoimágenes de las embarcaciones en sus condiciones actuales y modelos foto‐realistas digitales en 3D para exhibición en galerías. Este estudio de caso provee un ejemplo ilustrativo de las etapas intermedias y los resultados finales. Se evalúan las ventajas y desventajas del escaneo laser en 3D como tecnología de investigación para los académicos navales en términos de tiempo, costo y habilidades, así como las consideraciones logísticas También se compara el escaneo 3D con la precisión de los métodos de registro tradicional manual.
Traducción: Ricardo Borrero L
ملخص
It is more than three decades since the first 3D computer‐generated visualizations were created for archaeological purposes (Wittur, Citation2013: 3), and almost a quarter of a century since active sensors such as 3D laser scanners were first deployed in archaeological and heritage fieldwork (Guidi, Citation2014: 37). However, as recently as a decade ago, one of the pioneers of the field, Maurizio Forte, was able to describe fieldwork using 3D technologies as ‘still considered experimental’ and ‘quite rare’ (Forte, Citation2008: 23). In the realm of heritage boat recording, a combination of cost, a knowledge deficit, together with logistical considerations have persisted in limiting its application, whether in archaeological, museum, or ethnographic contexts, to a relatively small group of scholars with developed expertise, despite the fact that the size and complexity of watercraft lend them well to this recording methodology. That said, falling costs, technical advances, and growing literacy are starting to make this technology accessible. As a result, a still small but increasing number of maritime heritage projects have now deployed 3D laser scanners in a bid to record watercraft. However, the published record remains extremely sparse, and familiarity with the technique is limited to a relatively small number of practitioners who have developed this expertise. In this article, we present and assess as a case study the process of 3D laser scanning of boats as it was conducted during a project to survey and subsequently digitally model 14 vessels in the ethnographic collection of the Qatar Museums (QM), Doha. We assess the methodological and logistical challenges encountered in working with a laser scanner in the field, and consider the ongoing challenges of producing accessible and effective outputs from the underlying point‐cloud data. The project also presents an opportunity to appraise the merits of this approach relative to conventional low‐tech methods, such as using hand tapes and plumb bobs, which remain both widely used by practitioners and taught to maritime archaeology students (Lipke et al., Citation1993; Anderson, Citation2004; Kentley et al., Citation2007; Chartered Institute for Archaeologists, Citation2014).
The experience of 3D laser scanning archaeological and/or historic watercraft has been with us for almost two decades, but has yielded limited and mixed results from the start. The first known endeavours were the in situ scanning of the Doel 1 cog found in Antwerp, Belgium, in 2000 (Van Hove, Citation2005; Haneca and Daly, Citation2014; Vermeersch and Haneca, Citation2015) and Moreton et al.’s experimental scanning of a West African logboat at the National Museums and Galleries of Merseyside, UK, around the same time (Moreton et al., Citation2000). Like many other early involvements of archaeology in 3D laser scanning, the Doel 1 work was conducted by a private contractor: computer processing power at that time struggled to cope with the quantity of survey data generated and—in a story that has come to be familiar to many subsequent 3D‐laser‐scanning projects—access to the raw data has since been compromised by software obsolescence (Jeroen Vermeersch, pers. comm.). Laser scanning was subsequently tried out on some of the grands projets of maritime archaeology: Vasa in Sweden, and Mary Rose in the United Kingdom. The former was scanned in 2002: once again, because of the proprietary software used and the very large size of the data, the resulting raw dataset remains unprocessed (Fred Hocker, pers. comm.). The interior of the Mary Rose was scanned in the same year as the Vasa using a Cyra laser scanner (Barker, Citation2009: 402; Marsden Citation2009: 19).Footnote1 In this case, line‐of‐sight restrictions dictated by the situation of the vessel in its Portsmouth dry dock, meant that the outer planking and what Barker (Citation2009: 402) calls ‘moulded surfaces’ could not be recorded: just five ‘cross sections’ through the obtained point cloud were used in the production of the final 2D construction drawings of the hull. Again, the limitations of the early technology were exposed. Meanwhile in Italy, scholars were around this time experimenting with the use of a Minolta Scan Vivid 9003D, laser scanning explicitly for reverse engineering purposes, albeit with half‐hull models rather than with full‐scale vessels (Caputo et al., Citation2003; Martorelli et al., Citation2006).
The problems of data size and securing of line‐of‐sight experienced in those early days remain familiar to 3D‐laser‐scanning projects conducted today. Nevertheless, the technology has continued to be applied by maritime museums, including Norway's Nordnorsk Fartøyvernsenter in Hellarbogen in 2010 (Anon, Citation2011; Gunnar Holmstad, pers. comm.); the Port Musée, Douarnenez, Brittany, France, in a joint venture with the National Maritime Museum, Cornwall, UK since 2012 (LaScanMar, Citation2013); HMS Victory in the Portsmouth Historic Dockyard, UK (Downland Partnership, Citation2014); and the National Maritime Museum, Gdańsk, Poland in the same year (Marcin Kłos, pers. comm.).
Despite this recent flurry of activity, few nautical survey projects that have deployed 3D laser scanners have yet published their results—still fewer in peer‐reviewed media. Exceptions include Caputo et al.’s boat‐model work (2003); the Traditional Boats of Ireland Project, which presents manipulable 3D images based on its 3D laser scans of traditional watercraft on its website (Citation57Traditional Boats of Ireland Project, nd; Mac Cárthaigh, Citation2008); CitationWellman’s in situ 2008 scan of the exposed hull of the George Olson in Oregon, USA (2008); and CitationVan de Noort et al.’s survey of a reconstruction based on the Bronze Age Ferriby boats (2014: 307–308). Meanwhile, Pat Tanner (pers. comm.) is preparing for publication the results of his 3D‐laser survey of the Poole logboat, Dorset, UK. Although not comprehensive, this list is indicative of the limited extent of publications on 3D laser scanning of watercraft, a situation that leaves the methodology and appraisal of 3D laser scanning as a technique unfamiliar to much of the nautical scholarly community, and justifies this case study. The fact that Anderson mentions laser scanning only fleetingly in the 2004 third edition of his Guidelines For Recording Historic Ships and Kentley et al. not at all in their 2007 book Recording Historic VesselsFootnote2 is indicative of how marginal the technique remained even a decade ago (Anderson, Citation2004; Kentley et al., Citation2007). Indeed, even the 2014 Standard and Guidance for Nautical Archaeological Recording and Reconstruction published by the UK's Chartered Institute for Archaeologists does not mention laser scanning as a possible boat‐recording technique.
A number of other nautical projects have, as an alternative to a static laser scanner, deployed a FaroArm co‐ordinate measuring unit to record individual dismantled ship's timbers in three dimensions. This approach produces point accuracy even greater than conventional laser scanning, but cannot easily cover the same area because of the physical limitations of reach inherent in deploying the arm. Projects to have deployed this approach include the Doel 1 and 2, Vasa Museum, and Traditional Boats of Ireland Project, as well as the Newport Ship project, Wales, UK (Vermeersch and Haneca, Citation2015: 114, Vermeersch et al., Citation2015: 328; Jones, Citation2009a; Citation2009b; Jones et al., Citation2013). Elsewhere, scholars working on the Yenikapı vessels in Istanbul, Turkey have been using a FaroArm since 2009 to produce a detailed 3D record of individual timbers (Özsait‐Kocabaş, Citation2011; Kocabaş, Citation2012: 13; Citation2014; Citation2015: 9).
The Newport Ship project, as well as the Drogheda boat project in Ireland, went on to model the performance of the vessel in question and produce an interpretive 3D digital model derived from the FaroArm data. They did so indirectly: first producing a physical 1:10‐scale model of the vessel remains based on the 3D prints derived from the FaroArm survey of the timbers, and then 3D laser scanning that model to produce digital models of the respective hulls (Jones and Nayling, Citation2011; Nayling and Jones, Citation2012; Citation2014: 265–266; Jones et al., Citation2013; Tanner, Citation2013a; Citation2013b).
The preceding overview is indicative of the potential and growing adoption of 3D‐laser‐scanning technology as both a documentary and an interpretive tool in nautical archaeology. As a ‘mass capture method’ (Andrews et al., Citation2009: 1), it promises previously unimaginable resolution in vessel survey compared to more conventional direct‐metric survey methods such as chain‐and‐offset or trilateration, based on tape measures and plumb lines that are, as Remondino (Citation2014: 13) describes them, ‘…subjective, time‐consuming, and applicable only to small areas’. It also generates an output that can be developed in multiple directions—for standard forms of 2D documentation, for performance modelling, for conservation and condition monitoring, and for interpretive museum display. Ideally, 3D laser scanning promises ‘highly realistic information and with a high scientific content’ (Forte and Silotti, Citation1997: 10). It was for all these reasons that QM—then the Qatar Museums Authority—invited the three of the authors (JPC, AW, CZ) to Doha in 2013 to scan and model its ethnographic collection of watercraft in their boatyard.
The QM collection
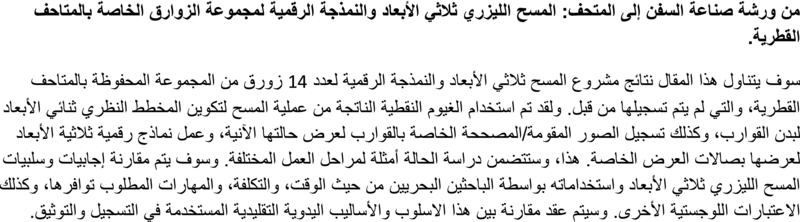
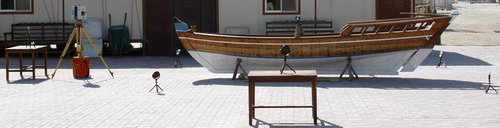
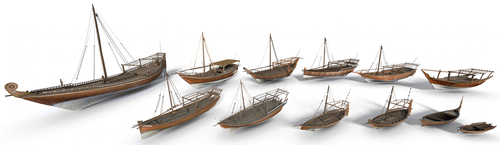
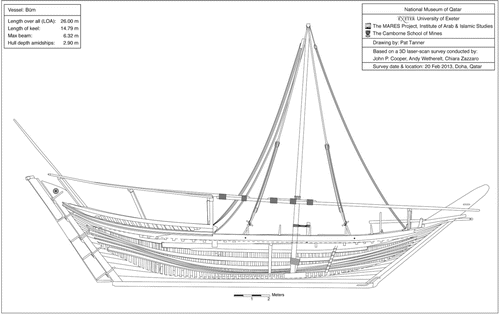
QM holds a large and growing ethnographic collection of wooden watercraft representing the seafaring traditions of Qatar, of the Arab littoral of the Persian Gulf, and of the sewn‐boat techniques of the western Indian Ocean region (Fig. 1). At the time of writing, the collection comprised some 21 plank‐built vessels and five small logboats, making it one of the largest and most important collections in the region. The vessels range in size from logboat hūrīs, of some 6m in length, to an interpretive reconstruction of a battīl measuring some 36m (Fig. 1n).
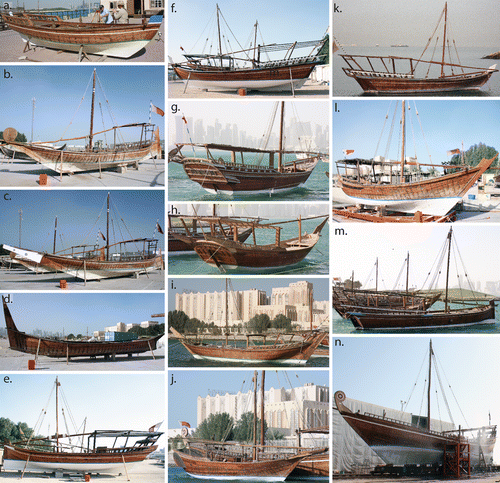
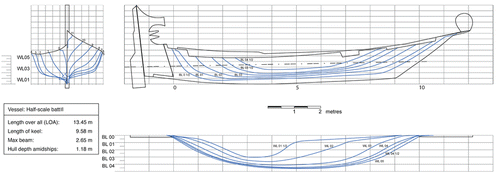
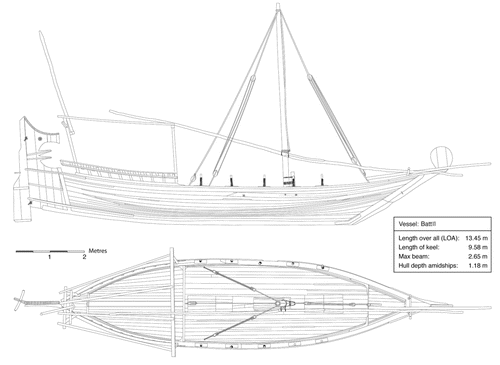
At the heart of the collection is a historic jālbūt named Fatḥ al‐Khayr (‘The Victory of Goodness’; Fig. 1m) that once belonged to Hamad bin Khalifa Al Thani (d.1948), the great‐grandfather of the current Qatari Emir, Tamim. It originated in Bahrain in the 1920s. The jālbūt type was typically used for coastal cargo transportation and fishing, but was also drafted into the annual pearling fleet (Jewell, Citation1976: 72; Hawkins, Citation1977: 135, 139; Howarth, Citation1977: 48; Anon., Citation1979: 133; Agius, Citation2002: 92–98; Citation2005: 17, 65, 100, 103, 107, 145, 151). The Fatḥ al‐Khayr is the only vessel in the collection that had been recorded at the level of individual timbers before the laser‐scan survey conducted by the present authors. This was by Piotr Dziamski and Norbert Weismann, whose conventional survey using tape measures, plumb bobs, curve moulds, etc, produced excellent orthographic drawings that remain unpublished (Fig. 2; Norbert Weismann, pers. comm.). Another prominent vessel is a 26m‐long būm, which QM dates to 1922 (Vosmer, Citation2011: 56–71; Fig. 1i). The būm was an ocean‐going vessel involved in coasting and the monsoon‐based trade between the Gulf, particularly Kuwait, on the one hand, and east Africa and India on the other (Villiers, Citation1969: 396–404; Jewell, Citation1976: 29–35; Hawkins, Citation1977: 35, 37–48; Howarth, Citation1977: 23–35; Anon., 1979: 127–128; Al‐Hijji, Citation2001: 21–24; Agius, Citation2002: 66–70; Citation2005: 93–98). Other notable vessels in the collection include half‐scale reconstructions of a battīl (Vosmer, Citation2011: 72–4; Fig. 1b) and a baggāra (Vosmer, Citation2011: 75–6; Fig. 1c), both built in Ras al‐Khaima, United Arab Emirates. These two vessels are significant to Qatari heritage narratives in that they represent pearling craft, although larger vessels of the same name were also used as ocean‐going cargo and slaving vessels, and as fighting craft (Jewell, Citation1976: 29–35; Vosmer, Citation1997; Al‐Hijji, Citation2001: 11–14; Agius, Citation2002: 19–22, 63–66, 105–107; Citation2005: 21–24, 43, 61, 56, 97, 103–104; Weismann et al., Citation2014). The collection also includes a second jālbūt, named al‐Jāzī, which was extensively restored in 2006–2007 (Vosmer, Citation2011: 12; Fig. 1e). An example of an Omani coastal fishing badan was recently added to the collection (Vosmer, Citation1997: 227–230; Agius, Citation2002: 98–105; Weismann et al., Citation2014: 415–416)(Fig. 1d). Other craft include a curved‐stemmed shūʿī (Fig. 1f); and a small sanbūq (Fig. 1k), both multi‐purpose fishing, coastal cargo and pearling craft (Howarth, Citation1977: 35–39; Anon., 1979: 131–132; Al‐Hijji, Citation2001: 15–16; Agius, Citation2002: 77–92; Citation2005: 43–44, 103–109; Vosmer, Citation2011: 82).Footnote3 Small craft in the collection include a bānūsh lighter (Fig. 1a)—another fluid term—and a fishing kēt (Agius, Citation2002: 42–43; Vosmer, Citation2011: 81). More recent acquisitions include vessels that QM identify as an ocean‐going ghanja, a large sanbūq, an abū būz, and a samʿa—all varieties of cargo, fishing and pearling vessel (Fig. 1g, h, j, and l respectively). Meanwhile, QM is gradually assembling an important collection of sewn boats: recent acquisitions include two kettuvalams from Kerala and five zārūqas acquired recently in Iran, but originating (it is understood) in Oman.
The older core of the QM collection was previously on public display afloat on a small salt‐water lake in front of Qatar's original National Museum, a former palace of the ruling family. That museum closed in the middle of the past decade in anticipation of the construction of a major new national museum around the original palace; this successor is currently under construction, and expected to open in late 2018; it will not house the boats themselves, which are kept on a temporary basis at a boatyard in the Doha old port area, with some of the vessels at anchor, and others on props on land. The yard, which is not open to the public, lies in an area that is earmarked for redevelopment. QM is currently considering its options with respect to the collection's future; these include building a dedicated maritime museum.
Project rationale
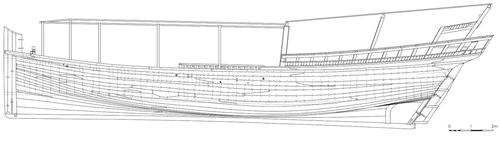
The new National Museum Qatar (NMQ) is part of a wider national cultural strategy to establish Qatar as ‘The Capital of Culture’ (Qatar Museums, Citation2014), and is the centrepiece of a national programme of high‐specification museum building that includes an already‐open Museum of Islamic Art and several art galleries.Footnote4 The new NMQ is the design of leading French architectural firm Ateliers Jean Nouvel (Fig. 3). The galleries within are being designed with a technology‐driven museum experience in mind, drawing on a broad range of media and interactive and immersive technologies. Watercraft in the QM collection are crucial to representations of Qatar's maritime heritage, and are to be presented in the museum galleries as three‐dimensional digital models set within interpretive animations.
The initial driver of the present project was therefore to produce the underlying 3D digital point clouds of the vessels upon which these gallery interpretations would rest. However, it was also the case, at the time the project was commissioned, that few of the vessels in the collection had been surveyed or documented in detail, and many not at all. Apart from Dziamski and Weismann's detailed drawings of the Fatḥ al‐Khayr (Fig. 2), Qatari naval architect Ahmed al‐Saiegh had also produced naval lines drawings and also basic orthographic projections of the profiles (only) of the Fatḥ al‐Khayr, the jālbūt ‘al‐Jāzī’, the large and small sanbūqs, the būm, the shūʿī, the half‐scale battīl, half‐scale baggāra, and the large battīl. None of these images have been published, although they are lodged with QM. Other vessels in the collection—including more recent acquisitions—had not been recorded at all. A further objective was therefore what Frischer and Dakouri‐Hild (Citation2008: v) calls ‘virtual preservation’: that is, to produce for the first time a detailed record of the collection for documentation, study, monitoring, and conservation purposes, thus meeting through a rapid mass‐capture method the recommendations of Article 16 of the Venice Charter with respect to ‘precise documentation … illustrated with drawings or photographs’ (International Council on Monuments and Sites, Citation1964). For the largest vessels in the collection—such as the būm and 36m‐long battīl—it also presented a potentially safer means of recording a vessel than by traditional chain‐and‐offset methods, where the risk of serious injury to the surveyor from falling becomes significant. Moreover, the project offered the prospect of gathering large quantities of metric data ‘within a timescale unmatched by direct techniques’ (Andrews et al., Citation2009: 2), and at much higher accuracy and resolution.
The project also explored ways of generating from the underlying point clouds 2D orthographic and naval lines drawings of the craft of a type familiar to nautical heritage specialists insomuch as they form part of a long tradition of rendering 3D artefacts in two dimensions (Campana, Citation2013: 7). While Campana (Citation2013: 10–11) gently parodies this two‐dimensional stuckism, there are advantages to it, not least in the easy access for scholars to the images, without the need for sophisticated or costly software. In these, and in the underlying point clouds, the project also generated data upon which reconstructions could be based in the eventuality of irreparable loss of or damage to the original craft. In sum, it promised to deliver many of the benefits that Barber et al. (Citation2011: 3–5) identify with 3D laser scanning in heritage contexts: creating a pre‐intervention record; recording a structure prone by its nature to loss or change; condition monitoring; and providing a (virtual) model for display in museums or on the internet. It also generated a dataset from which the vessels could, in principle, be closely studied from afar in order to better understand their spatial characteristics, naval performance, and construction (Kolb, Citation1997; Frischer and Dakouri‐Hild, Citation2008: v; Hermon, Citation2008: 38; Tanner, Citation2017; forthcoming).
A final objective of the project emerged once the choice of technology to record the vessels had been established: it became apparent that an opportunity had presented itself to compare the accuracy of 3D laser scanning with that of the more familiar chain‐and‐offset technique of ethnographic boat survey. Field activities therefore included deploying conventional boat survey techniques used elsewhere by two of the authors (JPC and CZ) in recording watercraft in ethnographic contexts (Agius et al., Citation2010; Citation2014; Citation2016).
Equipment
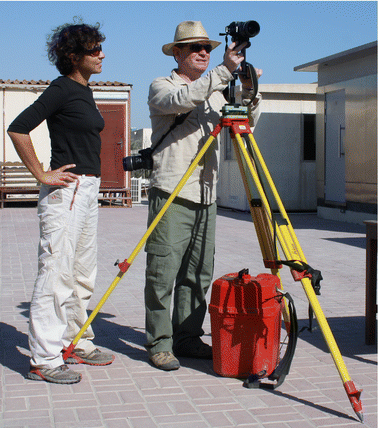
The fieldwork deployed a Leica HDS6000 laser scanner to record the QM collection (Fig. 4). First issued in 2006, the HDS6000 was one of the first in a new generation of phase‐comparison laser scanners (Leica Geosystems, 2007). These utilize the change in phase of the modulated carrier frequency upon transmission and return of the signal. The result is a process that, at the time of the fieldwork, offered fast data‐collection speeds but with a compromise on range compared to time‐of‐flight systems. The range of 79m achievable with the HDS6000 was more than enough for the project at hand, however, and the gains in speed were ultimately critical to the success of the fieldwork. The Leica scanner was used in conjunction with a tripod and a group of eight rotatable black‐and‐white tilt‐and‐turn targets set on small tripods, and used as initial target constraints in the registration process, during which individual scans are joined (Fig. 4); a ‘nodal‐ninja’ bracket (discussed below) to hold a Nikon D3200 digital SLR camera on the tripod at the same focal point as the laser scanner (Fig. 5); and a PC laptop from which to control the scanner using Bluetooth connectivity—although the scanner can also be operated independently. High‐capacity data‐storage devices were also essential, since laser‐scanning systems capture large amounts of data: fieldwork activities in Qatar alone generated some 147GB of data, 61GB of it directly from the laser scanner.
This high‐tech tool kit was supplemented, for the purpose of comparison with conventional boat survey techniques, with the standard low‐tech equipment of the ethnographic boat recorder: hand tapes, 30m tapes, plumb bobs, auxiliary means of fixing these, and a standard drawing kit. To this should be added the very substantial boatyard infrastructure—slipways, winches, and cradles—and boatyard personnel that QM placed at the disposal of the survey team, both in Doha and at Messaid Industrial City.
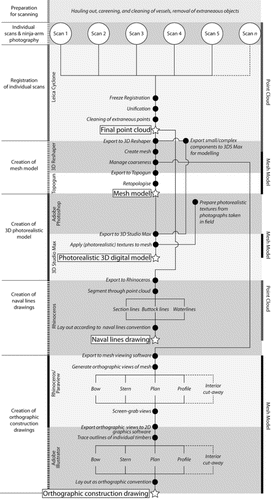
Post‐processing equipment included high‐specification PCs capable of handling large datasets with several software packages to process the captured data: Leica Cyclone for registration; the full Autodesk suite, mainly AutoCAD and 3DS Max; 3D Reshaper software for meshing; the Adobe suite (Photoshop, After Effects and Premier Pro) for digital image processing; Topogun and 3D Coat software for retopology (recreating an existing surface with more optimal geometry); and Rhinoceros software for the production of naval lines drawings. The workflow of the project from vessel preparation to completion is summarized as a swim‐line diagram in Figure 6.
Fieldwork methodology
Fieldwork was conducted over a total of 15 working days in February–March 2013 in the collection's Doha boatyard, and, for the largest vessel, in a dry dock of the Messaid Industrial City, some 35km to the south. Preparatory work was carried out separately by the QM boatyard crew: those vessels normally kept on the water were hauled out in turn onto a slipway for scanning, and thoroughly cleaned of marine encrustations; all were also emptied of ballast and cleared of stowed materials that would otherwise have masked areas during survey, causing blinding.
Several laser‐scan positions were taken around each vessel at spacings of no more than 10m, both to ensure sufficient overlap of the captured stations and minimize blinding. The first scans were conducted from stations around the outside of the vessel, and targeted the outer hull and superstructure. By default, the scanner was levelled on its tripod, but where a lower viewpoint was required it was set on its tribrach only, set on levelled wooden blocks. For larger vessels, two closed traverses were made around the hull, one at a lower level to catch the hull below the turn of the bilge, and the other higher up to record the sides. A second sequence of scans was taken on board to capture the deck and further superstructure detail. A third was taken inside the hull, when space allowed: height limitations below deck in most cases prevented scanning with the scanner set on its tripod. The interiors of only five—the ghanja, large sanbūq, būm, the Fatḥ al‐Khayr, and large battīl—could be scanned with the scanner on its tripod: the remainder could only be surveyed by placing the scanner on its tribrach on an improvised board that was levelled across the framing timbers.
The eight black‐and‐white Leica targets were distributed appropriately—at diverse elevations and spread—to establish geometrically robust control points that would provide initial fixed registration positions between the subsequent scans used to make a single point cloud. When the scanner was moved to a new scan location, those targets that were inter‐visible between the new and previous scan stations were left in place—although rotated to face the new survey point—while the others were moved back into range in new locations. Thus a rolling overlap of control points was established from scan to scan. Additional scans were conducted around the stern area on larger vessels or those with transom sterns, some of which were carved with detailed decoration. Targets were not placed on the vessels themselves in order to avoid unnecessary blinding: the only exception to this rule was the large battīl, the dimensions of which made this course of action unavoidable. Targets were not used at all below deck in order to limit blinding in confined spaces that were already prone to it due to the complex topography of the framing timbers and sparse options for safely setting the scanner. When targets were not used, individual point clouds were registered manually during post‐processing, guided by geometrically prominent features of the vessel captured in the cloud. Finally, while the field of capture of phase‐comparison scanners such as the HDS6000 can be constrained, the instrument was in all but one case allowed to operate at its full 360° × 310° field of view. Although this approach generated larger datasets, it delivered a faster and simpler modus operandi in the field, since the operators could be confident that no crucial data would be unintentionally cropped. Moreover, the saving in actual scanning time was deemed to be significantly less than the additional set‐up time required for a constrained scan.
The median number of scans taken per vessel was 18.5, with the small bānūsh requiring just six, and the large battīl needing 36 (Table ). A single rotation (scanline) of the laser can record up to 1800 positions as xyz coordinates. On its ‘high’ resolution setting, which was the default option during the survey, the instrument took 3 minutes and 18 seconds to complete a scan, during which it could record over 5 million data points, assuming a 100% return rate.
Table 1. Summary of vessels and time taken for recording using laser scanning
Following each exterior laser scan, the scanner was removed from the tripod and replaced with a Nikon D3200 digital camera with an 8mm fisheye lens mounted on a bracket, known as a nodal ninja, which enables photography to be conducted from the same focal point as the removed scanner. In other laser scanners, a built‐in camera takes photographs after the laser‐scanning process. However, in many cases, the methodology illustrated in this paper continues to be used in order to control the quality and resolution of the photographs. In either case, this in principle allows photorealistic colours to be projected onto the point cloud. Using the nodal ninja and 8mm fisheye lens, a 360° set of eight photos were taken on the horizontal plane. Two additional photos were also taken where relevant, one vertically upward to catch rigging and superstructure, and the other downward to capture deck planking. The results showed a degree of offsetting between the resultant images and the point cloud. However, since the post‐processing took the 3D geometric models to a fully CGI‐modelled level, the lack of accurate ninja‐arm images could be successfully circumvented. Meanwhile, in order to enable the creation of photo‐textures with which to photo‐render the 3D models, detailed and extensive photographs (on average 380 per vessel) were taken of the entirety of each vessel parallel to the subject, using a digital SLR camera with conventional lens.
Weather proved to be a limiting factor on only one day of the fieldwork, with strong winds lifting dust that would have endangered the scanner—and probably generated false returns—had it been operated.
Regstration of unified point clouds
The first step in the post‐processing of raw 3D‐laser‐scan data is to ‘register’—that is to align in a single arbitrary co‐ordinate system—the several point clouds generated by each scan to create a single model. Since 3D laser scanning collects undifferentiated data, the next stage is to remove all extraneous points that record locations that are were not part of the vessel itself—for example, the ground, slipway walls, barrels, and ladders. This was conducted using Leica's proprietary Cyclone software (Leica Geosystems, Citation2015). Scans were registered automatically where they had both successfully detected the same three or more targets (Guidi, Citation2014: 45). Otherwise this was done manually using a ‘scan‐to‐scan’ or ‘Iterative Closest Point’ (ICP) method: the operator visually identifies a number of vertices in common between two scans, after which Cyclone runs a best‐fit ICP algorithm (Guidi, Citation2014: 45). This was made possible by ensuring a substantial overlap—and therefore also data redundancy—between adjacent scans. This manual process was used exclusively when joining a vessel's interior and exterior scan worlds. Once all clouds had been registered together, the resultant data were unified to create a single complete point cloud. The process achieved a mean absolute error for enabled constraints of 1–2mm for all craft except the large battīl, where it was 5mm (Table ).
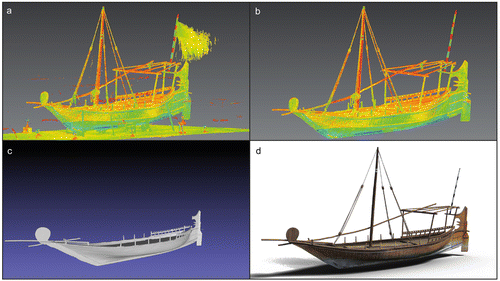
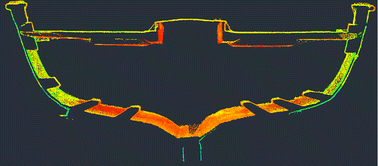
Removing extraneous points from the cloud is achieved manually. Many of these are the result of using an unconstrained scan window. In addition, infrared radiation from the intense sun affected the laser beam, creating range noise that had to be cleaned in the post‐processing stage. Figure 7a shows a single scan before the removal of extraneous data, while Figure 7b shows the unified point cloud of a single vessel after clean‐up.
The resulting unified point cloud is the starting point for the generation of the three target outputs of the project: photorealistic 3D digital models, naval lines drawings, and orthographic drawings. Registration, together with the next stage, 3D photorealistic modelling, were conducted for the project by 3D MSI Ltd, based in Penryn, Cornwall, United Kingdom.Footnote5
3D photorealistic digital models
The 3D photorealistic digital models were the principal output objective of the project, since they were created for incorporation into the gallery displays of the NMQ and were the primary reason for the commissioning of the project. The pathway for the creation of these models began with the export of the unified point cloud of each vessel from the Leica Cyclone software to 3D Reshaper meshing software: here the point cloud is used to generate a polygonal model, or mesh, of its surface features, thus preparing it for the application of a rendered, photorealistic surface (Fig. 7c). Adjacent points in the cloud are joined by lines using a nearest‐neighbour algorithm, and the planes formed by the resulting triangles filled to form polygons, constituting a triangular irregular network (TIN). The mesh is edited to manage coarseness and reduce noise (Guidi, Citation2014: 47). For each vessel in the collection, the hull and superstructure were meshed separately in order to manage file size, and subsequently joined. Next, the meshes of the vessel exteriors were retopologized using Topogun and 3D Coat software—that is, a new optimizing surface was manually defined onto the meshed surface, reducing the polygon count significantly and reducing file size, while maintaining topographical fidelity (Guidi, Citation2014: 47). In addition, retopology is used to define clear break‐lines between the components of the vessels, needed in the texturing process, and to remove the effects of mesh smoothing on sharp edges. On the būm, for example, the process reduced the number of polygons from 3.1 million triangles to about 2400 quadrilaterals, while maintaining the surface detail of the hull. In other words, the degree of resolution obtained by the operators during the scanning proved in the end excessive—largely because of processing capacity restrictions—in the production of the 3D digital models. Undertaking this stage of processing can result in deviation from the original dataset. Although the new retopologized mesh is ‘snapped’ onto the high density surface, the lower polygon version is a representation of it. Therefore, it is essential that the operator undertake a comparison analysis with the original point cloud to ensure integrity of the model. In respect of this case study, comparisons were undertaken and the level of accuracy assessed to be within acceptable limits (a maximum deviation of 30mm and the majority of the data lying within a 10mm deviation).
Recent advancements in modelling software include the direct integration of point clouds into 3D Studio Max (3DS Max). Using this capability, modelling of the point cloud was undertaken in 3DS Max for most smaller and more complex components of the vessels that could not be meshed using the methodology described above. In many cases, the modelling was complemented by reference to photographs of the components, as the point‐cloud density in which 3DS Max can process can be restrictive with large datasets, as was found in this project.
The completed model was then ready for texturing using 3DS Max. In order to create both visually and geometrically accurate textures, this software is used to define how 2D imagery is applied to the 3D geometry using ‘UVW’ mapping techniques. The method does not apply the nodal‐ninja photographs, but rather uses these as a guide. Instead it used the hundreds of digital photographs that had been taken of each vessel in the field using the hand‐held digital SLR camera. These jpeg photographs were sliced in Adobe Photoshop to obtain the desired textures (for example, of the stempost) and re‐saved; these were subsequently imported into 3D Studio Max, where they were applied to the 3D model, thus completing creation of the photorealistic finish.
Due to the low light below decks and the complex nature of the hull interiors—which made blanket photography impractical—a simpler rendering methodology was adopted in these situations: the interior point clouds were meshed and retopologized in the same way as the exteriors had been, but they were then given a uniform representative timber colouring sampled from photographic images of the interiors. The 3D digital models created by this process remain dimensionally accurate (Figs 7d, 8, see Supporting Information).
Production of naval lines drawings
Nautical scholars are familiar with lines plans as a long‐standing graphic method of representing the characteristic shape of a vessel's hull in two dimensions. The idiom gives information that can be used subsequently to model overall performance, such as the power required to propel the vessel, its speed, stability, and potential payload. The information is presented by convention as a series of two‐dimensional curves or reference lines: the body plan is a series of transverse vertical ‘sectional lines’; the sheer plan is a series of longitudinal vertical ‘buttock lines’; and the half‐breadth plan a series of horizontal ‘waterlines’ (Fig. 9). Since the plan records the shape of the outer surface of the hull rather than its structure, it is an idiom that is amenable to extraction from the point cloud generated through the 3D‐laser‐scanning process. Moreover, since the drawings are traditionally produced from a hull by conventional chain‐and‐offset measurement, using 3D‐laser‐scanning results in much greater accuracy.
Lines drawings can be generated from the laser‐scanning data by using 3D design software, such as Rhinoceros, and specific software dedicated to naval architecture, such as the Orca3D plug‐in for Rhinoceros, which can automatically generate naval lines drawings from the mesh generated from the point cloud. The principle was demonstrated by Moreton et al. (Citation2000) at the turn of the century.
However, being both old and originally built by eye, many of the QM vessels showed signs of deformation even to the naked eye, with the implication that several highly local anomalies would appear if the naval lines were generated automatically. Hence, the lines were produced manually using Rhinoceros—rather than using Orca3D's dedicated lines drawing function—with the operator's experience and judgement being used to interpret the most appropriate and representative line—still that of the hull in its current form, but with smaller anomalies removed. Given that the underlying point cloud remains available, an approach to generating lines drawings that retained these anomalies remains possible.
The first step in manually generating naval lines in Rhinoceros consisted of orienting a longitudinal axis through the point cloud against which the planes of the various section line, buttock, and waterline curves could be set. Since the design waterline of the vessel could not be known, a reference axis was set as a straight line running from end to end of the keel. Given the asymmetrical nature of the hulls, whether due to original construction or subsequent distortion, establishment of this baseline was in all cases a question of best‐fit judgement arrived at by the operator: the notion of a truly ‘square‐on’ projection—which Andrews et al. (Citation2009: 4) apply to buildings—proved spurious in these vessels. In some cases, an idealized waterline was traced onto the finished naval lines drawing on the basis of the location of a blue line painted on the hull that roughly delimitated the topside and the bottom of the hull, but these painted lines were not used as the default baseline.
The various curves were generated in Rhinoceros by slicing the point cloud at predetermined intervals in the program's three views—profile, plan, and front. These are numbered sequentially, counting away from the baseline, or from the rear of the keel in the case of the section lines.
To generate the body plans for each hull (Fig. 9, top left), section lines were produced in Rhinoceros's profile view at ten evenly spaced stations along the hull, with occasional additional sections taken at half‐way intervals to capture particular developments in the hull shape. A truly two‐dimensional station plane would have encountered virtually no points: hence, each section was sliced from the point cloud using certain parameters: tolerance 2mm; maximum distance of the points from the plane 7mm; minimum distance between points 2mm. Each section was then traced using the program's curve tool using the minimum possible number of points on the curve in order to reduce artificial points of inflexion. The accuracy of the curves was checked using the appropriate command function, and corrected if necessary. Following convention, only the starboard side of the hull was traced, with aft section lines projected onto the port side: again, this convention assumes the vessel to be symmetrical, which many of the QM vessels were not. To generate the sheer plan (Fig. 9, top right), between five and eight slices were cut through the point cloud in Rhinoceros's ‘plan’ view in order to produce the buttocks, using the same methodology as for the section lines. The half‐breadth plans (Fig. 9, bottom) were produced from the ‘front’ view in the same manner, generating 5–7 waterlines per vessel, using the same methodology.
Production of orthographic drawings
Scholars of nautical heritage are also generally familiar with multi‐view orthographic drawings of vessels that reveal the component parts and structure that together form the vessel, providing enough detail to enable, in principle, an accurate reconstruction (Fig. 10). However, while 3D laser scanning lends itself readily to the production of naval lines drawings through a process of sectioning the point cloud, and while also the point cloud of a vessel can be readily used to produce an accurate 3D digital reconstruction—subject to caveats discussed below—the process of producing orthographic drawings direct from the laser‐scanning data proved to be considerably more convoluted. One challenge arises directly from the limitations of deploying the laser scanner in cramped spaces: the Leica HDS6000 had to remain level on its tripod—or at least its tribrach—but also required sufficient overhead clearance, a challenge that more recent hand‐held scanners are beginning to overcome. As a result, blinding became most acute during the survey in structurally the most complex areas of the vessel—particularly below decks, between framing timbers, and in the bilges. Overcoming below‐decks blinding entirely would have required large numbers of additional scans per vessel—and with it unfeasible amounts of extra time. In particular, such information as the sided dimension of the framing timbers and the upper surface of the keel could not be consistently recorded in the point clouds. In other words, some basic dimensional data required to produce an orthographic drawing is missing.
A second challenge in producing orthographic construction drawings from the point clouds lies in the nature of the point cloud, and in particular the technical impossibility of automatically generating line drawings from it—at least to date. The lines must be generated through manual tracing by the illustrator of raster‐file views of either the point cloud or the mesh model transferred into other software (such as AutoCAD, Adobe Illustrator)—a time‐consuming process which, because it requires a skilled human eye to recognize salient features, has not been successfully automated (Barber et al., Citation2011: 13). Lateral sections cut through the point cloud can quickly generate a cross section of the interior structure of the hull, and these could in principle be quickly traced to produce a cross section familiar to many orthographic drawings (Fig. 11). However, the semi‐transparency of the point cloud means that the tracing of plan views, profile, bow, and stern elevations and interior sections of the vessel direct from the cloud itself is complicated by the visibility through it of features that will not be visible ultimately in the intended view, making optical differentiation by the illustrator difficult. Resorting to views of the mesh model eliminates the problem of the transparency of the point cloud, but makes mutually ‘flush’ features such as the butt joints of hull and deck planking difficult to see. The project's illustrators used raster images of the required views of the mesh models of the vessels to trace individual features in Adobe Illustrator, while referring to views of the point clouds and also photographs to help interpret and differentiate more challenging features. The result was both time‐consuming to generate and an inevitable step‐down in accuracy compared to that of the original point cloud, given issues of distortion, hand‐eye co‐ordination, and line thickness.
Due to constraints of the research contract—which had assumed interiors would only be recorded where the scanner could stand on its tripod—the point clouds of the interiors of only the five largest vessels were progressed to the digital modelling and orthographic drawings phase. These were the ghanja, large sanbūq, būm, jālbūt ‘Fatḥ al‐Khayr’ and large battīl. In all these cases, blinding experienced in the furthest recesses of the hull meant that point‐cloud data was not available to allow the representation of features in these areas: the solution arrived at for the orthographic drawings was to produce ‘cut‐away’ drawings of the interiors, with the blinded areas obscured by the exterior hull planking of the cut‐away side, rather than to speculate on what had not been recorded. Figure 12 shows the orthographic representations of the Fatḥ al‐Khayr resulting from this process.
Time taken in the field
Part of the appeal of 3D laser scanning as a metric survey method lies in the accuracy and density of the measurements taken. But it also lies in the time saved in the field. For example, while the very experienced pairing of Norbert Weismann and Piotr Dziamski took four days to survey the Fatḥ al‐Khayr using conventional methods (Norbert Weismann, pers. comm.), the 3D laser scanning of the same vessel—inside and out—took seven hours on a single day. Moreover, the 28 scans taken during the latter survey comprised vastly more measured points, and at a much higher degree of accuracy that can be achieved by hand‐measurement, even when done by experienced surveyors. Indeed, the University of Exeter survey was able to scan 16 vessels from the QM collection, inside and out, in 13 working days. Moreover, three of those days were taken up by the survey of the 36m‐long battīl, which was so large that it had to be surveyed in a dry dock at Messaid, some 35km from the main survey site: logistics allowed just half a day of survey there per day. Meanwhile, on three fieldwork days the survey team was able to scan two vessels per day. The team refined the process of repositioning the scanner to a new survey location, positioning the scanner targets appropriately, conducting the scan, and taking the ninja‐arm photographs so that the entire cycle could be completed in 15 minutes. The number of scans conducted per vessel, and the time taken to survey most of them are summarized in Table . Even including delays of four days in the passage of the scanner through import bureaucracy and a day lost to bad weather, the team was able to complete the survey of the collection in 18 working days. Taking into account Weismann and Dziamski's experience on the Fatḥ al‐Khayr, and Cooper and Zazzaro's experience of recording vessels in the southern Red Sea, the authors estimate that conventional survey of the collection would have taken 48–64 working days, or four‐to‐five times longer than the 3D‐laser‐scanning process itself took. Moreover, it may well have proved impossible to safely survey the large battīl—and perhaps also parts of the būm—by conventional methods, given the physical heights involved.
Post‐processing time
The advantage in terms of rapidity in the field that 3D laser scanning enjoys over conventional survey methods does not tell the whole story, however. Post‐processing was by far the most time‐consuming portion of the project: the working pathway for the digital modelling strand of the project took approximately 12 working days per vessel from raw scan data to photorealistic digital model; production of the naval lines drawings from the registered point cloud took about two days; and creation of the orthographic lines drawings from the mesh model took about five‐to‐six. On average, a single day of data‐gathering in the field gave rise to some 20 days of post‐processing in order to generate the desired outputs for each vessel. In comparison, Weismann and Dziamski's production of their detailed orthographic drawings of the Fatḥ al‐Khayr from their field survey data took five working days, and the rendering of these into CAD drawings took a further eight (Norbert Weismann, pers. comm.). Hence, from start to finish, their production of conventional orthographic drawings of the Fatḥ al‐Khayr took 17 days. Using laser scanning, this particular output pathway took about half as long—nine days—and generated a very useful point cloud and mesh model of the vessel at stages on the way. That said, while Weismann and Dziamski's process required competence in conventional survey and CAD operation only, the laser‐scanning pathway required skills in operation of the Leica HDS6000 scanner, of Leica's Cyclone software for registering the point cloud, of 3D Reshaper software for the production of a mesh model, Topogun software for retopology, Adobe Photoshop for texture creation, 3DS Max for modelling, texturing, and rendering, and of Adobe's Illustrator drawing software to create the orthographic drawings. The eight working days saved across the process therefore came at a cost of substantial additional expenditure on access to equipment, software and related skills that would not have been possible without funding support from QM that would be beyond most historic or ethnographic boat‐recording projects.
Accuracy comparisons
In addition to its relative speed of survey, the Leica HDS 6000 scanner delivers an accuracy and density of measurements with which conventional chain‐and‐offset survey techniques cannot hope to compete. The scanner has a positional accuracy of ±6mm and a distance accuracy of ≤4mm in the 1–25m range in which it was operating during the survey. Meanwhile, Table shows the root‐mean‐squared (RMS) error generated during the registration process as reported by the Cyclone software. For most craft, the RMS error was 1mm, with registration of the large battīl returning an error of 5mm: this is consistent with Leica specifications (Leica, 2007). Such millimetric accuracy is further enhanced by the sheer density of points. A conventional chain‐and‐offset survey the curvature of the hull might be recorded by measuring points 100mm apart along vertical axes set 1m or more apart. In contrast, the HDS6000 has a point density of 6.3 × 6.3mm when operating at a distance of 10m—the density is of course higher at the closer distances typically adopted during the fieldwork.
It can be argued that such accuracy of measurement is unnecessary for most applications of heritage boat recording: certainly, no attempt at reconstruction based on the scans would be able to conform so closely to the original vessel. However, this degree of accuracy may come into its own in monitoring condition of the vessels over time, where millimetric changes in shape—for example, of the hull due to hogging—might be detected early due to the accuracy of the laser scanner: this does, of course, assume repeated scanning over time, with all the cost and logistics that this entails.
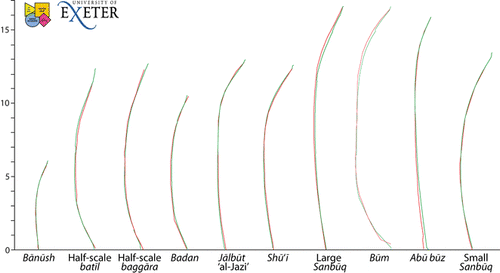
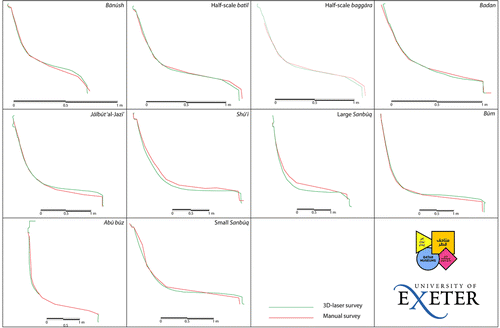
In the meantime, laser scanning offers the reverse opportunity of assessing the effectiveness of traditional boat‐recording techniques with respect to a method that is known to be highly accurate. In pursuit of this objective, the authors, where time allowed, recorded representative dimensions and profiles of the vessels as a basis for comparison. These included hull length, hull width and beam amidships, and keel length. Table compares the measurements recorded for these dimensions on a number of vessels in the collection using both a physical tape measure and the HDS6000 laser scanner. Meanwhile, a series of curves were also recorded using the conventional survey method of recording offsets from a baseline using a hand tape, string baseline, plumb bob, and line level. The curves taken included a plan view of the port‐side sheer line, using a horizontal string secured by nails along the central axis of the vessel as a base line. The other curves were vertical, and taken using a suspended plumb bob as the baseline: these included the port‐side curve of the hull amidships, the plan view of the port‐side sheer curve, and the profile of the bow and stern.
Table 2. Comparison of basic measurements taken from the laser scanning and offset surveys
An encouraging conclusion arising from this exercise is that direct linear measurement using tape measures does yield reliable results that are normally well within a 0.5% level of variance from the distances measured using the 3D laser scanner (Table ). This is reassuring given the challenges facing the manual surveyor, such as tape stretch, whether cause by wind, over‐pulling, or gravity; parallax error when reading the tape; or human error in reading numbers. Surveying hull curves is a degree more difficult, given its dependence on a steady baseline, 90° angles of offset, a stationary plumb bob in outdoor conditions, and so forth. Hand survey of the port‐side sheer‐line curve plan was conducted on ten of the vessels by taking offset measurements with a hand tape from a central baseline comprising a string secured along the axis of the vessel and a 30m tape running alongside it. The results for the most part show a close correlation with the laser‐scan survey results (Fig. 13). The results of the vertical survey of the mid‐ships curve confirm a tendency to error below the turn of the bilge. This is a relatively difficult area to survey for several reasons, including a moving vertical baseline due to wind or human contact, difficulty in maintaining a truly horizontal offset measurement at 90° to the baseline in the increasingly confined space below the turn of the bilge, and the acute angle of intersect between the offset measure and the hull in this area. The tendency on larger vessels is to produce a curve that suggests a larger hull than in reality (Fig 14). Smaller vessels are less affected by this tendency than large ones.
Future applications of the dataset
The possible future applications of metric data acquired through 3D laser scanning are many—assuming the ongoing availability of the necessary skills, technology, and human and financial resources. The fact that the principal objective of the QM commission was to generate photorealistic digital models for presentation in museum animations is indicative of that multifaceted potential. The digital models created for QM are today being prepared for NMQ gallery animations aimed at communicating life at sea for Qataris in the pre‐modern era. An abiding challenge for the presentation of watercraft in a dry and static museum gallery is the fact that boats and ships are, in their intended applications, dynamic structures in ever‐changing aquatic environments. Digital modelling and animation technology enables museums to overcome the stasis of the museum object—particularly problematic for watercraft—and engage visitors with the lived experience of vessels on river, lake, or sea. Moreover, the models generated could easily be communicated via an online museum resource, without the need for interested individuals to visit a possibly distant museum.
3D digital data outputs can be taken much further, however. The underlying point cloud captures in detail the structure of the surveyed watercraft. In itself, the cloud contains the data required to reverse‐engineer the original vessel in its entirety, to model individual components of it, or to design structures such as cradles, ladders, viewing platforms, and even entire museums and galleries necessary to keep the vessel safe, supported, and accessible to the public. Repeated 3D‐laser survey allows baseline comparisons between clouds generated on different survey occasions in order to monitor structural change for maintenance and conservation purposes. And the cloud stands as an abiding metric resource for the academic study of the vessel, its spatial arrangement, construction, and performance. As other projects have shown, notably Caputo et al. (Citation2003) and Tanner (Citation2013a, Citation2013b), it also provides the data necessary to model the hydrodynamic performance of vessels that were often originally created without reference either to written plans or modern ship‐scientific assessment techniques.
Advantages and disadvantages
When planning a metric survey of heritage material, Andrews (2009: 4) cautions that: ‘The balance between precision, cost and time … should be considered carefully….’ This is certainly the case when contemplating the potentially costly option of 3D laser scanning in recording historic watercraft. The advantages are several, and many have already been highlighted. These include: unprecedented accuracy and detail in boat recording; speed of survey in the field; the flexibility and multiple possible applications of the metric data captured; and its usefulness to conservators, ship scientists, archaeologists, ethnographers, and museum curators and designers.
However, these advantages are accompanied by a number of disadvantages relative to more low‐technology approaches. Chief among them is the significant cost of the hardware and software required to produce and manipulate the raw scan data even to the level of a basic registered point cloud, not to mention the additional technical resources, time, and skilled operators required to take those data further to the point of, for example, naval lines and orthographic drawings, 3D digital models and animations. Hardware costs have fallen, but even the cheaper brands remain around £20,000 for a scanner and associated software. Rental remains an option, but still costs £250–500 per day—which quickly adds up in field survey‐type projects. These resources are often beyond the reach of university departments, let alone skilled avocational enthusiasts, for whom the traditional tools of hand tape, plumb bob, etc., remain a more feasible option.
Meanwhile, the emergent technology of 3D photogrammetry represents a lower‐cost middle way—though not one that was explored as part of the QM project (Yastikli, Citation2007; Remondino, Citation2011; Martorelli et al., Citation2014; Giampaola et al., Citation2015; Yamafune et al., Citation2017). The in‐field equipment required is nothing more than a decent digital camera and means of establishing scale—making it more amenable to use in jurisdictions where the authorities are sensitive to the idea of using (or indeed importing) laser‐scanning technology. Software costs are lower, and some open‐source programs exist, such as VisualSfM. Meanwhile, use of drones can augment its effectiveness for out‐of‐reach places such as rigging. However, post‐processing still by and large requires a high‐powered computer and long processing times, with questions remaining over accuracy: photogrammetric survey has to be carefully controlled and scaled to ensure that accuracy is maintained. Moreover, the process depends on the subject being suitably lit: a particular problem in low‐light conditions below deck, an area that also, though for different reasons, remains troublesome for 3D laser scanners. Meanwhile, the nautical archaeological and ethnographic research community would benefit greatly from a detailed project comparing the relative merits—in terms of accuracy and convenience—of 3D laser scanning and 3D photogrammetry, though some work has been done in this direction (Yastikli, Citation2007).
This article has demonstrated that the fast deployment and data‐gathering capabilities of 3D laser scanners should not be mistaken as equating to the rapid generation of results that are both accessible and usable. It is true that a unified point cloud can be registered on the day of survey, and be accessed for viewing and basic measurements on free ‘viewer’ versions of more expensive proprietary software at little cost. In that respect it is, as Barber et al. (Citation2011: 7) say, ‘useful as a product in its own right’. But, as this project demonstrates, processing the data to produce other usable outputs requires considerable further human, financial, and technical resources. Hence, time gains in the field must be set against extended and costly post‐processing durations. Moreover, as a number of unsuccessful past attempts to apply 3D laser scanning to boat recording have shown, technological obsolescence poses yet another risk to the future accessibility of the data. In addition, data must not only be in an accessible format, but also archived in an enduring data management system where it will not be lost or forgotten.
Other challenges—such as blinding and the secure positioning of the laser scanner—are inherent, in the first case to all laser scanners, and in the latter to any tripod‐based survey device. More recent fixed‐position models than the Leica HDS 6000 used in this project, such as the Faro Focus X330 have an integral HD camera that records full‐colour data at ranges of up to 330m, doing away with the need for the time‐consuming nodal‐ninja set‐up. However, using the nodal‐ninja set‐up in certain applications may be preferred in order to provide full control of the images taken and negate the effects of over/underexposure when operating in challenging climate conditions, for example the bright sunlight of Qatar. 3D and Leica ScanStation, can be positioned in tighter and less accessible spaces. Moreover, other scanners, such as the Faro Freestyle3D and GeoSLAM ZEB‐REVO, have abandoned the tripod entirely and become hand‐held, increasing their positionability and ease of use, and significantly reducing blinding issues. These systems can be used in zero‐lighting situations, albeit at the expense of colour data. However, blinding can never be entirely overcome, partly because of the basic physics of light, of the operational limitations of the scanner, and of the inherently complex topography of watercraft. Moreover, since laser scanning records surfaces only, it cannot capture enclosed voids, or the internal make‐up of compound structures or joints. In all cases, equipment must be selected carefully and with cognizance of research objectives, since its instrument and processing errors have to be understood.
According to Guidi (Citation2014: 37), 3D laser scanning ‘… removes subjective impressions from the master record that may influence the following data interpretation.’ This is largely true for the scanning process itself, during which phase the opportunity for human error and subjective choice of the kind found in traditional survey is heavily diminished. However, as Campana (Citation2013: 8) points out, the recording of an object in 3D may be objective, but the choice of what to record is not. And given the costs associated with 3D laser scanning, choice will always be a matter of researcher and funder priorities, whether overt or implicit. Moreover, in the University of Exeter/QM project, human interpretation proved to be a component of the production of the naval lines drawings, the conventions of which suppress asymmetries in a hull; of the orthographic drawings, where human‐eye interpretation is central to the production of views from the point cloud, mesh or photographs; and of the digital models themselves, where the photorealistic render must be generated by hand from digital photographs taken of the vessel.
Ironically, 3D laser scanning also has the potential to diminish the researcher's familiarity with the vessel being surveyed, since it allows one to record the dimensions of a vessel with greater personal detachment from its materiality. Hence the researcher may actually become less familiar with the artefact using this technique—a counter to Rielly's enthusiastic observation (1989: 569) that ‘the most exciting aspect of this work [i]s the ability of the researcher to interact with the graphical models to enrich greatly the perception of the material under study.’ This may be true when scholars outside of the field encounter modelled data, it is not the case for the field researcher, who is more detached from the object being surveyed. Indeed, it may well be argued that the rather slower and painstaking process of surveying by traditional chain‐and‐offset measurements gives archaeologists the opportunity to familiarize themselves with the historic materiality of the vessel being surveyed. That said, data that is not consciously recorded by the traditional surveyor during the field survey is lost entirely, since it has not been captured: a laser scanner will capture data whether the surveyor recognizes its salience at the time or not.
Other drawbacks are logistical: where surveying is to be conducted away from the surveyor's home state, the laser scanner must be transported across international borders, where in certain regions of the world this might encounter official paranoia regarding its function, legal constraints on its import and use, and delays and charges at customs. More recent scanners are small enough to be transported as accompanied hold luggage in aircraft, but they continue to attract suspicion and sometimes customs charges at the border. During surveys in the field, meanwhile, the exotic nature of the equipment, of the activities surrounding it, and of the people conducting the survey are prone to generate a degree of potentially disruptive public curiosity—or even concern—that conventional survey methods might not.
While the generation of naval lines drawings from the point cloud was a relatively straightforward process, both the conventions they follow and the artisanal nature of the vessels themselves continue to raise issues of accuracy and subjectivity. Naval lines drawings assume hull symmetry, since the three views present data from the starboard side of the hull. Hence the recorded side of the vessel may not capture distortions on the unrecorded side, or alternatively may project its own distortions onto the other. Meanwhile, creation of the lines drawings from the point‐cloud records accurately the lines of the vessel in its current condition, however deteriorated, rather than in its built state. While this has clear uses for monitoring the condition of the vessel over time, it does not directly inform any performance‐modelling enquiry aimed at understanding the effectiveness of the vessel during its working life. For that, a methodology of compensation would have to be developed. Nevertheless, the anomalous symmetry and distortions of the vessel sometimes required the judgement of the operator in avoiding minor anomalies reflecting the ‘biography’ of the boat that were judged to obscure interpretation of even its present form. Major anomalies, such as the distorted bilges of the Fatḥ al‐Khayr were not ‘adjusted’, however. The lines plan produced by Weisman and Dziamski show that the bilge had already begun to slump in 2005, and continued through to 2010 as shown in the lines plans produced by Vosmer (Citation2011, fig. 3.12).
Conclusion
3D laser scanning offers to the nautical surveyor qualities of exceptional speed, detail, and accuracy in the recording of complex watercraft. However, it comes at a substantial cost, particularly in terms of vessel preparation, survey equipment, software, and skilled and creative technicians and modellers. Post‐processing time and costs are also substantial, with one day in the field in this project requiring 20 days of post‐processing in order to obtain the desired outputs. Even as costs continue to fall, the technology continues to require substantial financial and institutional backing if it is to constitute a feasible route for archaeological and ethnographic boat survey, scholarly dissemination, and public representation. The alternatives of 3D photogrammetry and traditional hand survey offer cost‐effective survey methods that might also be more feasible for other reasons, such as their acceptability to local authorities and obtrusiveness among host communities—notwithstanding the diminishing size and obtrusiveness of the technology.
Past surveys of even high‐profile heritage vessels have failed because of software obsolescence or the inability otherwise of institutions to access the original field data. The QM‐University of Exeter project generated point‐cloud data that exists in simple xyz files that contain the fundamental numerical survey measurements, and to that extent are future‐proof. And it has produced conventional 2D drawings of the vessels that are both familiar to the nautical scholar and in an easily accessible PDF format. Likewise, 3D PDFs of the vessels have been generated for ease of access and sharing of the 3D imagery. The 3D‐modelling process likewise used mainstream, industry‐standard software packages. Nevertheless, the long‐term accessibility of the data arising from 3D laser scanning in general remains a matter of concern for the discipline. It requires ongoing institutional wherewithal in terms of financial and skill resources, as well as a careful archiving of the data generated in future‐proof formats.
However, the QM‐Exeter University project demonstrates the potential of a well‐resourced 3D‐laser‐scan survey to rapidly record a substantial collection of traditional watercraft in a relatively short time, and to develop the data captured in the field into a variety of outputs that serve multiple objectives. Over 13 working days, the project scanned and recorded 14 watercraft, representing a cross section of boatbuilding traditions of the Arabian‐Persian Gulf region. The resulting 3D point clouds constitute a digital record of a collection that had only partially been recorded before in any form. Post‐fieldwork processing developed the respective point clouds into conventional 2D naval lines and orthographic drawings of a format familiar to nautical scholars, and into photorealistic 3D digital models destined to form the basis of gallery installations in the new NMQ building depicting Qatari life by the sea. The possible applications of this data in condition monitoring, scholarly study and public dissemination are manifold: the outputs are lodged with QM and the University of Exeter.
Supporting Information
Additional Supporting Information may be found in the online version of this article at the publisher’s website:
3D model of the half‐scale battīl in the Qatar Museums collection.
rjna_a_12127240_sm0001.pdf
Download PDF (20.8 MB)Acknowledgements
We wish to thank QM for enabling and funding this research (Grant number SL‐05894). In particular we wish to thank: Chairperson, H.E. Sheikha Mayassa bin Hamad Al Thani; Vice Chairman, Sheikh Hassan bin Mohammed Al Thani; Acting CEO, Mr Edward Dolman; Acting Director, National Museum of Qatar, Sheikha Amna bint Abdulaziz al Thani; Project Director, NMQ, Dr Emin Balcioglu; Deputy Director of Operations, NMQ, Faisal al Hitmi; Mr Abdulrazack Abdulqader; Mr Reda Moussa al‐Hajj and the boatyard maintenance team; Deputy Director of Curatorial and Collections, NMQ, Dr Abdulla Mohammad Al Sulaiti; Curator, NMQ, Mohammad Abu Hindi; and Curator of Maritime History, NMQ, Dr Lynne Newton. We wish also to thank colleagues at 3Dmsi Ltd for their 3D modelling services, and support staff at the University of Exeter.
Notes
1. Although Barker (Citation2009) says in the same volume that the work was conducted in 2005.
2. Though they do recommend that ‘Using laser‐based measuring technology should be reviewed’ (CitationKentley et al., 2007: 23).
3. The application of the terms shūʿī and sanbūq is somewhat fluid within the Gulf: in this paper we use the terminology as it is applied by QM.
4. The final destination of the collection itself has yet to be settled.
References
- Agius, D.A., 2002, In the Wake of the Dhow: The Arabian Gulf and Oman. Reading: Garnet Publishing.
- Agius, D.A., 2005, Seafaring in the Arabian Gulf and Oman: People of the Dhow. London: Kegan Paul.
- Agius, D.A., Cooper, J.P., Semaan, L., Zazzaro, C. and Carter, R., 2016, Remembering the Sea: Personal and Communal Recollections of Maritime Life in Jizan and the Farasan Islands, Saudi Arabia. Journal of Maritime Archaeology 11.2, 127–177.
- Agius, D.A., Cooper, J.P., Zazzaro, C. and Jansen van rensburg, J., 2010, The dhow's last redoubt? Vestiges of wooden boatbuilding traditions in Yemen. Proceedings of the Seminar for Arabian Studies July 2009, 71–84.
- Agius, D. A., Cooper, J. P. and Zazzaro, C., 2014, The maritime heritage of Yemen: a focus on traditional wooden ‘dhows’. In D. A. Agius, T. Gambin, and A. Trakadas, (eds), Ships, Saints and Sealore: Cultural Heritage and Ethnography of the Mediterranean and the Red Sea, 143–158. Oxford.
- Al‐hijji, Y. Y., 2001, The Art of Dhow‐Building in Kuwait. London: London Centre of Arab Studies.
- Anderson, R. K., 2004, Guidelines for Recording Historic Ships (Third Edition). Washington, DC: National Park Service.
- Andrews, D., Bedford, J., Blake, B., Bryan, P., Cromwell, T. and Lea, R., 2009, Measured and Drawn: Techniques and practice for the Metric survey of historic buildings (second edition). Swindon: English Heritage.
- Anon., 1979, Oman: A seafaring nation. Muscat: Ministry of Information and Culture.
- Anon., 2011, Dokumentasjon Av Fartøy Ved Hjelp Av Laserscanning. Hellarborgen.
- Barber, D., Mills, J. and Andrews, D., 2011, 3D Laser Scanning for Heritage (Second Edition): Advice and guidance to users on laser scanning in archaeology and architecture. Swindon: English Heritage.
- Barker, R., 2009, Appendix 1: Some Background Considerations in the Construction and Geometry of the Hull, in P. Marsden (ed.), Mary Rose: Your Noblest Ship. Anatomy of a Tudor Warship. Archaeology of the Mary Rose, vol. 2. 399–403. Portsmouth.
- Campana, S., 2013, 3D Modelling in Archaeology and Cultural Heritage—Theory and Best Practice, in F. Remondino and S. Campana (eds), 3D Modelling in Archaeology and Cultural Heritage—Theory and Best Practices 7–12. Oxford.
- Caputo, F., Pensa, C., Sansoner, R., and Sperana, D., 2003, Applicazione di tecniche di ingegneria inversa nell'acquisizione di carene navali di interesse storico, in Anon. (ed.), Proceedings of XIII ADM ‐ XV INGEGRAF International Conference on Tools and Methods Evolution in Engineering Design: Cassino, June 3rd, 2003; Napoli, June 4th and June 6th, 2003; Salerno, June 5th, 2003. Available at: https://hdl.handle.net/11588/181752.
- Mac cárthaigh, C. (ed.), 2008, Traditional Boats of Ireland: History, Folklore and Construction. Cork: The Collins Press.
- Chartered Institute for Archaeologists, 2014, Standard and Guidance for Nautical Archaeological Recording and Reconstruction. Reading: Chartered Institute for Archaeologists.
- Downland Partnership, 2014, HMS Victory Laser Scanning. Available at: https://www.exactsurvey.com/victory.php
- Forte, M., 2008, Virtual Archaeology: Communication in 3D and ecological thinking, in B. Frischer and A. Dakouri‐hild (eds), Beyond Illustration: 2D and 3D Digital Technologies as Tools for Discovery in Archaeology, 21–35. Oxford.
- Forte, M. and Silotti, A., 1997, Virtual Archaeology: Re‐creating Ancient Worlds. New York: Harry N. Abrams.
- Frischer, B. and Dakouri‐hild, A., 2008, Introduction, in B. Frischer and A. Dakouri‐hild (eds). Beyond Illustration: 2D and 3D Digital Technologies as Tools for Discovery in Archaeology, v–xxiv. Oxford.
- Giampaola, D., Carsana, V., Achille, C., Ackermann, S., Fassi, F., Fregonese, L. and Nobile, A., 2015, 3D survey technologies applied to the archaeology for the new ‘Municipio’ underground station in Naples, in Anon. (ed.), 1st International Conference on Metrology for Archaeology, Benvenuto, Italy, October 22–23, 2015, 1–6. Benevento.
- Guidi, G., 2014, Terrestrial Optical Active Sensors—Theory and Applications, in F. Remondino and S. Campana (eds), 3D Recording and Modelling in Archaeology and Cultural Heritage—Theory and Best Practices, 37–60. Oxford.
- Haneca, K. and Daly, A., 2014. Tree‐Rings, Timbers and Trees: A dendrochronological survey of the 14th‐century cog, Doel 1. IJNA 43.1, 87–102.
- Hawkins, C., 1977, The Dhow: an illustrated history of the dhow and its world. Lymington: Nautical Publishing Company.
- Hermon, S., 2008, Reasoning in 3D: A critical appraisal of the role of 3D modelling and virtual reconstructions in archaeology, in B. Frischer and A. Dakouri‐hild (eds), Beyond Illustration: 2D and 3D Digital Technologies as Tools for Discovery in Archaeology, 36–45. Oxford.
- Howarth, D., 1977, Dhows. London: Quartet Books.
- International Council on Monuments and Sites, 1964, International Charter for the Conservation and Resoration of Monuments and Sites (The Venice Charter 1964), Available at: http://www.icomos.org/charters/venice_e.pdf.
- Jewell, J.H.A., 1976, Dhows at Mombassa. Nairobi: East African Publishing House.
- Jones, T., 2009a, The Newport Ship: Her Three Dimensional Digital Recording and Analysis. Skyllis 9, 36–41.
- Jones, T., 2009b, Three‐Dimensional Recording and Digital Modeling of the Newport Medieval Ship. ACUA Underwater Archaeology Proceedings 2009, 111–116.
- Jones, T. and Nayling, N., 2011, ShipShape: Creating a 3D Solid Model of the Newport Medieval Ship. ACUA Underwater Archaeology Proceedings 2011, 54–60.
- Jones, T., Nayling, N. and Tanner, P., 2013, Digitally Reconstructing the Newport Medieval Ship: 3D Designs and Dynamic Visualisations for Recreating the Original Hull Form, Loading Factors, Displacement and Sailing Characteristics. ACUA Underwater Archaeology Proceedings 2013, 123–129.
- Kentley, E., Stephens, S. and Heighton, M., 2007, Recording Historic Vessels. London: National Historic Ships.
- Kocabaş, U., 2012, The Latest Link in the Long Tradition of Maritime Archaeology in Turkey: The Yenikapı. European Journal of Archaeology 15.1, 1–15.
- Kocabaş, U., 2014, Yenikapı shipwrecks excavation and studies. TINA Maritime Archaeology Periodical 1, 26–41.
- Kocabaş, U., 2015, The Yenikapı Byzantine‐Era Shipwrecks, Istanbul, Turkey: a preliminary report and inventory of the 27 wrecks studied by Istanbul University. IJNA 44.1, 5–38.
- Kolb, C.C., 1997. Review of ‘Virtual Archaeology: Recreating Ancient Worlds’, by Maurizio Forte and Alberto Silotti. Available at: http://www.h-net.org/reviews/showrev.php?id=1207.
- LaScanMar, 2013, LaScanMar: 3D Laser Scanning for Maritime Heritage Preservation. Available at: http://www.lascanmar.com.
- Leica Geosystems, 2007, Leica HDS6000: A new generation of ultra‐high speed laser scanner. Available at: http://www.surveyequipment.com/PDFs/Leica_HDS6000_brochure.pdf.
- Leica Geosystems, 2015, Lecia Cyclone: 3D Point Cloud Processing Software. Available at: http://hds.leica-geosystems.com/en/Leica-Cyclone_6515.htm.
- Lipke, P., Spectre, P. and Fuller, B.A.G. (eds), 1993, Boats: A Manual for Their Documentation. Nashville: American Association for State and Local History.
- Marsden, P., 2009, Salvage, Saving and Surveying the Mary Rose, in P. Marsden, (ed.), Mary Rose, Your Noblest Ship: Anatomy of a Tudor Warship. Archaeology of the Mary Rose, vol. 2. 12–19. Portsmouth.
- Martorelli, M., Pensa, C. and Speranza, D., 2006, Ricostruzione di carene navali mediante l'impiego di tecniche CAD/RE. Il Progettista Industriale 26.3, 96–101.
- Martorelli, M., Pensa, C. and Speranza, D., 2014, Digital Photogrammetry for Documentation of Maritime Heritage. Journal of Maritime Archaeology 9.1, 81–93.
- Moreton, W., Fowles, S. and Peers, R., 2000, Note Of A Demonstration Laser Scan Of A West African Dugout. The Mariner's Mirror 86.4, 463–467.
- Nayling, N. and Jones, T., 2012, Three‐Dimensional Recording and Hull Form Modelling of the Newport (Wales) Medieval Ship, in N. Günsenin (ed.), Between Continents: Proceedings of the Twelſth Symposium on Boat and Ship Archaeology, Istanbul 2009. 319–324. Istanbul.
- Nayling, N. and Jones, T., 2014, The Newport Medieval Ship, Wales, United Kingdom. IJNA 43.2, 239–278.
- Özsait‐kocabaş, I., 2011, Yenikapı Batıklarının Akdeniz Gemi Yapım Teknolojisindeki Yeri. Arkeoloji ve Sanat Dergisi 136, 137–148.
- Qatar Museums, 2014, Museums and Galleries—A Network to Inspire a Generation. Available at: http://www.qm.org.qa/en/content/museums.
- Remondino, F., 2014, Geomatics and Cultural Heritage, in F. Remondino and S. Campana (eds), 3D Recording and Modelling in Archaeology and Cultural Heritage—Theory and Best Practices, 13–14. Oxford.
- Remondino, F., 2011, Heritage recording and 3D modeling with photogrammetry and 3D scanning. Remote Sensing 3.6, 1104–1138.
- Rielly, P. 1989. Data Visualisation in Archaeology. IBN Systems Journal 28.4, 569–579.
- Tanner, P., forthcoming, 3D Scanning, Contact Digitising and Advanced 3D Digital Modelling for the reconstruction and Analysis of Boats and Ships. Virtual Heritage Network Ireland.
- Tanner, P., 2013a, 3D Laser Scanning for the Digital Reconstruction and Analysis of a 16th century Clinker Built Sailing Vessel. ACUA Underwater Archaeology Proceedings 2013, 137–149.
- Tanner, P., 2013b, Newport Ship Specialist Report: Digital Reconstruction and Analysis of the Newport Ship. York: Archaeological Data Service.
- Tanner, P., 2017, The Testing and Analysis of Hypothetical Ship Reconstructions, in J. Gawronski, A. van Holk and J. Schokkenbroek (eds), Proceedings of the Thirteenth Symposium on Boat and Ship Archaeology Amsterdam 2012. 79–81. Eelde.
- Traditional Boats of Ireland Project (nd) Traditional Boats of Ireland Project/Ár mBáid Dúchais: History, Folklore, and Construction. Available at: http://www.tradboats.ie/.
- Van Hove, R., 2005, De Doelse kogge(n). Monumenten, Landschappen en Archeologie 24.4, 50–69.
- Van De noort, R., Blue, L., Harding, A., Hurcombe, L., Monrad hansen, T., Wetherelt, A., Wittamore, J., and Wyke, A., 2014, Morgawr: an experimental Bronze Age‐type sewn‐plank craft based on the Ferriby boats. IJNA 43.2, 292–313.
- Vermeersch, J. and Haneca, K., 2015, Construction Features of Doel 1, a 14th‐Century Cog Found in Flanders. IJNA 44.1, 111–131.
- Vermeersch, J., Haneca, K. and Daly, A., 2015, Doel 2: a second 14th‐century cog wrecked in den Deurganck, Doel, Belgium. IJNA 44.2, 327–348.
- Villiers, A., 1969, Sons of Sinbad. New York: Charles Scribner's Sons.
- Vosmer, T., 1997, Indigenous Fishing Craft of Oman. IJNA 26.3, 217–235.
- Vosmer, T., 2011, Water Craft in the Qatar Museums Authority Collection: An Assessment and Preservation Strategy. Unpublished report, Qatar Museums Authority. Doha.
- Weismann, N. et al., 2014, The Battīl and Zārūqah of Musandam, Oman. IJNA 43.2, 413–435.
- Wellman, D., 2008, Scanning the George Olson. The Oregon Surveyor 31.3, 14–16.
- Wittur, J., 2013, Computer‐Generated 3D‐Visualisations in Archaeology. Oxford: Archaeopress.
- Yamafune, K., Torres, R. and Castro, F., 2017, Multi‐Image Photogrammetry to Record and Reconstruct Underwater Shipwreck Sites. Journal of Archaeological Method and Theory 24.3, 703–725.
- Yastikli, N., 2007, Documentation of Cultural Heritage Using Digital Photogrammetry and Laser Scanning. Journal of Cultural Heritage 8.4, 423–427.