
Abstract
The published norms for the Depression Anxiety and Stress Scale (DASS) give results for clinical populations that largely fall in the severe to very severe categories. As a result, within this population, the ability to compare the comparative contributions of the underlying emotional components is reduced. The present study presents results from a large general psychiatric outpatient population and provides percentile norms with confidence intervals for both the original DASS and the shorter 21‐item form. It is noted that both forms have high validity but that the correlations between scales are higher than those reported in non‐clinical populations. There was little variation between sexes but some variation of results with age with both younger and older cohorts having lower scores except for the Stress scale where there were higher scores in the older group. There is some evidence of a ceiling effect in the Depression and Stress scales. It was noted that nearly a quarter of patient scores fell within the originally defined normal range suggesting that the DASS would not be a particularly sensitive instrument in its previously reported use as a screening instrument for psychiatric illness.
Introduction
This study originated in the adoption of the Depression Anxiety and Stress Scales (DASS; Lovibond & Lovibond, Citation1993) as part of a group of measures administered to patients to assist in establishing a baseline of function and distress prior to treatment in a private practice run by the first author. The selection was made on the basis that, as well as its free availability, the DASS encompassed a number of measures within the same instrument, was convenient to use, and had a strong background literature demonstrating an ability to differentiate between anxiety and depressive disorders (e.g., Brown, Chorpita, Korotitisch, & Barlow, Citation1997).
In the practice run by the first author, it quite quickly became apparent that the norms provided in the manual were not particularly helpful in a clinical context because over half the scores fell in the ‘severe’ and ‘very severe range’, and this did not particularly correspond to subjective presentation. Using the percentiles based on the standardisation, studies gave a greater useful range of scores but was again limited as the two thirds of scores fall into the top 13 percentiles.
There would appear to be several reasons for these observed shortcomings. Despite its widespread post hoc use in clinical contexts, the DASS is not a diagnostic tool, rather providing a measure of positive and negative effects. Although the original studies included clinical populations (Lovibond & Lovibond, Citation1993), they examined a limited range of diagnoses and represented a proof of concept to establish clinical relevance.
The DASS was originally developed as a 42‐item self‐report questionnaire (Lovibond & Lovibond, Citation1993). The aim was to provide a measure of the full range of emotional experience and, in particular, the differing characteristics of depression and anxiety. The items were derived from a large item pool of questions regarding mental state attributes which was administered to a young adult population between 1979 and 1990. Factor analysis of the responses indicated three underlying constructs, two related to the original depression and anxiety, and a third cluster of items related to arousal and irritability which was termed stress (Lovibond & Lovibond, Citation1993).
The original form included 14 items in each subscale, but a shorter form with seven items in each subscale intended to allow use of the DASS when a brief scale was required (the DASS‐21). Initial findings have been replicated in numerous studies confirming that the three subscales (depression (D), anxiety (A), and stress (S)) have good internal consistency. Brown et al. (Citation1997) reported Cronbach's alpha of .96, .89, and .93 for Depression, Anxiety, and Stress respectively. Crawford and Henry (Citation2003) found a similar level of reliability in a large UK, non‐clinical sample (N = 1,771) with Cronbach's alpha of .90, .95, .93, and .97 for depression, anxiety, stress, and total score respectively and later in the shorter form (Henry & Crawford, Citation2005). Further studies that have looked at translated versions in the Netherlands (Nieuwenhuijsen, de Boer, Verbeek, Blonk, & van Dijk, Citation2003) and Spain (Bados, Solanas, & Andres, Citation2005) have confirmed the reliability and factor structure of the DASS.
Studies have also examined the performance of the DASS as a measure in clinical populations. Brown et al. (Citation1997) used referrals to an anxiety disorders clinic to confirm the latent structure of the DASS as well as its ability to differentiate between anxiety and depressive disorders. These findings were replicated by Antony, Bieling, Cox, Enns, and Swinson (Citation1998) who examined groups of patients who suffered from anxiety disorders and major depressive disorder. Clara, Cox, and Enns (Citation2001) undertook a similar study using a population referred to a mood disorders clinic. Further validation of the concept is suggested by the different functional responses to stimuli (Williams et al., Citation2007) in anxiety and depressive groups defined by the use of DASS scores. Inpatient studies have examined both overall populations (Ng et al., Citation2007) and more specifically at those with a diagnosis of depression (Page, Hooke, & Morrison, Citation2007).
As well as studies primarily supporting the reliability and validity of the DASS, other authors have used it as a measure in a range of practical research projects (e.g., Baker, Andrew, Schrader, & Knight, Citation2001; Barrett, Dadds, & Rapee, Citation1996; Davies, Citation2008; Nieuwenhuijsen et al., Citation2003). In particular, the DASS was mandated for use as part of the admission and separation measures used to evaluate the performance of private psychiatric institutions by the Strategic Planning Group for Private Psychiatric Practice (Taylor & van der Wal, Citation2004). These records in turn have provided the data for a number of further studies (e.g., Ng et al., Citation2007; Page et al., Citation2007). An issue not stated in these studies is that, while the DASS may reflect changes in clinical state, it can be argued that it is an ordinal rather than an interval scale, and that it allows only statements of a comparative nature. That said, it is generally accepted that data from the DASS can be treated as interval data. This issue warrants further investigation.
To the best of our knowledge, no study to date has examined the value of the DASS in the broader range of community psychiatric referrals. This is a significant limitation as some 80% of psychiatric and psychological services in Australia are provided in a private practice setting (Henderson, Citation2000). The closest approach is the study by Nieuwenhuijsen et al. (Citation2003) which examined a potentially clinical population by utilizing the DASS to detect anxiety and depressive symptoms in employees absent from work. Crawford, Cayley, Lovibond, Wilson, and Hartley (Citation2011) emphasised the usefulness of developing norms for different clinical populations.
The primary aims of the present study were to examine the use of the DASS in a clinical psychiatric outpatient population and to provide reference data for clinical use across a wide range of patients. Given the data collection was designed primarily for clinical use, there were no a priori hypotheses. As the preparation of this article progressed, reviews of the data raised further issues. These included the distribution of the data, whether sex or age significantly affected response patterns, whether there was a ceiling effect, and whether the veracity of responses may have affected the results.
Method
The DASS scores analysed form part of a wider set of data obtained from the clinical assessment of 2,542 patients referred to a private psychiatrist in regional New South Wales in the period 2000 to 2011. The practice receives referrals from general practitioners and hospitals in an area from southern Sydney to the far south coast and extending into the Southern Highlands. Referrals predominantly came from general practitioners but also from the public health system and prisons. There is a wide representation of socio‐economic and cultural groups and severity of illness. A secondary source of referrals was from solicitors and insurers seeking formal assessments of illness, health, and disability. There were 1,026 patients among the overall sample who were either referred for medico‐legal assessment or treatment in a medico‐legal context (such as worker compensation and criminal jurisdictions). The mean age for participants was 41.47 years (standard deviation (SD) = 13.94 years). Ages ranged from 15.38 years to 89.17 years.
The diagnoses were made by a psychiatrist and covered a wide range of conditions. The formal diagnoses were made by the consulting clinician in accordance with the Diagnostic Criteria for Research for diagnoses under the International Classification of Diseases (Version 10). The largest group suffered from depressive episode (n = 793) with other frequent diagnoses being adjustment disorders (n = 330), substance abuse (n = 204), anxiety disorders (n = 144), post‐traumatic stress disorder (n = 136), somatoform pain disorders (n = 98), and schizophrenia (n = 91). The remaining diagnoses comprised a wide range of relatively uncommon conditions. A formal secondary diagnosis was made in 362 patients, most commonly substance abuse, depressive episode, and personality disorder. In 122 patients referred for specialist psychiatric management, no formal diagnosis of psychiatric illness as a cause of their distress was warranted.
The procedure was that, on arrival at their initial consultation, all patients completed the 42 item DASS, together with some other measures, prior to their interview with the psychiatrist. The DASS‐21 measures were derived from the transcription of the designated items from the DASS‐42 and were multiplied by 2 as prescribed in the manual (Lovibond & Lovibond, Citation1995). Each study patient gave consent for the use of non‐identified information for research purposes. At the time the analysis was commenced, the procedures were reviewed and approved by the University's Human Research Ethics Committee.
Item responses were then transcribed onto an Excel database as part of the scoring procedure. This database formed the source for the data used in the present study. Additional data coded included sex, age at presentation, primary and secondary diagnoses, and whether the referral was for assessment or treatment. Statistical analysis was then carried out using SPSS version 17 (SPSS Inc., Chicago, IL, USA).
Percentile norms were calculated together with interval estimates to permit some estimation of error likely in application to the overall population (Crawford & Garthwaite, Citation2009). We used a procedure for calculating interval estimates for percentile ranks developed by Crawford and Garthwaite (Citation2009). Analyses were conducted using a computer programme downloaded from http://homepages.abdn.ac.uk/j.crawford/pages/dept/MoodScore.htm (Crawford, Garthwaite, & Slick, Citation2009).
Results
The results for both the DASS‐42 and DASS‐21 showed good reliability (Table ). The reliability of the shortened version was slightly less. In addition, the DASS‐21 scores had a slightly lower correlation when compared with the DASS‐42. The correlation between the scales was noticeably higher that that reported in the original normative studies ranging from 0.75 to 0.82 compared with the original 0.54 to 0.65 reported in the current manual (Lovibond & Lovibond, Citation1995).
Table 1. Means, standard deviations, reliability (in bold type) and correlations of DASS‐42 and DASS‐41
The group of patients who had medico‐legal issues had slightly lower mean scores for Depression and Stress (D: M = 19.65 vs M = 21.09 and S: M = 22.31 vs M = 22.93) and slightly higher for Anxiety (M = 16.64 vs M = 16.54) than the general treatment group, but the very small effect sizes (Cohen's d being 0.11, 0.05, and 0.01 respectively) indicate that although the differences are of statistical significance because of the large sample size, they are not of practical consequence.
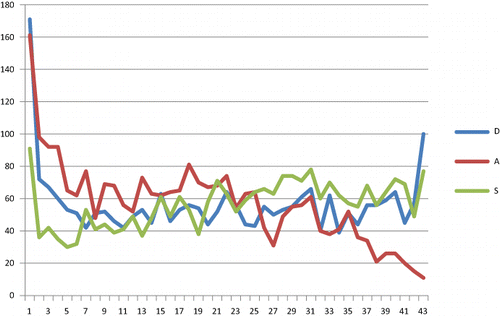
The distributions of the three scales are quite different (see Fig. 1) with the D scale having scores distributed fairly evenly over the whole range with peaks at 0 and 42, the A scale frequency being inversely related to score, and the S scale having a similar distribution to the D scale. The aggregate DASS score appears more normally distributed.
Figure 1. Distribution of Scale scores.
Males obtained significantly lower scores than females on the anxiety scale (t [2,145.23] = 3.57, p < .000, effect size = 0.15) but there were no significant differences between sexes on the other two scales (depression and stress) (see Table ).
Table 2. Means, standard deviations, and significant for scale scores by sex
Difference in scale scores across 5‐year interval age groups were analysed using Welch's analysis of variance because of violations to the homogeneity of variance assumption. Significant differences were found across age groups on each subscale (Welch F(5, 581.81) = 4.17, p = .001 for D, Welch F(5, 588.46) = 5.34, p < .000 for A, Welch F(5, 579.33) = 3.88, p = .002 for S). For the D scale post hoc testing showed that the over 70 age group had significantly lower scores when compared with the 35–44 year, 45–54 year, and 55–69 year age groups, the effect size being 0.34. For the A scale, the 15–24 age group had significantly lower scores (effect size = 0.21) than all other age groups except for those over 70. For the S subscale, the 15–24 age group had lower scores than the 35–44 and 55–69 groups (effect size = 0.17) (Table ).
Table 3. Means and standard deviations (in brackets) for scales by age group
The overall percentile rankings obtained using the method proposed by Crawford et al. (Citation2009) are set out in Tables and . It is to be noted that the scores for the DASS‐21 are listed on the basis of raw scores. This is because the primary comparison is of percentiles and it also avoids any confusion of the tables. Multiplication of the raw scores in Table by a factor of two as recommended in the manual provides a direct numerical comparison with the full DASS.
Table 4. DASS‐42 percentiles and 95% confidence intervals
Table 5. DASS‐21 percentiles and 95% confidence intervals
A comparison was also made with the comparative scores between patient groups made in other studies (see Table ). Two studies (Bados et al., Citation2005; Clara et al., Citation2001) include heterogeneous patient groups and a third (Nieuwenhuijsen et al., Citation2003) is divided essentially by severity. Our results are slightly higher than the scores of Bados et al.'s cohort but little lower than those of the hospital group used by Page et al. (Citation2007). As expected the results show a significant difference from the general population estimates of Crawford and Henry (Citation2003). Ng et al. (Citation2007) do not provide an estimate of variance with their data in a sample of over 300 inpatients given the DASS‐21 but documented noticeably higher means for depression and anxiety than those reported in Page et al. (Citation2007).
Table 6. Comparison of means and population between published study samples
Discussion
An aim of this study was to examine the use of the DASS in a clinical psychiatric outpatient population. To the best of our knowledge, it is the first to examine the use of the DASS in a large and wide‐ranging Australian clinical population. We sought to provide normative data as well as examine the internal consistency of the DASS in this population.
As in earlier studies, both forms of the DASS were shown to have a high level of reliability. The lower reliability of the DASS‐21 anxiety scale in this study seems anomalous as, while the reliability of the 21‐item scale is likely to be lower than a 42‐item scale, the difference in the anxiety scale in this study is noticeably greater than that observed with the other two scales. It is interesting that this pattern of results was observed by Henry and Crawford (Citation2005) in their general population study.
The relationship between sex and DASS scores was examined as previous studies had indicated a significant sex difference in measures of psychopathology (Haro et al., Citation2006). In our study, the only significant difference was a tendency to lower anxiety scores in males. This finding is consistent with previously obtained results (Crawford & Henry, Citation2003; Lovibond & Lovibond, Citation1995). However, given the small effect size (0.15 for anxiety), the clinical significance in individual cases is questionable.
Crawford and Henry (Citation2003) also raised the issue of an age effect on scores, noting that there were higher scores in the younger and older groups (Lovibond & Lovibond, Citation1995). This finding was contrasted with Andrew, Baker, Kneebone, and Knight (Citation2000) who observed generally lower scores in an older cohort used as a control group for a study on mood state as a predictor of neuropsychological deficits following cardiac surgery. The results in the current study showed a tendency to lower scores in the youngest and oldest groups except for the stress scale on which older participants showed scores nearer to the overall mean. The largest effect size (0.34) was for lower scores in depression in the older patients.
Earlier studies involving clinical samples used groups particularly selected to allow examination of the ability of the DASS to discriminate between anxiety and depressive disorders, and the relationship between traits and states (Antony et al., Citation1998; Brown et al., Citation1997; Clara et al., Citation2001). The present study involves a much wider range of psychiatric referrals and the correlation between the scales is higher than that seen in the original samples.
There are a number of possible reasons for this finding. First, a ceiling effect as was noted on the depression scale in an inpatient sample by Ng et al. (Citation2007). Within our own sample, there would seem possible evidence of a ceiling effect on the depression scale and perhaps on the stress scale as both these scales have a number of participants with maximum scores (Fig. 1). This effect was not evident on the anxiety scale or the total DASS score. However, a ceiling effect should imply an increased correlation between affected scales, which is not the case (see Table ). Another possibility is the complex relationship of measures of positive and negative effects across different diagnoses. Initial examination of the results across diagnoses gave unexpected results and is the reason that this issue will be examined separately.
An excess of maximum scores also raises the issue of the fidelity of patient responses. The DASS item scoring is relatively transparent and subject to individual bias. There is no lie scale built into the DASS but clinical observation of participants with maximum scores on all scales has suggested an inconsistency with their clinical state. In this sample, it is noteworthy that the patients who presented for medico‐legal assessment did not have generally higher mean scores. A further clinical observation arising from the other measures completed by the study sample was that while it was relatively common for patients completing the General Health Questionnaire (Goldberg, Citation1972) which has a similar left to right scoring pattern, to endorse all items in the right hand column (‘much worse than usual’) it was quite uncommon for them to do so for the DASS as is seen in the small numbers (2%) with maximum scores on any subscale and the rarity of a maximum score on all subscales (seven participants out of the whole sample). Only three of these were medico‐legal cases where it was considered symptom exaggeration was likely and the other four having diagnoses of schizophrenia, bipolar disorder, moderate depression, and adjustment disorder.
There were peaks at the low end of all the scales, 65 patients scoring 0 on all scales (171 scoring 0 for depression, 161 for anxiety and 91 for stress). Of the 65 patients, 25 had no current diagnosis. Other common diagnoses were schizophrenia (seven), personality disorders (six), attention deficit disorders (six), and depressive disorders (four). While from a clinical point of view there was a group of patients who could be seen as ‘faking good’, they did not have clearly defined characteristics.
One of the initial aims of the study was to provide normative data appropriate for use in the clinical setting. The original norms (Lovibond & Lovibond, Citation1995) were based on a non‐clinical sample and the mean scores of our clinical population fall above a z score of 2 (or the 95th percentile) for depression and anxiety and over the 90th percentile for stress. While such a score is useful in discrimination from the normal population because of the compressed range of scores, it is less useful in using comparative data for the level of severity of symptoms within patient groups and as a measure of treatment progress. Our impression is that patients may show substantial clinical change with no change of the nominal severity level and only marginal change of percentile score as based on the published norms. Also, the scores in our sample are not normally distributed, and therefore, z scores are a less desirable metric.
Thus, it would seem that a more practical system would be to provide data on the overall population likely to be seen in psychiatric practice and to use percentile rankings as the primary metric as advocated by Crawford et al. (Citation2009). Although there remains some correspondence between percentile levels and the originally defined severity levels of the depression and anxiety scales, the stress scale becomes divergent as the score increases. A further advantage of percentile use is that it avoids the direct implication of increased severity of illness in patients with a strong positive response set where external assessment is requested.
The use of percentiles obtained from a clinical population also allows further examination of the suggestion of the use of the DASS as a screening device in a manner analogous to the General Health Questionnaire (GHQ) made by Nieuwenhuijsen et al. (Citation2003). This is in contrast to studies in which the categorisation is made by other means and then the dimensions of anxiety and depression measured using the DASS. The suggested cut‐off scores fall in the 32nd percentile for depression and the 20th percentile for anxiety. This observation indicates that the use of these criteria is likely to miss a substantially higher number of cases than would be indicated by their original data. It should also be noted that our data also indicate that the GHQ, although developed as a screening instrument (Goldberg, Citation1972), would also miss a similar number of designated cases. However, the mean scores of patients in whom a psychiatric diagnosis was not made fell firmly within the normal population range for depression and stress (D: M = 3.77 (SD = 6.2); S: M = 5.92 (SD = 7.12)) although the anxiety scores were a little higher (M = 3.07, SD = 5.15). This might reasonably reflect particular characteristics in a group seeking psychiatric opinion.
Conclusion
The DASS provides a valid and reliable measure of affective states across a wide range of patients living in the community with psychiatric illness. While there are some variations in mean scores with age, the effect sizes are small and not clinically significant. However, the evidence available does not support the use of the DASS as a diagnostic tool.
The availability of percentile information including estimates of reliability provides useful additional information regarding comparisons over the whole range of scores.
References
- Andrew, M. J., Baker, R. A., Kneebone, A. C., & Knight, J. L. (2000). Mood state as a predictor of neuropsychological deficits following cardiac surgery. Journal of Psychosomatic Research, 48, 537–546. doi:https://doi.org/10.1016/S0022‐3999(00)00089‐1
- Antony, M. M., Bieling, P. J., Cox, B. J., Enns, M. W., & Swinson, R. P. (1998). Psychometric properties of the 42‐item and 21‐item versions of the Depression Anxiety Stress Scales in clinical groups and a community sample. Psychological Assessment, 10, 176–181. doi:https://doi.org/10.1037/1040‐3590.10.2.176
- Bados, A., Solanas, A., & Andres, R. (2005). Psychometric properties of the Spanish version of the Depression, Anxiety and Stress Scales (DASS). Psicothema, 17, 679–683.
- Baker, R. A., Andrew, M. J., Schrader, G., & Knight, J. L. (2001). Preoperative depression and mortality in coronary bypass surgery: Preliminary findings. ANZ Journal of Surgery, 71, 139–142. doi:https://doi.org/10.1046/j.1440‐1622.2001.02055.x
- Barrett, P. M., Dadds, M. R., & Rapee, R. M. (1996). Family treatment of anxiety: A controlled trial. Journal of Consulting and Clinical Psychology, 64, 333–342. doi:https://doi.org/10.1037/0022‐006X.64.2.333
- Brown, T. A., Chorpita, B. F., Korotitisch, W., & Barlow, D. H. (1997). Psychometric properties of the Depression Anxiety Stress Scales (DASS) in clinical samples. Behaviour Research and Therapy, 35, 79–89.
- Clara, I. P., Cox, B. J., & Enns, M. W. (2001). Confirmatory factor analysis of the depression‐anxiety‐stress scales in depressed and anxious patients. Journal of Psychopathology and Behavioural Assessment, 23, 61–67. doi:https://doi.org/10.1023/A:1011095624717
- Crawford, J., Cayley, C., Lovibond, P. F., Wilson, P. H., & Hartley, C. (2011). Percentile norms and accompanying interval estimates from an Australian general adult population sample for self‐report mood scales (BAI, BDI, CRSD, CES‐D, DASS, DASS‐21, STAI‐X, STAI‐Y, SRDS and SRAS). Australian Psychologist, 46, 3–14. doi:https://doi.org/10.1111/j.1742‐9544.2010.00003.x
- Crawford, J. R., & Garthwaite, P. H. (2009). Percentiles please: The case for expressing neuropsychological test scores and accompanying confidence limits as percentile ranks. The Clinical Neuropsychologist, 23, 193–204. doi:https://doi.org/10.1080/13854040801968450
- Crawford, J. R., & Henry, J. D. (2003). The Depression Anxiety Stress Scales (DASS): Normative data and latent structure in a large non‐clinical sample. The British Journal of Clinical Psychology, 42, 111–131. doi:https://doi.org/10.1348/014466503321903544
- Crawford, J. R., Garthwaite, P. H., & Slick, D. J. (2009). On percentile norms in neuropsychology: Proposed reporting standards and methods for quantifying the uncertainty over the percentile ranks of test scores. The Clinical Neuropsychologist, 23, 1173–1195. doi:https://doi.org/10.1080/13854040902795018
- Davies, G. R. W. (2008). The Psychiatric Impairment Rating Scale: Is it a valid measure? Australian Psychologist, 43, 205–212. doi:https://doi.org/10.1080/00050060801923767
- Goldberg, D. P. (1972). The detection of psychiatric illness by questionnaire. London: Oxford University Press.
- Haro, J. M., Palacin, C., Vilagut, G., Martinez, M., Bernal, M., Luque, I., … Alonso, J. (2006). Prevalence of mental disorders and associated factors: Results from the ESEMeD‐Spain study. Medicina Clinica, 126, 445–451. doi:https://doi.org/10.1157/13086324
- Henderson, S. (2000). Focus on psychiatry in Australia. The British Journal of Psychiatry: The Journal of Mental Science, 170, 97–101.
- Henry, J. D., & Crawford, J. R. (2005). The short‐form version of the Depression, Anxiety Stress Scales (DASS‐21): Construct validity and normative data in a large non‐clinical sample. The British Journal of Clinical Psychology, 44, 227–239. doi:https://doi.org/10.1348/014466505X29657
- Lovibond, S. H., & Lovibond, P. F. (1993). Manual for the Depression, Anxiety and Stress Scales. Sydney: Psychology Foundation of Australia.
- Lovibond, S. H., & Lovibond, P. F. (1995). Manual for the Depression, Anxiety and Stress Scales (2nd ed.). Sydney: Psychology Foundation of Australia.
- Ng, F., Trauer, T., Dodd, S., Callaly, T., Campbell, S., & Berk, M. (2007). The validity of the 21‐item version of the Depression Anxiety Stress Scales as a routine clinical outcome measure. Acta Neuropsychiatrica, 19, 304–310. doi:https://doi.org/10.1111/j.1601‐5215.2007.00217.x
- Nieuwenhuijsen, K., de Boer, A. G. E. M., Verbeek, J. H. A. M., Blonk, R. W. B., & van Dijk, F. J. H. (2003). The Depression Anxiety Stress Scale (DASS): Detecting anxiety disorder and depression in employees absent from work because of mental health problems. Occupational and Environmental Medicine, 60, i77–i82. doi:https://doi.org/10.1136/oem.60.suppl_1.i77
- Page, A. C., Hooke, G. R., & Morrison, D. L. (2007). Psychometric properties of the Depression Anxiety Stress Scales (DASS) in depressed clinical samples. The British Journal of Clinical Psychology, 46, 283–297. doi:https://doi.org/10.1348/014466506X158996
- Taylor, P., & van der Wal, B. (2004). Strategic Planning Group for Private Psychiatric Services (SPGPPS) (pp. 1–7). Barton, ACT: National SPGPPS Secretariat.
- Williams, L. M., Kemp, A. H., Felmingham, K., Liddell, B. J., Palmer, D. M., & Bryant, R. A. (2007). Neural biases to covert and overt signals of fear: Dissociation by trait anxiety and depression. Journal of Cognitive Neuroscience, 19, 1595–1608. doi:https://doi.org/10.1162/jocn.2007.19.10.1595