
Abstract
Background
Accurate diagnosis in patients presenting with lesions at various locations within the visual pathway is challenging. This study investigated functional and structural changes secondary to such lesions to identify patterns useful to guide early and effective management.
Methods
Over 10,000 records from patients referred for optic nerve head assessment were reviewed and 31 patients with a final diagnosis of likely neuropathic lesions posterior to the eye were included in the current study. Fundus photographs, optic coherence tomography images and visual field tests were evaluated for changes with respect to retinal nerve fibre layer topography and prediction of structure‐function paradigms. Emerging clinical patterns were examined for their consistency with the likely anatomical origin of the underlying insult in the presence of varying diagnoses.
Results
Data from patients with lesions along the visual system allowed identification of retinal nerve fibre layer asymmetry correlated with visual field defects and ganglion cell analysis. Bilateral discordance in retinal nerve fibre loss easily discernible from an altered pattern of the temporal‐superior‐nasal‐inferior‐temporal curve was characteristic for post‐chiasmal lesions. These sometimes‐subtle changes supported diagnosis in cases with multiple aetiologies or with ambiguous visual field analysis and/or ganglion cell loss.
Conclusion
Intricate knowledge of the retinal architecture and projections allows coherent predictions of functional and structural deficits following various lesions affecting the visual pathway. The integration of adjunct imaging and retinal nerve fibre layer thinning will assist clinicians to guide clinical investigations toward a likely diagnosis in the light of significant individual variations. The case series presented in this study aids in differential diagnosis of retrograde optic neuropathies by using retinal nerve fibre layer asymmetric patterns as an important clinical marker.
Author included posthumously
Optic neuropathies comprise a group of degenerative disorders of diverse aetiologies that are characterised by the loss of retinal ganglion cells. Accurate diagnosis is complex due to variability and overlap in clinical signs and symptoms, as well as the delay between original pathology and visual manifestation at the optic nerve head. Acute injury to the retinal ganglion cells might take four to six weeks for visible clinical manifestation of optic atrophy (pale optic disc) but can be prolonged with peripapillary retinal nerve fibre layer loss.Citation2009 Conditions caused by cortical insults resulting in retrograde degeneration may emulate retinal nerve fibre layer and visual field defects typically expected with slowly progressing chronic conditions.Citation2013 Even changes to the optic nerve head classically expected with glaucoma or arteritic anterior ischaemic optic neuropathy, such as cupping,Citation2010 have been associated with multiple other aetiologies.Citation2001 Yet, accurate diagnosis is pivotal in primary eye care for appropriate and timely management to curtail potentially significant threats to vision or mortality, from conditions ensuing from optic neuropathies potentially leading to retrograde degeneration. Therefore, structural assessment guiding differential diagnoses can not necessarily rely solely on stereoscopic fundoscopy, the current gold standard and recommended clinical procedure of choice.Citation2016 Reliable and reproducible neuro‐imaging techniques, such as optical coherence tomography (OCT),Citation2015 computerised tomography and magnetic resonance imaging,Citation2010 significantly improve diagnostic abilities.Citation2013 Of these, OCT is widely adopted in primary ophthalmic practice and may assist in the differentiation of optic neuropathies.Citation2014
A first understanding of the relationship between visual function and brain lesions originated from the charting of war‐related head injuries,Citation1945 subsequently refined, with the help of newly developed technologies, producing a comprehensive map of insults to the visual cortex and corresponding visual field defects.Citation1999 More specifically, degeneration of grey matter in the temporal and occipital regions of the brain is associated with ganglion cell and inner plexiform layer thinningCitation2015 but typically does not affect the inner nuclear layer.Citation2012 Anatomically, retrograde degeneration is observed as direct retrograde degeneration, when axonal or terminal lesions posterior to the eye up to the lateral geniculate nucleus lead to deterioration of the affected axons back to the retinal ganglion cell bodies in the eye from whence they originate.Citation2013 In contrast, trans‐synaptic (trans‐neuronal) retrograde degeneration ensues from primary lesions past the lateral geniculate nucleus up to and including the primary visual cortex. Clinically, all post‐chiasmal retrograde degenerations manifest as bow‐tie atrophy on the contralateral side to the lesion and temporal pallor on the ipsilateral side,Citation2003 resulting in congruous visual field loss that should correspond with a homonymous pattern of retinal nerve fibre loss over time, with longevity of the lesion. Due to the frequent and poorly understood variability in observed retinal nerve fibre and visual field defectsCitation2013 retinal ganglion cell loss is often preferred as a clinical marker for diagnosis.Citation2014 Furthermore, the retinotopic location of retinal nerve fibre axons entering the optic nerve head can cause early changes to be concealed from clinical observation, visual field testing or OCT peripapillary retinal nerve fibre layer profiles, despite being readily observed in macular ganglion cell measures. Therefore, a number of recent studies provided strong arguments to perform ganglion cell analysis in patients with suspected retrograde degeneration to take advantage of the concordance with visual field loss for diagnosis.Citation2014
Injuries at the chiasm are somewhat unique in triggering a particularly characteristic defect, termed band optic atrophy, which affects ganglion cells nasal to the optic disc and fovea.Citation2003 Typically, corresponding visual field defects are described as temporal hemianopia, with the exact extent dependent on the site and size of the chiasmal depression.Citation2002 While retinal nerve fibre loss was recently confirmed as an excellent predictor of visual outcome after pituitary decompression,Citation2015 it is not well correlated with band optic atrophy.Citation2003 We performed an extensive case study to identify commonalities in visual field, retinal nerve fibre layer and ganglion cell changes caused by retrograde degeneration and ascertain clinically relevant features to guide differential diagnosis in primary eye care.
METHODS
The Centre for Eye Health (CFEH) provides testing and diagnostic services to local eye care providers on a referral‐only basis.Citation2015 Of 10,451 patients aged 18 to 80 years seen between January 2010 and August 2015 at CFEH, 34 (0.3 per cent) were diagnosed by the attending optometrist and consulting ophthalmologist with optic neuropathy secondary to lesions posterior to the eye. Patients with a spherical equivalent worse than −3.00 D were excluded from the study to avoid any potential bias due to myopic changes of the optic nerve head. Written consent was obtained from 31 patients following the tenants of the Declaration of Helsinki and approved by the Biomedical Human Research Ethics Advisory Panel of the University of New South Wales in Australia. Diagnoses for these patients were re‐evaluated by a general ophthalmologist and retina specialist and provide the basis for the current series of cases. To discern clinical components relevant to retrograde degeneration resulting from the original insult, patients with a diverse range of individual diagnoses were divided into groups by pathology affecting distinct locations of the visual pathway (Table ).
Table 1. Classification of 31 clinical cases with retrograde degeneration
Clinical data on all cases were carefully reviewed to develop a better understanding of the spectrum of defects of the visual field, retinal nerve fibre layer and retinal ganglion cells expected with retrograde degeneration and their correlations. In short, we used a ‘reverse mapping’ approach (for details see case 1) mapping visual field defects onto the specific organisation, in which ganglion cell fibres enter the optic nerve to plot retinal nerve fibre loss.Citation2012 An accurate and complete diagnosis pertaining to the presented cases was obtained wherever possible. Due to the unique position of CFEH as a referral‐only centre and the consequent onus of care residing with the referring practitioner, patients were not always able or willing to disclose the exact nature of their original diagnosis. Information pertinent to the presented cases was provided as detailed as available (Table , Table S1). The case series resulted in the development of a schematic representation of clinical changes expected with retrograde degeneration secondary to dysfunction in various parts of the visual pathway.
Table 2. Patient characteristics
RESULTS
Case 1: detailed work‐up of a retrograde degeneration case study
CORRELATING VISUAL FIELD, RETINAL GANGLION CELL AND RETINAL NERVE FIBRE LOSS
Ferreras and colleaguesCitation2008 predicted the clock hour position of the associated fibres entering the optic nerve head for each point of the standard 24–2 Swedish interactive thresholding algorithm visual field (Figure 1A, B, F and G), which was subsequently stylised (Figure 1A1, B1, F1 and G1). Thus, any deficit in the visual field test should be associated with a loss of retinal nerve fibres at the corresponding position(s) and assist with detailed diagnosis of observed retinal nerve fibre loss. We further expanded this model by using information on the relative number of fibres described by Ferreras and colleaguesCitation2008 for individual clock hour sectors and the total central retinal draft area for each fibre bundle to estimate the relative impact of such loss in relation to the total number of fibres present at each location (Figure 1B and G). Of note, based on the limitations in size and resolution of the visual field test used for this predication, the current model does not provide information on clock hours four and nine. With regard to clock hour nine, it is commonly accepted that the retinal nerve fibre layer at this location comprises axons derived from macular ganglion cells. Consequently, we included this clock hour in our model predicting significant retinal nerve fibre loss with macular damage (Figure 1B and G, grey arrows).
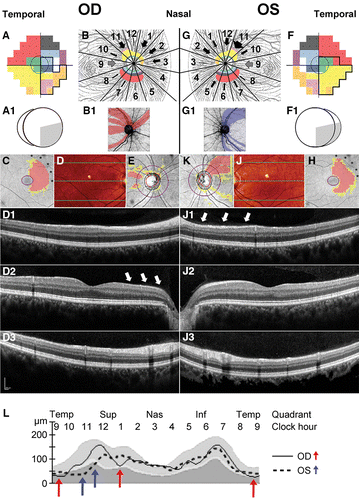
A temporal loss of vision in the right eye of a 38‐year‐old male patient (Patient 1, Figure 1A) was mirrored in the corresponding thinning of the nasal ganglion cell complex (Figure 1C) in concordance with the above‐developed model. Affected nerve fibre bundles predicted to be interspersed with unaffected bundles (Figure 1B1) are clinically manifested in an irregular pattern of retinal nerve fibre loss (Figure 1E). This loss was predominantly visible nasal to the macula (Figure 1D2), an area that is not represented in a standard visual field, as it corresponds approximately to the horizontal midline.Citation2012 Corroborating the predicted pattern, the nasal visual field defect of the left eye (Figure 1F) is associated with a thinning of the temporal ganglion cell complex (Figure 1H) and a corresponding arcuate nerve fibre bundle loss (Figure 1K) with the majority of thinning apparent superotemporal to the optic nerve head (Figure 1J1). Combined nerve fibre loss for both eyes results in discordant asymmetries of the undulating pattern in the temporal‐superior‐nasal‐inferior‐temporal (TSNIT) curve (Figure 1L), with thinning in sectors 11 and possibly 5 in the eye ipsilateral (left eye, Figure 1L, blue arrows) and sectors 9 and potentially 1 thinned in the eye contralateral (right eye, Figure 1L, red arrows) to the original brain lesion.
INTEGRATION OF FINDINGS TO ARRIVE AT A DEFINITIVE DIAGNOSIS FOR PATIENT 1
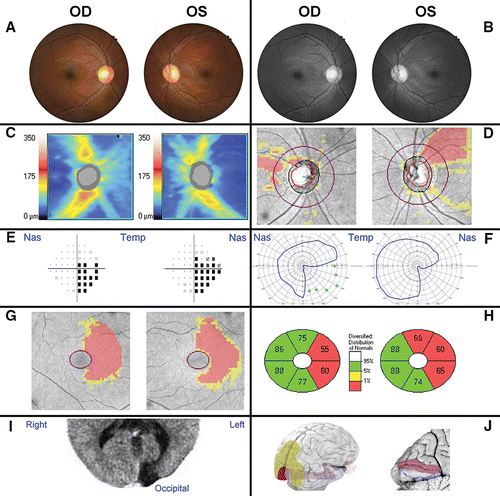
Patient 1 was first referred for glaucoma assessment due to asymmetric optic nerve cupping (right more than left) and distinct superior retinal nerve fibre bundle loss in the left eye. Optic nerve head assessment for this and all subsequent patients included patient's medical and family history, age, gender, visual acuity, relevant symptoms, patient history and known or inferred lesion location and pathology, slit‐lamp examination and funduscopy. Stereoscopic optic disc images and posterior pole fundus images were obtained through dilated pupils with a non‐mydriatic fundus camera (Kowa nonmyd WX 3D Stereo Fundus Camera; Kowa, Tokyo, Japan) and reductions in the peripapillary nerve fibre layer were qualitatively discerned with direct clinical visualisation (Figure 2A and B). Quantitative measurement was confirmed using spectral domain OCT images from a Cirrus OCT (Cirrus HD‐OCT 4000, version 7.0; Carl Zeiss Meditec, Dublin, California, USA) acquired with the optic disc cube 200 × 200 protocol centred on the optic disc (Figure 2C and D). Visual field tests taken with the Humphrey Field Analyzer 750 (Zeiss/Humphrey Systems, Dublin, California, USA) and Goldmann perimetry (MT‐325UD projection perimeter; Takagi Ophthalmic Instrument Europe Ltd, Manchester, UK) appeared congruous and respecting the vertical meridian, highly suggestive of post‐chiasmal retrograde degeneration (Figure 2E and F). Of note, visual field tests with the Humphrey Field Analyzer were generally considered reliable, if they were completed with less than 20 per cent fixation loss, false‐negative or false‐positive error. While the optic nerve head and retinal nerve fibre layer changes were non‐symmetric and in potential discordance with the visual field defect, retinal ganglion cell analysis obtained with the same Cirrus OCT using the Macular Cube 512 × 128 protocol centred on the macular for ganglion cell analysis corroborated a non‐glaucomatous aetiology (Figure 2G and H). Upon further questioning, the patient reported having suffered meningitis at two weeks of age resulting in a cortical lesion at the left calcarine fissure, diagnosed at 16 years of age (Figure 2I). Based on the concordance of clinical findings with the developed correlation between visual field defects and nerve fibre loss, the infantile meningitis insult was identified as the sole reason for the observed clinical features.
Cases 2 to 7: clinical presentation of post‐chiasmal retrograde degeneration
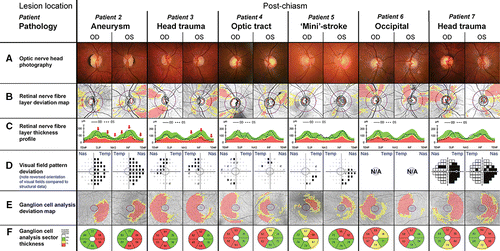
Half of all patients (15 of 31) included in this study displayed clinical signs consistent with post‐chiasmal lesions (Table ). Six representative cases are shown to demonstrate variability in presentation and highlight common features (Table , Figure 3). A suggested homonymous pattern of visual field defects was generally indicative of post‐chiasmal lesions (Figure 3D), although OCT imaging proved comparatively more sensitive and has the added advantage of being an objective procedure (Figure 3E and F). In addition to the congruous changes in visual field defects and retinal ganglion cell loss, patients with confirmed post‐chiasmal lesions always exhibited the described discordant asymmetry pattern in the TSNIT curve caused by the differences between the eyes in the location of retinal nerve fibre layer thinning (Figure 3C, highlighted by arrows in Patients 2 and 3) with few or no regions affected by bilateral depression. The consistency between expected ganglion cell analysis and retinal nerve fibre patterns supported diagnosis of retrograde degeneration even in the absence of marked reductions in the visual field at the time of examination (Figure 3D, Patient 4). A right inferior quadrantanopia observed in Patient 5 was suggested by the visual field test results and the ganglion cell analysis (Figure 3D–F). The matching, yet subtle corroborating changes in the retinal nerve fibre layer (Figure 3B) could easily be overlooked without intricate knowledge of the underlying correlation. This is even more important as individual patients may display significant thinning of the retinal nerve fibre layer, which is not necessarily flagged as statistically significant in comparison to a normative range. Retinal nerve fibre layer thinning was much more pronounced in both Patients 6 and 7 (Figure 3B and C).
Cases 8 to 11: clinical presentation of pre‐chiasmal and chiasmal lesions
Anterior chiasmal syndrome, commonly induced by tumours of the pituitary gland and less frequently by craniopharyngioma and pre‐chiasmal conditions can largely vary in the expression of retinal nerve fibre layer thinning depending on the main site of damage. Diagnosis of pre‐chiasmal lesions is signified by either unilateral structural and/or functional loss supported by compatible patterns of visual field deficit and nerve fibre loss and patients typically presenting with various other clinical signs and symptoms. Due to the large variations in clinical presentation and the frequent presence of other diagnostic symptoms, we have only provided one representative case and detailed analysis (Figure 4, Patient 8).
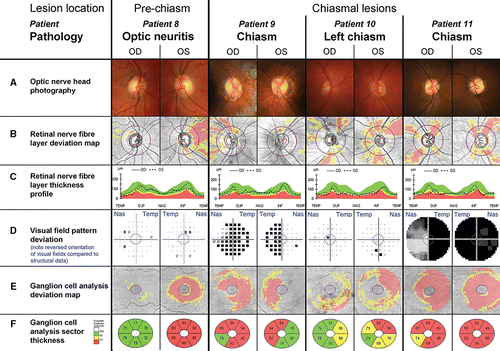
In contrast, diagnosis of chiasmal insults, while relatively rare, is particularly critical as visual defects may be the earliest symptom of disease. Patients identified during this study varied from subtle unilateral changes to extended bilateral field defects with preferential temporal loss (Figure 4, Patients 9 to 11). The specific anatomical basis of the nerve fibre layer contributing to temporal visual field loss explains why chiasmal lesions are particularly difficult to identify through retinal nerve fibre layer analysis. A bilateral, ‘star‐like’ pattern of retinal nerve fibre layer thinning was present in all reviewed cases (Figure 4B), which would be predicted due to the spread in nerve fibre bundles damaged by lesions at or around the chiasm. Optic disc pallor was present only in Patient 9 with established pituitary gland tumour for over 10 years, most prominently in the right eye (Figure 4A). Diagnosis of chiasmal lesions from ganglion cell analysis and visual fields was particularly difficult in cases with early changes (Patient 10), when the affected areas appear random and at a late stage of disease (Patient 11), when the extensive damage masked any particular configuration of damage (Figure 4D–F).
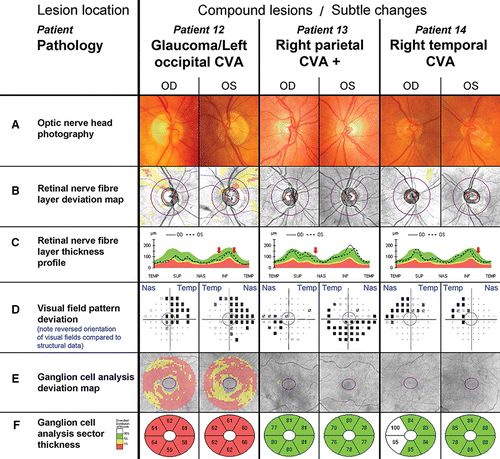
Cases 12 to 14: selected complex cases
Two main obstacles to accurate diagnosis of conditions with ganglion cell loss are co‐morbidities and interpretation of results with regard to a normal reference. Patient 12 reported an episode of transient double vision six months prior to clinical examination, followed by partial obstruction of vision. A bilateral superior arcuate nerve fibre bundle defect is highly suggestive of glaucomatous neuropathy (Figure 5B) but functional assessment pointed toward a right superior quadrantanopia (Figure 5D) consistent with changes to the inferior optic nerve head margins (Figure 5C, red arrows). Subsequent brain scans confirmed a left inferior occipital lobe lesion. Given the short time since the lesion occurred, the nerve fibre damage may become more pronounced over time, such as in Patient 13, who suffered a cardiovascular accident four years prior to presenting for examination (Figure 5C, red arrow). This case was particularly interesting due the left visual field having been compromised by an electric shock five years before the cardiovascular accident (Figure 5D) and both retinal nerve fibres and ganglion cell scans staying within normal limits (Figure 5B, E and F). The latter was also true for Patient 14, who had suffered a cardiovascular accident 15 years prior to examination, developed left superior quadrantanopia with macular sparing (Figure 5D), associated asymmetries in the TSNIT curve (Figure 5C) and possible thinning in the ganglion cell analysis sectoral analysis specifically of the left eye (Figure 5F). Due to the variation in retinal nerve fibre layer thickness and loss after injury for individual patients, subtle changes (Figure 5C, red arrow) can support a diagnosis in patients with otherwise little or no structural changes.
DISCUSSION
Reconciling incongruent functional and structural clinical information
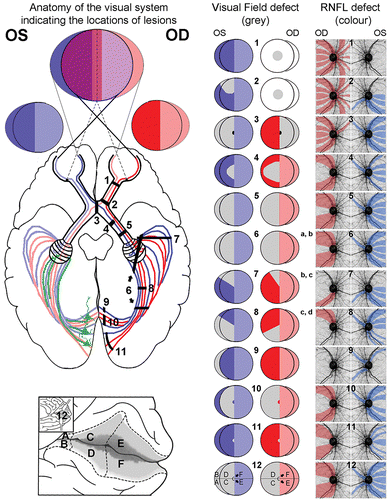
Retinal nerve fibre patterns corroborate visual field data for lesions located before and including the optic chiasm but they are discordant between the two eyes and with visual field deficit, if the lesions are post‐chiasmal.Citation2014 Retrograde degeneration originating from post‐chiasmal lesions results in a homonymous pattern of visual field loss due to the partial decussation of optic nerve axons at the optic chiasm.Citation2009 The comprehensive study of presented cases allowed us to extend the known relationship between the site of a lesion and the resulting visual field defect to the corresponding pattern of retinal nerve fibre layer thinning (Figure 6). While there is seemingly large variation in the nerve fibre loss with retrograde degeneration, this reference can be used to guide diagnosis through association of clinical observations with the most likely location(s) of the causative insult.
An important consideration in diagnosing underlying conditions causing associated ganglion cell loss is the time frame within which the respective degeneration occurred and differentiation from expected age‐related decrease in retinal nerve fibres. The mean retinal nerve fibre layer thickness decreases more rapidly in patients with homonymous hemianopia during the first 24 months following injury.Citation2012 Due to the wide range of normative data and large variation in the changes to the retinal nerve fibre layer following cerebral insult,Citation2012 reduced thickness may only occur marginally and does not need to fall outside normal limits and thus will not be flagged as significant loss by automated OCT algorithms. This was noted in some of the presented patients, most markedly Patient 14, who showed almost no discernible structural changes 15 years after suffering from a cardiovascular accident. If OCT baseline data were available from patients prior to or at the beginning of such events, changes could be evaluated more accurately for individual patients rather than in comparison to a normative range. The accrual of baseline data from healthy patients would significantly aid in the recognition of later changes, whether disease or age‐related and can be used for progression analysis, given the high test‐retest reliability of these instruments.Citation2015 As various conditions leading to retrograde degeneration are not exclusive, accurate diagnosis may not always be possible.
The most common differential diagnosis as well as co‐morbidity to retrograde degeneration remains the slowly progressive glaucomatous neuropathy.Citation2013 It is not uncommon that patients are initially diagnosed and sometimes treated for glaucoma.Citation2014 OCT measurements could support differential diagnosis in these cases, as well as provide evidence of lesions prior to a recognisable visual field defect.Citation2015 Given that glaucoma originates as a pre‐chiasmal disease, the retinal nerve fibre loss should correspond to the visual field loss, although the two eyes often display asymmetry.Citation2004 Based on the retinotopic organisation of retinal axons, areas of reduced vision are expected to respect the horizontal but not the vertical meridian, particularly in the superior and/or inferior aspects in its typical form (Figure S1, Patient 15). We have provided examples in the supplementary materials (Table S1, Figure S1) to highlight typical patterns of glaucomatous patients even in the absence of raised intraocular pressure (Patients 16–18: normal tension glaucoma) or unilateral manifestation (Patient 19). In addition to comorbidities, it has to be noted that the demonstrated structural and functional changes characteristic of retrograde degeneration may be masked by congenital variations of the optic nerve head, such as myopic or tilted discs.
The exact mechanism of retrograde degeneration remains to be elucidated but brain‐derived neurotrophic factor is thought to be a key player in the activation of the apoptotic cascade in sensory neurons, both antegrade and retrograde,Citation2006 possibly in combination with increased sensitivity to atrophy due to the loss of neuroplasticity.Citation2014 Consequently, post‐synaptic cells from neuronal junctions at the lateral geniculate nucleus can indirectly trigger loss of primary optic nerve cells with the same consequences as direct insults on the optic tract. In addition to well‐defined apoptotic pathways (for overview see You and colleaguesCitation2013), the death of pyramidal cells located in layer VI of the visual cortex (Figure 6, green) may contribute to axonal degeneration subsequent to insult along the optic tract. Consequently, the resulting retinal ganglion cell loss closely follows the distinct and well‐defined topography of the nerve fibre layer for both eyes and is not a consequence of random effects, such as elevated intracranial pressure, which would produce asymmetric arcuate‐like patterns of nerve fibre loss.Citation46 Thus, distinct features are observed for pre‐ and post‐chiasmal insults leading to retinal ganglion cell loss (Figure 7).
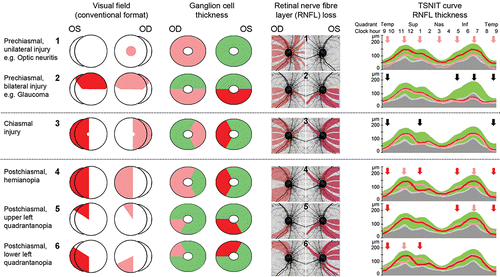
Post‐chiasmal retrograde degeneration
Congruous change in ganglion cell analysis
Ganglion cell analysis obeys vertical midline
Discordance of visual field/ganglion cell analysis with retinal nerve fibre layer analysis
Retinal nerve fibre layer asymmetry, most notably in the supero‐ and/or infero‐nasal aspects.
Pre‐chiasmal optic degeneration
Incongruous change in ganglion cell analysis
Ganglion cell analysis obeys horizontal midline
Largely concordance of visual field/ganglion cell analysis with retinal nerve fibre layer analysis
Often unilateral or areas of bilateral symmetrical retinal nerve fibre layer thinning.
CONCLUSION
We have demonstrated that deviations in the thickness of the retinal nerve fibre layer strictly respect anatomical topography and can help with differential diagnosis of optic neuropathies. The identification of retrograde or progressive nerve fibre degeneration is dependent on the time since insult, location of lesions and potential variations in the rate of degeneration. Diagnoses of the presented cases was reliant on high‐resolution scans and partly the interpretation of their changes with respect to normative databases, as well as results from published investigations on the central 24–2 visual field.Citation2008 As future information becomes available, we expect further refinement of the retinal nerve fibre layer reverse map. The ultimate step to optimise the plotting of retinal ganglion cells with different disorders may involve accrual of baseline data and individualised maps.Citation2014
The differentiation of optic neuropathies, particularly in the face of combined aetiologies and individual variations in the ganglion cell/nerve fibre layer complex, remains a clinical challenge. Systematic and comprehensive evaluation of clinical information enhances diagnostic acumen, as long as the clinician can differentiate useful from not‐so‐useful clinical information.Citation2015 Therefore, adding to long standing criteria, we have developed an expanded and improved clinical reference (Figure 6) to aid in the differential diagnosis of optic neuropathies. Even in the absence of other tell‐tale signs, a clinician armed with knowledge of the retinotopic organisation of axons entering the optic nerve head and carefully inspecting the OCT measures of the peripapillary nerve fibre layer may confidently suspect a signifying pattern of nerve fibre loss (Figure 7).
Additional supporting information may be found in the online version of this article at the publisher’s website:
Figure S1. Variations of clinical findings with glaucoma.
Table S1. Glaucoma patients’ characteristics. All lesions were located in the optic nerve head.
tceo_a_12124168_sm0001.pdf
Download PDF (698.4 KB)tceo_a_12124168_sm0002.pdf
Download PDF (31.4 KB)ACKNOWLEDGEMENTS
The authors extend particular thanks to the clinicians at CFEH, without whose exceptional expertise and efforts patient data collection and reviews would have been impossible.
This work was supported, in part, by a grant from the National Health and Medical Research Council (NHMRC) of Australia (1033224). Guide Dogs NSW/ACT is also a partner on the NHMRC grant and supplemented a PhD scholarship to Agnes Choi, who holds an Australian Postgraduate Award. Dr Zangerl holds a Faculty Research Grant awarded by the School of Optometry and Vision Science, University of New South Wales, Australia. Dr Kim was supported by an Australian Research Council (ARC) Future Fellowship (FT140100535).
Additional information
Funding
Notes
Author included posthumously
REFERENCES
- Hayreh SS. Ischemic optic neuropathy. Prog Retin Eye Res 2009; 28: 34–62.
- Park HY, Park YG, Cho AH et al. Trans‐neuronal retrograde degeneration of the retinal ganglion cells in patients with cerebral infarction. Ophthalmology 2013; 120: 1292–1299.
- Pasol J. Neuro‐ophthalmic disease and optical coherence tomography: glaucoma look‐alikes. Curr Opin Ophthalmol 2011; 22: 124–132.
- Huang‐link YM, Al‐hawasi A, Eveman I. Retrograde degeneration of visual pathway: hemimacular thinning of retinal ganglion cell layer in progressive and active multiple sclerosis. J Neurol 2014; 261: 2453–2456.
- Jindahra P, Petrie A, Plant GT. The time course of retrograde trans‐synaptic degeneration following occipital lobe damage in humans. Brain 2012; 135: 534–541.
- Klistorner A, Sriram P, Vootakuru N et al. Axonal loss of retinal neurons in multiple sclerosis associated with optic radiation lesions. Neurology 2014; 82: 2165–2172.
- Danesh‐meyer HV, Boland MV, Savino PJ et al. Optic disc morphology in open‐angle glaucoma compared with anterior ischemic optic neuropathies. Invest Ophthalmol Vis Sci 2010; 51: 2003–2010.
- Ambati BK, Rizzo JF 3rd. Non‐glaucomatous cupping of the optic disc. Int Ophthalmol Clin 2001; 41: 139–149.
- Piette SD, Sergott RC. Pathological optic‐disc cupping. Curr Opin Ophthalmol 2006; 17: 1–6.
- Zhang YX, Huang HB, Wei SH. Clinical characteristics of non‐glaucomatous optic disc cupping. Exp Therap Med 2014; 7: 995–999.
- Prum BE Jr, Rosenberg LF, Gedded SJ et al. Primary Open-Angle Glaucoma Preferred Practice Pattern guidelines. Ophthalmology 2016; 123: P41–P111.
- Wong E, Yoshioka N, Kalloniatis M et al. Cirrus HD‐OCT short‐term repeatability of clinical retinal nerve fiber layer measurements. Optom Vis Sci 2015; 92: 83–88.
- Golnik K. Non‐glaucomatous optic atrophy. Neurol Clin 2010; 28: 631–640.
- Xue K, Hildebrand GD. Retinal imaging: what the neurologist needs to know. Pract Neurol 2013; 13: 236–244.
- Chiang J, Wong E, Whatham A et al. The usefulness of multimodal imaging for differentiating pseudopapilloedema and true swelling of the optic nerve head: a review and case series. Clin Exp Optom 2015; 98: 12–24.
- Jamous KF, Kalloniatis M, Hayen A et al. Application of clinical techniques relevant for glaucoma assessment by optometrists: concordance with guidelines. Ophthalmic Physiol Opt 2014; 34: 580–591.
- Simao LM. The contribution of optical coherence tomography in neurodegenerative diseases. Curr Opin Ophthalmol 2013; 24: 521–527.
- Holmes G. The organizatin of the visual cortex in man. Proc Roy Soc Lond Ser B 1945; 132: 348–361.
- Wong AM, Sharpe JA. Representation of the visual field in the human occipital cortex: a magnetic resonance imaging and perimetric correlation. Arch Ophthalmol 1999; 117: 208–217.
- Ong YT, Hilal S, Cheung CY et al. Retinal neurodegeneration on optical coherence tomography and cerebral atrophy. Neurosci Lett 2015; 584: 12–16.
- Sriram P, Graham SL, Wang C et al. Trans‐synaptic retinal degeneration in optic neuropathies: optical coherence tomography study. Invest Ophthalmol Vis Sci 2012; 53: 1271–1275.
- Gabilondo I, Sepulveda M, Ortiz‐perez S et al. Retrograde retinal damage after acute optic tract lesion in MS. J Neurol Neurosurg Psychiatry 2013; 84: 824–826.
- Trip SA, Schlottmann PG, Jones et al. Optic nerve atrophy and retinal nerve fibre layer thinning following optic neuritis: evidence that axonal loss is a substrate of MRI‐detected atrophy. NeuroImage 2006; 31: 286–293.
- Savino PJ, Danesh‐meyer HV. Retrochiasmal disorders. In: Rapuano CJ ed. Color Atlas & Synopsis of Clinical Ophthalmology: Neuro‐Ophthalmology. Columbus, Ohio: McGraw‐Hill Companies, Inc, 2003. pp 132–141.
- Jindahra P, Petrie A, Plant GT. Retrograde trans‐synaptic retinal ganglion cell loss identified by optical coherence tomography. Brain 2009; 132: 628–634.
- Shon K, Sung KR. Assessment of macular ganglion cell loss patterns in neurologic lesions that mimic glaucoma. Korean J Ophthalmol 2014; 28: 314–322.
- Kardon RH. Role of the macular optical coherence tomography scan in neuro‐ophthalmology. J Neuro‐ophthalmol 2011; 31: 353–361.
- Keller J, Sanchez‐dalmau BF, Villoslada P. Lesions in the posterior visual pathway promote trans‐synaptic degeneration of retinal ganglion cells. PloS One 2014; 9: e97444.
- Meier PG, Maeder P, Kardon RH et al. homonymous ganglion cell layer thinning after isolated occipital lesion: macular OCT demonstrates transsynaptic retrograde retinal degeneration. J Neuro‐ophthalmol 2015; 35: 112–116.
- Foroozan R. Chiasmal syndromes. Curr Opin Ophthalmol 2003; 14: 325–331.
- Fujimoto N, Saeki N, Miyauchi O et al. Criteria for early detection of temporal hemianopia in asymptomatic pituitary tumor. Eye 2002; 16: 731–738.
- Monteiro ML, Zambon BK, Cunha LP. Predictive factors for the development of visual loss in patients with pituitary macroadenomas and for visual recovery after optic pathway decompression. Can J Ophthalmol 2010; 45: 404–408.
- Danesh‐meyer HV, Wong A, Papchenko T et al. Optical coherence tomography predicts visual outcome for pituitary tumors. J Clin Neurosci 2015; 22: 1098–1104.
- Monteiro ML, Medeiros FA, Ostroscki MR. Quantitative analysis of axonal loss in band atrophy of the optic nerve using scanning laser polarimetry. Br J Ophthalmol 2003; 87: 32–37.
- Jamous KF, Kalloniatis M, Hennessy MP et al. Clinical model assisting with the collaborative care of glaucoma patients and suspects. Clin Exp Ophthalmol 2015; 43: 308–319.
- Asaoka R, Russell RA, Malik R et al. A novel distribution of visual field test points to improve the correlation between structure‐function measurements. Invest Ophthalmol Vis Sci 2012; 53: 8396–8404.
- Ferreras A, Pablo LE, Garway‐heath DF et al. Mapping standard automated perimetry to the peripapillary retinal nerve fiber layer in glaucoma. Invest Ophthalmol Vis Sci 2008; 49: 3018–3025.
- Johnson H, Cowey A. Transneuronal retrograde degeneration of retinal ganglion cells following restricted lesions of striate cortex in the monkey. Exp Brain Res 2000; 132: 269–275.
- Wong E, Yoshioka N, Kalloniatis M et al. Cirrus HD‐OCT short‐term repeatability of clinical retinal nerve fiber layer measurements. Optom Vis Sci 2015; 92: 83–88.
- Heijl A, Buchholz P, Norrgren G et al. Rates of visual field progression in clinical glaucoma care. Acta Ophthalmol 2013; 91: 406–412.
- Moon H, Yoon JY, Lim HT et al. Ganglion cell and inner plexiform layer thickness determined by spectral domain optical coherence tomography in patients with brain lesions. Br J Ophthalmol 2015; 99: 329–335.
- Weinreb RN, Khaw PT. Primary open‐angle glaucoma. Lancet 2004; 363: 1711–1720.
- Wang H, Wu LL, Song XY et al. Axonal transport of BDNF precursor in primary sensory neurons. European J Neurosci 2006; 24: 2444–2452.
- Balk LJ, Twisk JW, Steenwijk MD et al. A dam for retrograde axonal degeneration in multiple sclerosis? J Neurol Neurosurg Psychiatry 2014; 85: 782–789.
- You Y, Gupta VK, Li JC et al. Optic neuropathies: characteristic features and mechanisms of retinal ganglion cell loss. Rev Neurosci 2013; 24: 301–321.
- American Academy of Ophthalmology. Basic and Clinical Science Course: Neuro‐Ophthalmology. Singapore, 2013–2014; section 5. San Francisco: American Academy of Ophthalmology, 2013.
- Denniss J, Turpin A, Mckendrick AM. Individualized structure‐function mapping for glaucoma: practical constraints on map resolution for clinical and research applications. Invest Ophthalmol Vis Sci 2014; 55: 1985–1993.
- Yoshioka N, Wong E, Kalloniatis et al. Influence of education and diagnostic modes on glaucoma assessment by optometrists. Ophthalmic Physiol Opt 2015; 35: 682–698.
- Zangerl B, Hayen A, Mitchell P et al. Therapeutic endorsement enhances compliance with national glaucoma guidelines in Australian and New Zealand optometrists. Ophthalmic Physiol Opt 2015; 35: 212–224.
- Biousse VR, Newman NJ. Neuro‐ophthalmology Illustrated. New York: Thieme, 2009.
- Reeves AG. Disorders of the Nervous System: a Primer. Chicago, Illinois: Year Book Medical Publishers, 1981; Chapter 3.
- Kennard C, Leigh J. Neuro‐Ophthalmology, Vol 102 (Handbook of Clinical Neurology). Available at: http://ezproxy.library.usyd.edu.au/login?url=http://www.sciencedirect.com/science/handbooks/00729752/129.