
 ?Mathematical formulae have been encoded as MathML and are displayed in this HTML version using MathJax in order to improve their display. Uncheck the box to turn MathJax off. This feature requires Javascript. Click on a formula to zoom.
Abstract
Peripheral image quality influences several aspects of human vision. Apart from off‐axis visual functions, the manipulation of peripheral optical errors is widely used in myopia control interventions. This, together with recent technological advancements enabling the measurement of peripheral errors, has inspired many studies concerning off‐axis optical aberrations. However, direct comparison between these studies is often not straightforward. To enable between‐study comparisons and to summarise the current state of knowledge, this review presents population data analysed using a consistent approach from 16 studies on peripheral ocular optical quality (in total over 2,400 eyes). The presented data include refractive errors and higher order monochromatic aberrations expressed as Zernike co‐efficients (reported in a subset of the studies) over the horizontal visual field. Additionally, modulation transfer functions, describing the monochromatic image quality, are calculated using individual wavefront data from three studies. The analysed data show that optical errors increase with increasing eccentricity as expected from theoretical modelling. Compared to emmetropes, myopes tend to have more hypermetropic relative peripheral refraction over the horizontal field and worse image quality in the near‐periphery of the nasal visual field. The modulation transfer functions depend considerably on pupil shape (for angles larger than 30°) and to some extent, the number of Zernike terms included. Moreover, modulation transfer functions calculated from the average Zernike co‐efficients of a cohort are artificially inflated compared to the average of individual modulation transfer functions from the same cohort. The data collated in this review are important for the design of ocular corrections and the development and assessment of optical eye models.
This review summarises the results of earlier studies on the peripheral optical errors of the human eye. Knowledge of the peripheral optical quality is of importance to several fields within optometry and ophthalmology:Citation2017 development of technical aids with intact or improved perception and mobility; correction of peripheral optical errors to improve vision for various ocular diseases; and manipulation of peripheral image quality to halt progressing myopia.
Many activities in everyday life require sufficient image quality on the peripheral retina. Unlike central vision, designed primarily for resolution tasks, peripheral vision is responsible for various forms of detection. Even though peripheral high‐contrast resolution is limited by the sampling density of the retina, both detection and low‐contrast resolution depend on the quality of the peripheral image.Citation2007 It has been demonstrated that peripheral vision is essential for driving,Citation1999 and several studies have reported that mobility, including the risk of falling, is also highly dependent on vision beyond the fovea.Citation2010 Further, limiting off‐axis vision can affect the performance of search tasks, where well‐controlled saccadic eye movements are required.Citation2012
Knowledge of the peripheral retinal image quality can be useful for the development of optical aids for patients with reduced retinal functionality (for example, due to age‐related macular degeneration), retinitis pigmentosa, and glaucoma. For instance, patients with central visual field loss have shown improved visual performance with optical corrections that enhance the image contrast on the peripheral retina.Citation2018 Treating pseudophakic patients can also be challenging since intra‐ocular lenses, currently available on the market, can decrease peripheral retinal image quality.Citation2013 Thus, explicit knowledge of the peripheral ocular aberrations and image quality may be highly beneficial from a clinical and research perspective.
It has also been suggested that manipulating peripheral image quality might prevent myopia onset or slow down its progression.Citation2015 In recent years the prevalence of myopia has continued to increase and currently affects approximately 30 per cent of the population worldwide.Citation2015 This is of serious concern, because high myopia is a risk factor for severe ocular pathologies (such as myopic macular degenerationCitation2015) and therefore, many research studies have been dedicated to myopia control. Studies in chickens,Citation1988 monkeysCitation1995 and guinea pigsCitation2004 have shown that peripheral image quality has the potential to drive myopia development; but the entire mechanism as yet is not completely understood. Nevertheless, specific peripheral aberration patterns are already implemented in myopia control methods through different types of multifocality. However, all of the available optical treatments (including multifocal soft contact lenses, spectacles that alter peripheral defocus, and orthokeratology) are only partially effective and subject‐dependent.Citation2016 This suggests that peripheral aberrations as well as their effect on the development and progression of myopia need to be further investigated.
Despite the importance of peripheral aberrations, direct access to population data on retinal image quality is limited and the comparison between different studies is often not straightforward. Even though there are guidelines for reporting ocular aberrations,Citation2004 they do allow some freedom for data representation. One of the possible discrepancies between studies is the difference in pupil size and shape (spherical or elliptical) over which peripheral Zernike co‐efficients are calculated. Confusion can also arise from different data types (for instance, J0/Cylinder/C(2,2) for astigmatism), visualisation styles (table/chart/colour map) and the sign convention used to encode the angles of the visual field.
This paper is therefore intended to provide a comprehensive overview of results from previously published studies of peripheral ocular aberrations. An analysis of ocular modulation transfer functions (MTF) is also presented, which is essential to estimate the effect of the optical aberrations on central and peripheral vision. The data presented in this review have potential use in both research and clinical applications, including the design of optical eye models and the development of optical corrections.
Peripheral ocular aberrations data
Peripheral ocular aberrations and their effect on retinal image quality were assessed using data from 16 articles, listed in Table .Citation1974 For three studies, marked with an asterisk, wavefront data for each individual subject were generously shared by the authors.Citation2009 The full list of articles considered for this review is provided in Table S1. The final decision to include an article was governed by the following criteria: (1) available data in multiple eccentricities over the horizontal visual field (VF); (2) wavefront data represented as a set of Zernike co‐efficients; and (3) the number of participants in the study (at least 20).
Table 1. List of studies from which the data were extracted
All processing and analyses presented were conducted using the following guidelines.
If the angular steps in data representations were denser than in the original publication, available data was linearly interpolated.
No additional recalculations for the wavelength were made. Defocus data were unchanged from the original publications, assuming these measurements already compensated for any differences between the measurement wavelength and the visible spectrum wavelengths.
The ocular wavefront measurements are represented as standard Zernike co‐efficients for a 4-mm circular pupil so that comparison between different studies can be made.Citation2017
If the relative peripheral refraction over the horizontal VF was not readily available in the article, it was calculated from Zernike co‐efficients using the following formulas:
If astigmatism was not readily available as the horizontal Jackson cross cylinder (J0), it was calculated using one of the following methods (also see ‘Comments’ column in Table ):
from Zernike co‐efficients:
using Sturm interval (taking half of the dioptric difference between the two line foci assuming J45 = 0);
J0 from cylinder power assuming J45 = 0:
Relative peripheral refraction data were divided into three refractive groups: myopes, emmetropes and hypermetropes. If not specified in the original article, the classification was made using these refractive error intervals: foveal refractive error ≤ −0.50-D for myopes; −0.50-D < foveal refractive error < +0.50 D for emmetropes; and foveal refractive error ≥ +0.50 D for hypermetropes.
The population average optical errors, both in tables and figures, were calculated taking the number of subjects into consideration (that is, weighted average).
The combined effect of ocular aberrations on retinal image quality was assessed by calculating the monochromatic MTFs using all available Zernike co‐efficients for each individual subject from three studies, marked with an asterisk in Table .Citation2009 The average MTF curves presented in this review refer to the average of individual MTFs (not MTFs derived from Zernike co‐efficients averaged across a cohort of individuals). For the off‐axis horizontal VF MTF calculations, the elliptical shape of the pupil was taken into account by scaling the horizontal radius of the pupil by cos(θ), where θ is the angle in the horizontal VF.Citation2013 The MTFs were represented and analysed as 2‐D functions obtained as an average of the original MTF curves over all pupil meridians.
Results
The subject group in this review is the combination of those for the studies listed in Table . Overall, it can be described as follows:
2,492 phakic subjects, both male and female
no reported ocular conditions or surgeries
60 per cent emmetropes, 20 per cent myopes (weighted average spherical equivalent −2.90 ± 1.10 D), and 20 per cent hypermetropes (weighted average spherical equivalent +1.35 ± 0.69 D)
age range five to 58-years
except one study (Bakaraju et al.Citation2016) no pupil dilation, cycloplegia or fogging
ethnicity not reported, but the studies have been conducted in Europe, Northern America and Australia.
The number of subjects and the amount of available data vary among the included studies (refer to the figures captions). Therefore, the sample size for each individual type of analysis may differ from the total number of subjects. For more specific information, refer to the ‘Subjects’ and ‘Used data’ columns of Table .
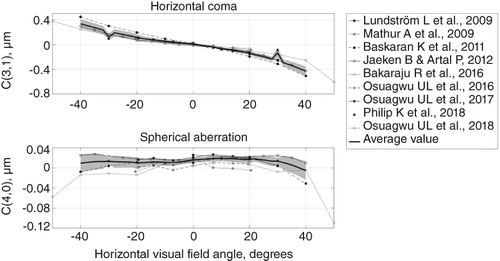
Figures 1 show the population average defocus (relative peripheral refraction), horizontal astigmatism (J0), primary spherical aberration, and horizontal coma across the horizontal VF. The weighted average curves, represented by the thick lines, were calculated for the areas where data from more than one study were available. The shaded areas show ± one standard deviation for regions with data from at least three studies. In Figure 1, relative peripheral refraction is represented separately for emmetropes (top, left), myopes (top, right) and hypermetropes (bottom). Horizontal astigmatism (Figure 2) was not divided into subgroups because there was no correlation between off‐axis astigmatism and central refractive error. Figure 3 represents Zernike co‐efficients for primary horizontal coma (top) and primary spherical aberration (bottom).
Figure 1. Relative peripheral refraction in dioptres for emmetropes (top, left; 1,098 subjects), myopes (top, right; 427 subjects; weighted average spherical equivalent = −3.17 ± 0.98 D) and hypermetropes (bottom; 482 subjects; weighted average spherical equivalent = +1.25 ± 0.49 D). Negative visual angles correspond to the temporal visual field (nasal retina).
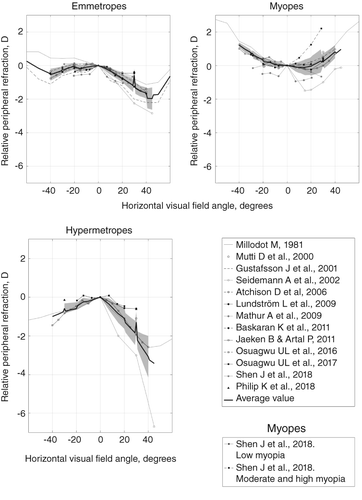
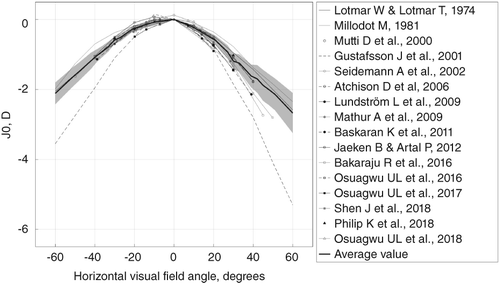
Figure 3. Horizontal coma C(3,1) and primary spherical aberration C(4,0) in μm for all subjects (for a 4-mm pupil diameter). Sample size: 1,045 subjects. Negative visual angles correspond to the temporal visual field (nasal retina).
Population weighted average Zernike co‐efficients for the horizontal VF are listed in Table . The values were obtained using all studies from Table with available wavefront data.Citation2009 Calculations for each angular position were made for a 4-mm pupil diameter using the full extent of available wavefront data, that is all Zernike co‐efficients and all angles reported. However, it is important to mention that all of these studies contained measurements for different angular extents.
Table 2. Population weighted average ± standard deviation of Zernike co‐efficients (in micrometres for a 4-mm circular pupil) over the horizontal visual field (VF) from the studies marked in Table with an asteriskCitation2009
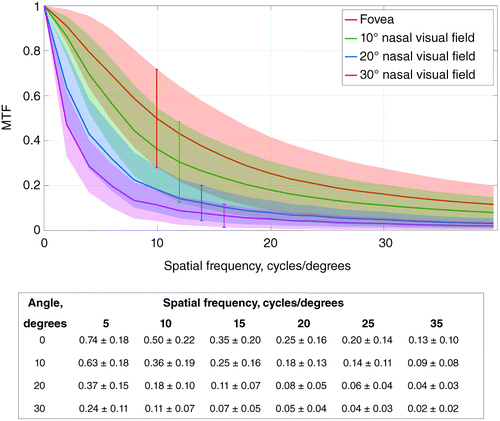
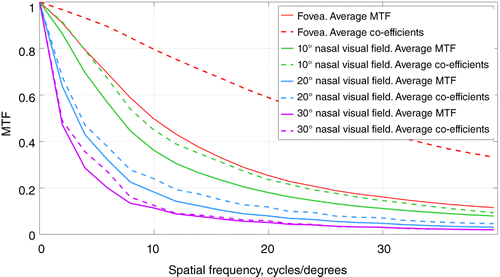
The MTF curves for the emmetropic subjects, obtained using the three studies marked in Table with an asterisk,Citation2009 are plotted in Figure 4 for four angles in the horizontal VF. The calculations were carried out for the following sample sizes: 84 subjects for fovea, 71 subjects for 10°, 84 subjects for 20°, and 74 subjects for 30°. The table below the figure shows the average MTF value ± standard deviation for six different spatial frequencies. As can be seen, the MTF monotonically decreases with the off‐axis angle.
Figure 4. Average modulation transfer function (MTF), calculated from available Zernike co‐efficients,Citation2009 for emmetropes in four angles of the nasal visual field (shown as solid lines). The shaded areas represent the standard deviation at each eccentricity. Sample sizes: 84 subjects for fovea, 71 subjects for 10°, 84 subjects for 20°, and 74 subjects for 30° of the nasal visual field. The table at the bottom shows average ± standard deviation for each curve at spatial frequencies up to 35-cycles/degree.
Discussion
This analysis pools peripheral ocular aberration data from a number of published studies to summarise the current understanding of optics and image quality across the horizontal VF in the human eye. All reviewed studies clearly show an increase in ocular optical errors with increasing off‐axis angle, consistent with optical theory.
Defocus
To be able to compare the peripheral spherical equivalent between different refractive error groups, relative peripheral refraction is often used. The relative peripheral refraction not only depends on the optical aberration field curvature (due to the oblique incidence of light), but also on the ocular shape. Therefore, both hypermetropes and emmetropes on average have a negative relative peripheral refraction (myopic, with the peripheral image in front of the retina), whereas myopes tend to have positive relative peripheral refraction (hypermetropic, with the peripheral image behind the retina) due to the elongated shape of the eye (Figure 1).
Astigmatism
As predicted by Coddington's equations,Citation2003 astigmatism (J0) increases with increasing horizontal off‐axis angle (Figure 2), best described by a quadratic function. Thus, second order polynomials can be fitted to the average curve in the figure (equation [4]; θ in degrees will give J0 in dioptres). This nature of peripheral astigmatism also dictates that the vertical astigmatism is rather small in the horizontal VF (for 20° nasal VF: J0 = [−0.57 ± 0.13] D, J45 = [0.06 ± 0.07] D). With this in mind, Figure 2 illustrates that for the horizontal VF the refractive error in the horizontal (tangential) meridian is noticeably more negative than in the vertical (sagittal) meridian. Thus, for the majority of the horizontal VF, the vertical line focus is located more anterior to the peripheral retina, whereas the horizontal line focus is closer to the retina.
Spherical aberration
Both primary and higher order spherical aberrations are present for on‐axis as well as for the off‐axis object points (Table ). However, for most of the VF primary spherical aberration C(4,0) is dominant. Figure 3 (top) shows that, on average, primary spherical aberration does not change much over the horizontal VF; however, there is some variation throughout the population.
Horizontal coma
Foveal coma is usually small, and horizontal coma is dominant for purely horizontal off‐axis angles. Primary horizontal coma shows a clear increase with increasing eccentricity (Figure 3, bottom) while the standard deviation for the average curve remains relatively low. A linear function can be fitted to the average curve in the figure (θ in degrees will give the horizontal coma in μm for a 4-mm pupil diameter):
Using a third order polynomial would only improve the fitting root‐mean‐square‐error by 0.016 μm (from 0.040 to 0.0249 μm).
Calculation of the ocular MTF
The central and peripheral MTFs in Figure 4 are calculated by averaging curves for all pupil meridians. Because of off‐axis astigmatism across the majority of the horizontal VF, objects with horizontal lines are associated with better image quality than those with vertical lines. Therefore, the calculated MTFs represent the average retinal image quality for a stimulus containing details with all possible orientations. Apart from that, the shape of the ocular MTF itself depends on several parameters as well as the method of calculation.
Effect of number of Zernike terms on MTF
By definition, Zernike series have an infinite number of elements; in practice the decomposition of a wavefront is more limited. Although the residual error is generally small, in some cases it can have a noticeable effect on the shape of the ocular MTF. In particular, accurate individual MTFs require more Zernike terms than population average curves. This can be illustrated by comparing the MTFs (1) for the full available extent of Zernike terms, and (2) for Zernike terms up to the third order and primary spherical aberration. While the average difference between these MTFs is close to zero, in individual cases it can be rather high (standard deviation of difference in MTFs = 0.05 @ 20-cycles/degree, for studies marked with an asterisk in Table , fovea).
Effect of pupil shape on MTF
For large off‐axis angles the elliptical shape of the pupil affects the appearance of the ocular MTF curve. The difference in MTFs calculated using a 4-mm cosine‐scaled elliptical pupil and a circular pupil becomes considerable for eccentricities of 30° and higher (standard deviation of difference in MTFs = 0.05 @ two-cycles/degree, for studies marked with asterisk in Table , 30° horizontal VF).
Effect of averaging methods on MTF
In Figure 5 the average MTF and the MTF from average Zernike co‐efficients are based on different mathematical approaches. The calculation of the average MTF consists of obtaining individual MTF curves calculated separately for each set of Zernike co‐efficients of each subject, and then averaging these MTF curves. In contrast, the MTF from average Zernike co‐efficients implies calculation of only one MTF curve from the set of already‐averaged Zernike co‐efficients. Figure 5 contains MTFs for four VF angles calculated with both described routines using available raw data for emmetropic subjects.Citation2009 For each angle, the MTF from average Zernike co‐efficients shows unrealistically high values. It is also worth noting that this difference is largest in the central VF and gradually decreases towards the periphery. This is because the average peripheral optical errors are large compared to their intrasubject variation.
Figure 5. Average modulation transfer function (MTF) and MTF from average Zernike co‐efficients for four angular positions in the nasal visual field (VF) for the emmetropic cohort with available data.Citation2009 Average MTF is calculated by averaging curves from individual Zernike data sets; MTF from average Zernike co‐efficients is obtained by averaging individual Zernike data sets and subsequent MTF calculation. Sample sizes: 84 subjects for fovea, 71 subjects for 10°, 84 subjects for 20°, and 74 subjects for 30° of the nasal VF.
Retinal image quality and myopia
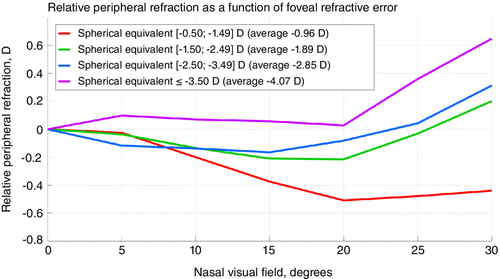
The connection between myopia development and peripheral image quality in the human eye is not straightforward. Hoogerheide et al.Citation1971 once suggested that relative peripheral hypermetropia is a risk factor for myopia development, but this conclusion was made without considering the change in ocular shape with ocular growth.Citation2012 More recent studies show that relative peripheral hypermetropia is most likely a consequence of myopia and not its precursor.Citation2015 That is, relative peripheral refraction depends on the degree of myopia.Citation2006 This is also observed in the available raw data for 62 myopic subjectsCitation2009 (Figure 6). However, substantial differences in relative peripheral refraction for different degrees of myopia start appearing only at rather high eccentricities of the VF (20° and higher). It should further be mentioned that, as suggested earlier, comparison of relative peripheral refraction in the horizontal VF is most representative beyond 40° of eccentricity.Citation2013
Figure 6. Relative peripheral refraction as a function of foveal refractive error across the nasal visual field. The curves are obtained using data from the three studies, marked in Table with an asterisk.Citation2009 Sample sizes: 19 subjects with spherical equivalent (−0.50; −1.49 D), 17 subjects with spherical equivalent (−1.50; −2.49 D), 17 subjects with spherical equivalent (−2.50; −3.49 D), nine subjects with spherical equivalent ≤ −3.50 D.
Nevertheless, many reasonably effective myopia control interventions rely on manipulating the peripheral retinal image quality; the optical treatments with the highest efficacy are orthokeratology and multifocal soft contact lenses.Citation2016 In orthokeratology, a reverse geometry rigid contact lens worn overnight flattens the central cornea, which decreases the overall optical power of the eye. However, this flattening in conjunction with relative steepening of the mid‐peripheral cornea also results in increased off‐axis astigmatism and inverted coma.Citation2009 Currently available multifocal soft contact lens corrections impose a large depth of focus in the periphery.Citation2012
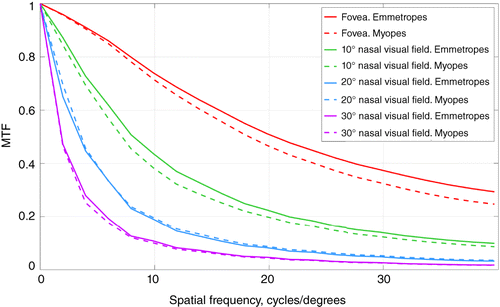
In order to further develop these optical myopia control interventions, it is important to compare peripheral image quality between myopes and emmetropes. Figure 7 shows the average MTFs for emmetropes and myopes with simulated central refractive error correction: foveal defocus and primary astigmatisms were subtracted from every individual set of Zernike co‐efficients (central and peripheral). As can be seen, the average MTF for myopic subjects is generally lower than that of emmetropic subjects over the horizontal VF. However, this difference becomes less prominent with increasing eccentricity and disappears at about 20 ° off‐axis angle. Nonetheless, the results of Figure 7 need to be interpreted with caution, because there were cases with myopic subjects having better image quality than emmetropic ones (standard deviation not shown on the figure).
Figure 7. Average modulation transfer function (MTF) for emmetropes and myopes (with ideal central refractive correction) from the three studies marked in Table with an asteriskCitation2009 for four angular positions in the nasal visual field (0°, 10°, 20°, and 30°). Sample sizes: 84 emmetropes and 72 myopes for fovea; 71 emmetropes and 47 myopes for 10°; 84 emmetropes and 72 myopes for 20°; 74 emmetropes and 62 myopes for 30°. Weighted average spherical equivalent of the whole myopic group −2.41 ± 0.55 D.
Conclusion
This paper summarises the findings of 16 recent publications on the peripheral refractive errors and higher order aberrations in the horizontal VF. The presented data demonstrate an increase in aberrations with off‐axis angle, well predicted by the optical aberrations theory.
Increasing amounts of the peripheral horizontal astigmatism and coma lead to an asymmetric profile of peripheral retinal image quality. Furthermore, the horizontal meridian (vertical line focus) is more myopic than the vertical meridian (horizontal line focus). Comparison between the different refractive groups shows that relative peripheral refraction is positive for myopic subjects while being negative for emmetropic and hypermetropic subjects.
Additionally, with ideal foveal refractive correction, myopes tend to have worse MTFs than emmetropes; this effect is less prominent for high eccentricities. The shape of MTF curve itself depends on the number of Zernike terms used (mostly in the fovea) and the shape of the pupil (at angles ≥ 30°). A considerable difference was also found between the average MTF and the MTF from average Zernike co‐efficients with the latter demonstrating artificially high retinal image quality, especially in the central VF.
Supporting information
Additional supporting information may be found in the online version of this article at the publisher’s website:
Table S1. List of studies on peripheral refraction and higher order aberrations.
tceo_a_12124510_sm0001.docx
Download MS Word (51.1 KB)ACKNOWLEDGEMENTS
The authors would like to gratefully acknowledge Professor David Atchison, Doctor Karthikeyan Baskaran, Professor Pablo Artal, and Doctor Bart Jaeken for providing data essential for this article. This review was supported by the MyFUN project, that receives funding from the European Union's Horizon 2020 Research and Innovation Programme under the Marie Sklodowska‐Curie grant agreement No 675137.
Additional information
Funding
REFERENCES
- Lundström L, Rosén R. Peripheral aberrations. In: Artal P, ed. Handbook of Visual Optics, Vol. I, 1st ed. Boca Raton, FL: CRC Press, 2017. pp. 313–335.
- Lundström L, Manzanera S, Prieto PM et al. Effect of optical correction and remaining aberrations on peripheral resolution acuity in the human eye. Opt Express 2007; 15: 12654–12661.
- Thibos LN, Cheney FE, Walsh DJ. Retinal limits to the detection and resolution of gratings. J Opt Soc Am A 1987; 4: 1524–1529.
- Thibos LN, Still DL, Bradley A. Characterization of spatial aliasing and contrast sensitivity in peripheral vision. Vision Res 1996; 36: 249–258.
- Williams DR, Coletta NJ. Cone spacing and the visual resolution limit. J Opt Soc Am A 1987; 4: 1514–1523.
- Wang YZ, Thibos LN, Bradley A. Effects of refractive error on detection acuity and resolution acuity in peripheral vision. Invest Ophthalmol Vis Sci 1997; 38: 2134–2143.
- Rosén R, Lundström L, Unsbo P. Influence of optical defocus on peripheral vision. Invest Ophthalmol Vis Sci 2011; 52: 318–323.
- Venkataraman AP, Papadogiannis P, Romashchenko D et al. Peripheral resolution and contrast sensitivity: effects of monochromatic and chromatic aberrations. J Opt Soc Am A 2019; 36: B52–B57.
- Owsley C, Mcgwin G. Vision impairment and driving. Surv Ophthalmol 1999; 43: 535–550.
- Wetton MA, Horswill MS, Hatherly C et al. The development and validation of two complementary measures of drivers' hazard perception ability. Accid Anal Prev 2010; 42: 1232–1239.
- Wood JM, Troutbeck R. Effect of restriction of the binocular visual field on driving performance. Ophthalmic Physiol Opt 1992; 12: 291–298.
- Patino CM, Mckean‐cowdin R, Azen SP et al. Central and peripheral visual impairment and the risk of falls and falls with injury. Ophthalmology 2010; 117: 199–206.e1.
- Berencsi A, Ishihara M, Imanaka K. The functional role of central and peripheral vision in the control of posture. Hum Mov Sci 2005; 24: 689–709.
- Dakin S, Fiser J, Pasquale LR et al. Effects of peripheral visual field loss on eye movements during visual search. Front Psychol 2012; 3: 1–13.
- Lewis P, Venkataraman AP, Lundström L. Contrast sensitivity in eyes with central scotoma. Optom Vis Sci 2018; 95: 354–361.
- Baskaran K, Rosén R, Lewis P et al. Benefit of adaptive optics aberration correction at preferred retinal locus. Optom Vis Sci 2012; 89: 1417–1423.
- Lundström L, Gustafsson J, Unsbo P. Vision evaluation of eccentric refractive correction. Optom Vis Sci 2007; 84: 1046–1052.
- Jaeken B, Mirabet S, Marín JM et al. Comparison of the optical image quality in the periphery of phakic and pseudophakic eyes. Invest Ophthalmol Vis Sci 2013; 54: 3594–3599.
- Holden BA, Mariotti SP, Kocur I et al. Impact of increasing prevalence of myopia and high myopia. In: Holden BA, ed. Report of the Joint World Health Organization ‐ Brien Holden Vision Institute Global Scientific Meeting on Myopia. Sydney: University of New South Wales, 2015.
- Flitcroft DI. The complex interactions of retinal, optical and environmental factors in myopia aetiology. Prog Retin Eye Res 2012; 31: 622–660.
- Holden B, Sankaridurg P, Smith E et al. Myopia, an underrated global challenge to vision: where the current data takes us on myopia control. Eye 2014; 28: 142–146.
- Goldschmidt E, Jacobsen N. Genetic and environmental effects on myopia development and progression. Eye 2014; 28: 126–133.
- Wallman J, Winawer J. Homeostasis of eye growth and the question of myopia. Neuron 2004; 43: 447–468.
- Williams KM, Bertelsen G, Cumberland P et al. Increasing prevalence of myopia in Europe and the impact of education. Ophthalmology 2015; 122: 1489–1497.
- Verkicharla PK, Ohno‐matsui K, Saw SM. Current and predicted demographics of high myopia and an update of its associated pathological changes. Ophthalmic Physiol Opt 2015; 35: 465–475.
- Schaeffel F, Glasser A, Howland HC. Accommodation, refractive error and eye growth in chickens. Vision Res 1988; 28: 639–657.
- Irving EL, Sivak JG, Callender MG. Refractive plasticity of the developing chick eye: a summary and update. Ophthalmic Physiol Opt 2015; 35: 600–606.
- Hung L‐F, Crawford MLJ, Smith EL. Spectacle lenses alter eye growth and the refractive status of young monkeys. Nat Med 1995; 1: 761–765.
- Smith EL 3rd, Kee C‐S, Ramamirtham R et al. Peripheral vision can influence eye growth and refractive development in infant monkeys. Invest Ophthalmol Vis Sci 2005; 46: 3965–3972.
- Benavente‐pérez A, Nour A, Troilo D. Axial eye growth and refractive error development can be modified by exposing the peripheral retina to relative myopic or hyperopic defocus. Invest Ophthalmol Vis Sci 2014; 55: 6765–6773.
- Whatham AR, Judge SJ. Compensatory changes in eye growth and refraction induced by daily wear of soft contact lenses in young marmosets. Vision Res 2001; 41: 267–273.
- Mcfadden SA, Howlett MHC, Mertz JR. Retinoic acid signals the direction of ocular elongation in the Guinea pig eye. Vision Res 2004; 44: 643–653.
- Huang J, Wen D, Wang Q et al. Efficacy comparison of 16 interventions for myopia control in children: a network meta‐analysis. Ophthalmology 2016; 123: 697–708.
- Smith EL III, Campbell MCW, Irving E. Does peripheral retinal input explain the promising myopia control effects of corneal reshaping therapy (CRT or ortho‐K) & multifocal soft contact lenses? Ophthalmic Physiol Opt 2013; 33: 379–384.
- American National Standard for Ophthalmics: Methods for Reporting Optical Aberrations of Eyes; ANSI Z80.28–2004. Merrifield, VA: Optical Laboratory Association, 2004.
- Ophthalmic Optics and Instruments – Reporting Aberrations of the Human Eye, ISO 24157:2008, 1st ed. Case postale 56 CH‐1211 Geneva 20: International Organization for Standardization, 2008.
- Thibos L, Applegate RA, Schwiegerling JT et al. Standards for reporting the optical aberrations of eyes. J Refract Surg 2002; 18: S652–S660.
- Lotmar W, Lotmar T. Peripheral astigmatism in the human eye: experimental data and theoretical model predictions. J Opt Soc Am 1974; 64: 510–513.
- Millodot M. Effect of ametropia on peripheral refraction. Am J Optom Physiol Opt 1981; 58: 691–695.
- Mutti DO, Sholtz RI, Friedman NE et al. Peripheral refraction and ocular shape in children. Invest Ophthalmol Vis Sci 2000; 41: 1022–1030.
- Gustafsson J, Terenius E, Buchheister J et al. Peripheral astigmatism in emmetropic eyes. Ophthalmic Physiol Opt 2001; 21: 393–400.
- Seidemann A, Schaeffel F, Guirao A et al. Peripheral refractive errors in myopic, emmetropic, and hyperopic young subjects. J Opt Soc Am A 2002; 19: 2363–2373.
- Atchison DA, Pritchard N, Schmid KL. Peripheral refraction along the horizontal and vertical visual fields in myopia. Optom Vis Sci 2006; 46: 1450–1458.
- Shen J, Spors F, Egan D et al. Peripheral refraction and image blur in four meridians in emmetropes and myopes. Clin Ophthalmol 2018; 12: 345–358.
- Lundström L, Gustafsson J, Unsbo P. Population distribution of wavefront aberrations in the peripheral human eye. J Opt Soc Am A 2009; 26: 2192–2198.
- Mathur A, Atchison DA, Charman WN. Myopia and peripheral ocular aberrations. J Vis 2009; 9: 1–12.
- Baskaran K, Unsbo P, Gustafsson J. Influence of age on peripheral ocular aberrations. Optom Vis Sci 2011; 88: 1088–1098.
- Jaeken B, Artal P. Optical quality of emmetropic and myopic eyes in the periphery measured with high‐angular resolution. Invest Ophthalmol Vis Sci 2012; 53: 3405–3413.
- Osuagwu UL, Suheimat M, Atchison DA. Mirror symmetry of peripheralmonochromatic aberrations in fellow eyes of isomyopes and anisomyopes. Invest Ophthalmol Vis Sci 2016; 57: 3422–3428.
- Osuagwu UL, Suheimat M, Atchison DA. Peripheral aberrations in adult hyperopes, emmetropes and myopes. Ophthalmic Physiol Opt 2017; 37: 151–159.
- Philip K, Sankaridurg PR, Ale JB et al. Profile of off‐axis higher order aberrations and its variation with time among various refractive error groups. Vision Res 2018; 153: 111–123.
- Osuagwu UL, Verkicharla P, Suheimat M et al. Peripheral monochromatic aberrations in young adult Caucasian and East Asian eyes. Optom Vis Sci 2018; 95: 234–238.
- Bakaraju RC, Fedtke C, Ehrmann K et al. Peripheral refraction and higher‐order aberrations with cycloplegia and fogging lenses using the BHVI‐EyeMapper. J Optom 2016; 9: 5–12.
- Mathur A, Gehrmann J, Atchison DA. Pupil shape as viewed along the horizontal visual field. J Vis 2013; 13: 1–8.
- Freeman MH, Hull CC. Optics, 11th ed. Oxford: Butterworth‐Heinemann, 2003. pp. 250–251.
- Hoogerheide J, Rempt F, Hoogenboom WP. Acquired myopia in young pilots. Ophthalmologica 1971; 163: 209–215.
- Rosén R, Lundström L, Unsbo P et al. Have we misinterpreted the study of Hoogerheide et al. (1971)? Optom Vis Sci 2012; 89: 1235–1237.
- Atchison DA, Li SM, Li H et al. Relative peripheral hyperopia does not predict development and progression of myopia in children. Invest Ophthalmol Vis Sci 2015; 56: 6162–6170.
- Mutti DO, Sinnott LT, Mitchell GL et al. Relative peripheral refractive error and the risk of onset and progression of myopia in children. Invest Ophthalmol Vis Sci 2011; 52: 199–205.
- Mathur A, Atchison DA. Peripheral refraction patterns out to large field angles. Optom Vis Sci 2013; 90: 140–147.
- Mathur A, Atchison D. Effect of orthokeratology on peripheral aberrations of the eye. Optom Vis Sci 2009; 86: E476–E484.
- Gonzalez‐meijome JM, Faria‐ribeiro MA, Lopes‐ferreira DP et al. Changes in peripheral refractive profile after orthokeratology for different degrees of myopia. Curr Eye Res 2016; 41: 199–207.
- Rosén R, Jaeken B, Lindskoog‐pettersson A et al. Evaluating the peripheral optical effect of multifocal contact lenses. Ophthalmic Physiol Opt 2012; 32: 527–534.
- Ji Q, Yoo Y‐S, Alam H et al. Through‐focus optical characteristics of monofocal and bifocal soft contact lenses across the peripheral visual field. Ophthalmic Physiol Opt 2018; 38: 326–336.