
Abstract
Background
Comprehensive vision screening programmes for children are an important part of public health strategy, but do not exist in many countries, including Tonga. This project set out to assess: (1) the functional vision of children attending primary schools in Tonga and (2) how a new recognition acuity test (The Auckland Optotypes displayed on a tablet computer) compares to use of a standardised eye chart in this setting.
Methods
Children from three Tongan primary schools were invited to participate. Acuity testing was conducted using a standardised recognition acuity chart (Lea symbols) and the tablet test displaying two formats of The Auckland Optotypes. Measures of ocular alignment, stereo acuity and non‐cycloplegic photorefraction were also taken.
Results
Parents of 249 children consented to participate. One child was untestable. Only 2.8 per cent of testable children achieved visual acuity worse than 0.3-logMAR in the weaker eye. Results from the Spot Photoscreener suggested that no children had myopia or hyperopia, but that some children had astigmatism. The tablet test was practical in a community setting, and showed ±0.2 logMAR limits of agreement with the Lea symbols chart.
Conclusion
The sample of children in Tongan primary schools had good functional vision. A modified version of the tablet acuity test is a promising option for vision screening in this context.
Population‐wide paediatric vision screening is a health promotion strategy that assesses vision in children and refers for further evaluation as required.Citation2013 Screening has two benefits. The first is to improve quality of life (notably by highlighting treatable bilateral vision impairment).Citation2008 The second is early detection of risk factors for amblyopia. Although much work suggests population‐wide vision screening improves visual outcomesCitation2015 and is cost effective,Citation2009 prioritisation of vision screening has been questioned.Citation2013 Many countries have heterogeneous programmes managed at the state level, or no screening at all.Citation2015 The Kingdom of Tonga, an archipelago in the Southern Pacific with a population of around 100,000 people, does not currently conduct systematic paediatric vision screening. For countries like Tonga, interested in promoting excellent childhood visual outcomes, the choice of strategy can be daunting. Decisions include what conditions to target,Citation2013 which test is most effective at highlighting children who would benefit from a referral,Citation2015 and how to manage and fund referral, treatment and follow‐up.
Refractive error is a common and correctable condition, and is a primary target of vision screening for school‐aged children. The prevalence of refractive error varies considerably between countries; 90 per cent of children in some developed parts of East Asia are myopic by the time they finish high schoolCitation2018 compared to 25 per cent globally.Citation2016 The prevalence of myopia is lower in primary school‐aged children (approximately 40 per cent in developed parts of East AsiaCitation2018 and 15 per cent globallyCitation2016). Epidemiological vision research within Tonga is scant, and has focused on adults.Citation1994 Knowledge about the eye health of children in the Pacific Islands is limited to a single report of school screening in Timor‐LesteCitation2011 and some early research on refractive error in Melanesia.Citation1985 If Tonga is similar to these Pacific Island nations, then one would expect Tongan children to have lower rates of myopia than the global average.Citation2011
Guidelines for screening tests at various ages exist, and cover chart‐based and electronic recognition acuity tests through to auto‐refraction and photo‐screening.Citation2013 Newer technologies offer several advantages over traditional methods. First, many electronic tests can be run on the user's own equipment (for example the Jaeb Visual Acuity ScreenerCitation2015 can be run on any Microsoft Windows device), and can present targets (‘optotypes’) which are open‐access (freely available, for example the standard Sloan lettersCitation2015 or The Auckland Optotypes [TAO]Citation2018). Second, automation of the testing procedure can reduce scoring and recording errors, streamline data storage, promote referral and facilitate follow‐up.
Any system to identify children with vision impairment does not help the community unless it is supported by appropriate clinical services. In Tonga, infrastructure and human resources for eye care have been limited.Citation2007 In a 2005 audit of spectacle dispensing in Pacific Island countries, Tonga was the only country without a permanent public spectacle dispensing system, a gap being filled with recycled glasses.Citation2008 As recycled glasses can be problematic,Citation2008 The Fred Hollows Foundation New Zealand, Volunteer Ophthalmic Services Overseas New Zealand and other groups have assisted with provision of custom and ready‐made spectacles, but no permanent local solutions are in place. At the time of the screening, the central hospital (Vaiola, serving the Tongatapu Group) had an eye clinic with three eye‐care practitioners. Registered nurses trained in basic eye care supported the eye‐care practitioners, of which there were two serving in the Tongatapu Group, one in the Vava'u Group, and one in the Ha'apai Group. There was also one private optometrist in Tongatapu. The Fred Hollows Foundation New Zealand has an ongoing investment in capacity building, including developing human resources. Despite these efforts, local resources have been insufficient to serve the population, leaving Tonga reliant on several outreach teams to fill unmet needs,Citation2007 a common occurrence in the Pacific.Citation2002 Encouragingly, in the time since the project finished, Vaiola hospital has appointed an ophthalmologist.
Without estimates of the prevalence of vision problems in Tongan children, the level of required support, infrastructure and the best screening strategy remain unclear. A small‐scale cross‐sectional description of the visual status of schoolchildren in Tonga, therefore, serves two aims. (1) To assess vision of primary school‐aged children in Tonga in terms of recognition acuity, augmented by an estimate of refractive error using a photoscreener. (2) To compare a new recognition acuity test (using open‐access shapes displayed on a tablet) to use of a standardised paper chart in this setting.
Methods
Study design
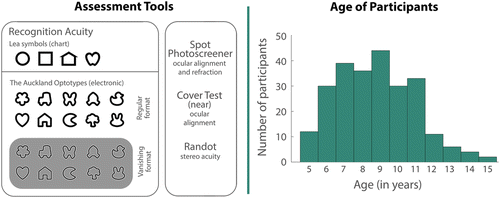
To address aim one, a cross‐sectional observation study, using a standard visual acuity test (crowded Lea chart) to describe functional vision, was implemented with a sample of children in Tonga. Acuity measures were accompanied by measures of non‐cycloplegic photorefraction, ocular alignment and stereo acuity. To address aim two, the agreement between the Lea chart and a new electronic acuity test was measured. The new test presented TAOCitation2018 on a tablet computer with automated test progression, termination and scoring.Citation2018 The outcome measure was 95% limits of agreement (LoA) between tests from Bland–Altman plots.Citation1986 This aim was augmented with an analysis of the effect of the number of trials on agreement, and by exploring whether children exhibit a bias toward some shapes over others. The assessment tools used for both aims are presented in Figure 1 (left) and described in more detail below.
Study context and setting
Visual testing was embedded within a holistic health survey in Tonga (run by author FL) that also included measurements of anthropometry, ear health, oral health and questionnaires. The protocol for this broader study was established through the Delphi process with a diverse but primarily Tongan panel (including paediatricians, academics, teachers and parents). As part of this process, inclusion of vision testing reached 93 per cent consensus.Citation2017 A goal of the broader health survey was to promote the benefits of electronic testing, which fit well with the second aim of this project (to compare charts with electronic vision tests). Collaboration with Tongan stakeholders commenced in 2013, culminating in data collection in 2015,Citation2017 and follow‐up summary reported in 2017.
Participants
The sample cohort was recruited from three primary schools in the urban capital of Tonga, Nuku'alofa. The study complied with the tenets of the Declaration of Helsinki. Ethics approval was granted by the University of Auckland Human Participants Ethics Committee and the Tonga National Health Ethics and Research Committee. Parents of 249 children provided written informed consent for their child to be included in the study. Ages ranged from five to 15-years (distribution presented in Figure 1, right), 58 per cent female. Most (85 per cent) of the children were born in Tonga, and 91 per cent spoke Tongan in their homes.
Use of standard clinical measures
The study protocol consisted of a standardised measure of visual acuity (Lea symbolsCitation1980 on a paper chart), photorefraction (Welch Allyn Spot Photoscreener), ocular alignment (unilateral cover test at near), and stereo acuity (Randot preschool). Test procedures followed published guidelines.Citation2015 Our use of the Welch Allyn Spot Photoscreener followed guidelines given in the accompanying manual. Reporting (and referral) cut‐offs for recognition acuity are diverse.Citation2015 Referral cut‐offs are typically > 0.2 logMAR (logarithm of the minimum angle of resolution) or > 0.3 logMAR in either eye. By contrast, the International Classification of Diseases (ICD)‐10 only classifies moderate impairment as beyond ~0.5 logMAR, and severe impairment as beyond 1.0 logMAR (http://apps.who.int/classifications/icd10/browse/2015/en#/H54). Data here are reported at poorer than 0.3 logMAR, 0.5 logMAR and 1.0 logMAR and referrals were made for children having habitual visual acuity worse than 0.3 logMAR, to balance benefits of referrals with the limited eye‐care resources available in Tonga. Standard refractive error thresholds for screening were used for reporting and referral (astigmatism > 1.50 D, hyperopia > 3.50 D, anisometropia > 1.50 D, myopia < −1.50 D),Citation2013 as well as device‐specific adjusted refractive cut‐offs recently recommended (astigmatism > 1.25 D, hyperopia > 2.375 D, anisometropia > 1.125 D, myopia < −2.00 D).Citation2016
Decisions about who to refer were made in consultation with the local paediatrician (author TF), and with optometrists in New Zealand (authors NA and JB) based on all available data. As part of the larger study, a referral process was initiated whereby referrals were given to parents, the paediatrician (author TF), and the eye‐health nurse (author MV) for follow‐up. The broader study was not designed to include intervention, so only natural follow‐up patterns for those who were referred to the local health system are reported (follow‐up data were summarised by author MV two years after data collection).
Acuity testing
The Lea symbols chart contained eight lines, with five symbols at each acuity level, displayed at three metres. Displayed acuity levels ranged from 0.7 (largest) to −0.1 (smallest) logMAR. Testing started at 0.3 logMAR, then increased or decreased difficulty based on response, and the test was terminated when a child was incorrect on three of five optotypes on a line. Scoring was calculated based on all optotypes correctly identified. The tablet test protocol was based on a psychophysical adaptive staircase (QUEST),Citation1983 programmed in Matlab (http://www.mathworks.com) running Psychtoolbox extensions (http://psychtoolbox.org Citation1997). The prior or expected threshold was set to 0.3 logMAR, with a standard deviation of 0.3 logMAR. Lapse rate was estimated to be one per cent and guessing rate to be 10 per cent (to reflect the 10 alternatives possible). Ten trials were completed per staircase.
The test was run on a Microsoft Surface Pro 3 tablet computer fitted with an anti‐glare screen cover. The screen (2,160 × 1,440 pixels, subtending a visual angle of 9.6° by 6.5°) was gamma corrected (white, ~300-cd/m2, black 1-cd/m2 and grey 150-cd/m2) in the software. Testing was conducted at a 1.5-m viewing distance, based on recommendations for screening preschool children.Citation2015 For each acuity test, participants needed to be able to name or match shapes in order to be classified as ‘testable’. The right eye was always tested first, followed by the left eye.
Optotypes
The electronic comparison test displayed TAOCitation2018 an open‐access picture optotype set. TAO symbols were designed to be balanced in the sense that each item elicits a similar visual acuity threshold to the other items.Citation2018 They have been shown to produce accurate measures of recognition acuity in children in a parallel study in New Zealand.Citation2018 The researcher collecting data (author LH) was trained on Tongan names for each shape (within both TAO and Lea sets). TAO symbols were tested in regular (black stroke on white background ‐ crowded) and vanishing (uncrowded split black and white stroke on grey background) formats.Citation2018 Vanishing optotypes are known to provide a more reliable measure of acuity in adultsCitation2011 because they attenuate low spatial frequency information which can be used to guess the identity of a target.Citation2011
Analysis
The designation of the ‘weaker’ eye was based on scores from the Lea chart. If eyes had the same visual acuity, the ‘weaker’ eye was designated as the right eye. For the electronic acuity test, raw QUEST data were fit with a psychometric function to determine the threshold (smallest legible symbol size). The acuity range was set from −0.1 to 1.5 logMAR and slope from 3.3 to 50. Lapse and guess rates remained at one per cent and 10 per cent respectively. The PAL_PFL_FitCitation2018 function was used to estimated threshold and slope from the fit of a cumulative normal distribution. Agreement between both regular and vanishing TAO tablet tests and Lea chart was evaluated in reference to the goal of 95 per cent LoA within ±0.2 logMAR, the test–retest agreement of the gold standard test for research studies in children.Citation2003
Results
Standardised screening outcomes
One child was untestable using Lea symbols. Acuity data from the remaining children are summarised in Table based on the referral criteria (> 0.3 logMAR) and ICD‐10 criteria (moderate > 0.5 logMAR and severe > 1.0 logMAR), and Figure 2A shows acuity results by age. No children met the ICD‐10 definition for bilateral moderate or severe vision impairment, and only two met the ICD‐10 criteria for moderate unilateral vision impairment. Seven children had reduced vision sufficient for referral.
Table 1. Acuity for worse eye and better eye using standard acuity test (Lea symbols)
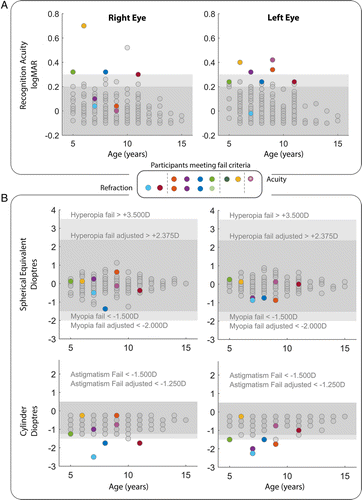
Three of these children showed amblyopic risk factors due to their interocular acuity difference (identified by asterisks on Figure 2A). For 33 of the 249 children, the Spot Photoscreener was unable to provide a result. None of these 33 children had worse than 0.3 logMAR visual acuity. Figure 2B summarises the refraction results by age. No children failed the screening based on suspected hyperopia or myopia regardless of criterion used; however, six children were identified with suspected astigmatism. For the seven children with acuity loss worse than 0.3 logMAR, four met the refractive criterion for astigmatism. No children had more than 1.50 D interocular difference in sphere or cylinder. No children had manifest near strabismus based on the unilateral cover test or the Spot Photoscreener result. Eighty per cent of children could see the stereo acuity targets equal to or better than 60-seconds of arc disparity. Twelve children could not see disparity cues of 800-seconds of arc. One of these children had bilateral recognition acuity impairment, and two had mild unilateral impairment and astigmatism.
Tablet acuity test results
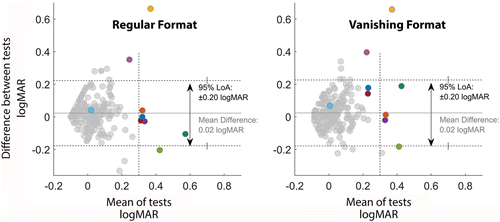
Figure 3 shows the Bland–Altman plots comparing Lea symbols and the regular and vanishing formats of the TAO tablet test for the weaker eye. The agreement (measured by LoA) between standard visual acuity screening and the tablet visual acuity screening were ±0.2 logMAR (two lines) for each. Two participants, represented by yellow and pink symbols, had normal non‐cycloplegic refractive results based on the Spot Photoscreener, but failed the Lea test. Both of these children had normal acuity results on both regular and vanishing TAO optotype tests.
To understand the impact of the number of trials, the LoA was recalculated based on the results from a truncated staircase. Each data point in Figure 4A represents theoretic LoA with Lea (the example for 10 trials is shown in the insets). From the calculated knee point of the exponential fit (solid line), it appears that after seven trials, additional trials yield diminishing returns (in terms of agreement with the Lea chart).
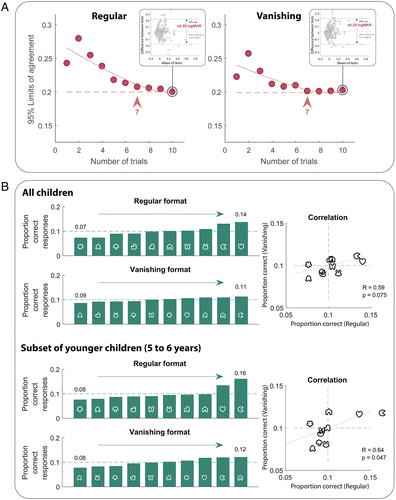
If each optotype was matched to the rest of the shapes within a set (in terms of both legibility and child preference) one could expect a 0.1 probability of correct response for each shape. For the regular format of the optotypes, the probability of correctly reporting a shape ranged from 0.07 to 0.14. The vanishing formats of the optotypes elicited a narrower range of probabilities. This suggests that the children found some of the regular variants easier (in this case ) and others more difficult (in this case and ), rather than having a bias toward answering some shapes over others (such a preference would likely impact both formats). However, if only data from younger children (5–6-years) are evaluated, the range increases, and the correlation between regular and vanishing formats becomes significant. This suggests younger children showed a preference toward certain shapes over others. In particular, the and were reported more frequently in these younger children (Figure 4B).
Follow‐up
The clinical team reviewed all cases. Referrals were based primarily on defined Lea acuity and photoscreener cut‐offs. Stereo acuity and ocular alignment results were reviewed in participants with borderline acuity and/or refractive findings. Nine children were referred to the local eye clinic, each from a different family. One was untestable, two had suspected astigmatism but acceptable acuity, four had reduced visual acuity and suspected astigmatism, and one had visual acuity loss but non‐cycloplegic photoscreener results below the referral criteria. Two children had reduced acuity on the Lea symbols chart, but normal TAO acuity and photoscreener results. We referred the participant for whom the mean acuity result was worse than 0.3 logMAR (yellow) and stereo acuity was unmeasurable, but not the child for whom mean acuity was better than 0.3 logMAR and stereo acuity was 40-seconds of arc (pink).
As part of the larger study, a referral process was instigated through Vaiola Hospital to facilitate better flow of children needing care to the appropriate facilities. For the vision screening component presented here, one family informed the researchers that they organised spectacle correction for their child independently, two families followed up with the eye clinic in Nuku'alofa, and the remaining six families did not attend the local health clinic for follow‐up. The families who attended the local clinic were encouraged to return when a visiting team of volunteers arrived, but neither did. Note that the local ophthalmologist was appointed after completion of the study. For the families who did not attend the local clinic, some may have arranged care independently, some may have decided not to follow‐up and others may have been unable to.
Although the referral process was an improvement on the first‐come first‐served system, more active follow‐up would be required in order to better understand long‐term outcomes, and barriers to accessing eye care.
Discussion
Lea chart acuity and photoscreener outcomes
Most children who participated in the study had normal functional vision according to the Lea test. No children met the ICD‐10 definition for bilateral vision impairment, and only three met the criteria for having an amblyogenic risk factor. Only 2.8 per cent of children had habitual vision worse than 0.3 logMAR in their weaker eye, most due to suspected astigmatism. No children failed the screening due to suspected hyperopia or myopia.
Comparison of these results to epidemiological work is challenging given: (1) the small sample; (2) the use of the non‐cycloplegic Spot Photoscreener as an estimate of refraction; and (3) the difference between cut‐offs used in epidemiological workCitation2018 compared to that used for clinical referral.Citation2016 With these caveats in mind, the refraction data suggest that Tongan school children experience lower levels of myopia than children from developed parts of South East Asia,Citation2016 with our results being more in line with the rates of myopia reported in other Pacific Islands.Citation1985 Increased time outdoors and decreased emphasis on education have been associated with decreased prevalence of myopia.Citation2018 Increased outdoor time was recently found to be preventative in a clinical trial in China,Citation2015 and there has been some advocacy encouraging children to go outside to counteract myopia.Citation2016 In the current project, each participating school had natural light in classrooms, excellent outdoor spaces and promoted a culture of outdoor activity. Although these observations fit with the literature, the small cross‐sectional study presented here cannot speak to causality.
While the data suggested low rates of myopia, there appeared to be higher levels of mild astigmatism compared to international norms.Citation2018 It has been reported that astigmatism is associated with keratoconus, and that Pacific students in New Zealand high schools have higher rates of keratoconus than their European peers.Citation2007 Again, although these findings may be related, the present study design precludes comment on whether the higher prevalence of mild astigmatism seen in this sample of Tongan children is associated with a higher incidence of keratoconus later in life.
Efficacy of new recognition acuity test
The agreement between the Lea chart and the TAO tablet tests are similar to test–retest reliability for the research standard for children,Citation2003 and this level of agreement could be achieved in fewer than 10 trials. As is the case for all agreement metrics with a subjective gold standard, inaccurate Lea test results would manifest as poor agreement. Figures 2 and 3 suggest this may have occurred in the present study; the participants represented by yellow and pink achieved excellent results on both TAO tests, but poor Lea results. Such a large gap between acuity results is more likely due to lapses on the test with the poor result (due to inattention or disengagement) than lucky guesses on the tests with the better result (particularly for an optotype set with 10 alternatives). Although these children did not have full eye examinations, the Spot Photoscreener reported emmetropia, again suggesting the TAO results better reflected true acuity thresholds. It is possible that visual acuity at 1.5-metres could impede the detection of low myopia up to approximately −0.75 D. However, this did not appear to be the case; among participants with ≤ −0.75 D spherical equivalent in the worse eye, an equal number of participants performed poorer on the Lea chart (three metres) and TAO regular and vanishing optotype tablet test (1.5-metres).
Although agreement with the Lea chart was acceptable, this project provided the opportunity to consider modifications to improve acuity threshold estimation. For example, some children answered incorrectly on the first trial of a TAO staircase despite correctly identifying subsequent, smaller symbols. Some of these early lapses prevented the short staircase from converging, resulting in unreliable threshold estimation. Implementation of a formal assessment of testability, as a short pre‐test, could reduce early lapses. Similarly, increasing the staircase procedure's initial guess for threshold (the ‘prior’) would likely limit the impact of early lapses. Incorporating a ‘refresh’ option to show a child a second presentation at the same stimulus level could also reduce the instance of such lapses. Indeed, in a parallel study in New Zealand, these modifications were implemented in the tablet tests and resulted in agreement as good as ±0.14 logMAR.Citation2018
The tablet allowed automated selection of stimulus level, termination criteria, and both scoring and recording of results, a practical advantage that freed the examiner to engage with the child. If the testing device could be integrated with the health‐care system, automation could also help with referral and follow‐up. Given their advantages, electronic acuity tests are being used more in community settings,Citation2015 and are increasingly recommended for a variety of applications including visual acuity measurementsCitation2003 and screening.Citation2015 Disadvantages of such devices include the need for electricity and for specific testing environments to appropriately position the tablet, and reduce glare on the screen.
The optotypes used (TAO) were easily identifiable by the children, confirming appropriateness of TAO for this age and culture. However, there was a trend in younger children (5–6-years old) toward choosing particular shapes ( and ) for their answer. An assessment of bias in preschool children could establish whether such preferences are exaggerated in even younger children.
The agreement of regular and vanishing optotypes with Lea symbols was identical. However, the analysis of trial number suggested that the vanishing format would theoretically allow the same agreement based on fewer trials. This is in line with the previous finding that vanishing optotypes elicit more reliable responses.Citation2011 This subtle advantage may have been enhanced had power supply been more reliable. When power was disrupted, vanishing optotypes were not sufficiently balanced to disappear on the grey background, leaving low spatial frequency cues to target identity. These cues theoretically allow observers to use hyper‐acuity, rather than stroke width, to correctly identify optotypes. In this respect vanishing optotypes carry a specific disadvantage in settings where display linearity cannot be guaranteed. In this study, precautions were taken to: (1) confirm physical connection to a power supply; and (2) automatically adjust screen brightness to compensate for unexpected power cuts. However, these measures proved insufficient to guarantee perceptual vanishing under all circumstances and future work would need to strengthen such precautions in order for the benefits of vanishing optotypes to be fully realised in remote community settings.
Considerations for population‐wide childhood screening
The relative benefits and risks of population‐wide preschool vision screening have been reviewed, and screening recommended.Citation2015 However, the benefits that vision screening imparts are dependent on early detection of vision disorders leading to early treatment. In Tonga, there is not yet an adequate system for referral or provision of glasses.
Additional infrastructure would be required for appropriate referral, treatment and follow‐up before a vision screening programme would benefit the community. A recent study investigated the qualitative impact of providing free glasses at school.Citation2016 The authors report that providing the glasses in school (as opposed to clinics) increases access to, and use of, spectacles, and that use of glasses improved performance in school and psychosocial wellbeing.Citation2016 School‐based provision of health care in general is a promising strategy,Citation2018 and pairing vision screening with other health domains could reduce human resources required for testing, referrals and follow‐up.
A sustainable system for providing and funding glasses is also required. Recycled glasses are not ideal; appropriate recycled glasses were not available for any of the vision problems detected as part of the current study. Even if they had been, recycled glasses may compromise quality and compliance, and increase reliance on external sources of support.Citation2014 Ready‐made glasses have been proposed as a cost‐effective alternative.Citation2014 Even for cases of mild anisometropia and astigmatism, ready‐made glasses were shown in a clinical trial to improve visual function and quality of life only slightly less than made‐to‐order spectacles, and showed similar levels of patient satisfaction.Citation2012 Encouragingly, the need for glasses in our study was not substantial, hopefully keeping this aspect of costs more manageable. This gap could potentially be filled by continued volunteer donation of custom‐ or ready‐made glasses, as long as the system of provision was integrated and sustainable.
Low rates of vision impairment perhaps raise the question of how much infrastructure ought to be devoted to large‐scale vision screening.Citation2013 However, it is possible that our sample was not representative. Although most children in Tonga are expected to enrol in primary school (http://tonga.prism.spc.int/component/advlisting/?view=download&fileId=1808), children may be less likely to attend school if they have poor vision. Children may also have been less likely to participate in the study if they had a known vision problem (no children who participated in this study had glasses). Furthermore, vision loss may be more common outside the urban centre of Nuku'alofa.
If the relatively low rates of vision impairment seen in the present study are found to be robust, the priority of population‐wide vision screening may need to be evaluated.Citation2011 Lowering the cost of screening, by pairing it with other measures of health, considering alternatives to custom glasses, and reducing the barriers to performing quality screening (by keeping tests simple and automated), may help to tip the balance toward vision screening and toward having children who need eye care receiving it.
Conclusion
The children tested in Tonga had good vision, with mild to moderate loss mostly attributable to suspected astigmatism. The electronic recognition acuity task using TAO in the regular format was practical for testing in community environments and showed acceptable agreement with a standardised chart, with potential for further improvements to optimise screening. However, it is of note that the infrastructure in Tonga would need to be expanded for population‐wide screening to be beneficial.
ACKNOWLEDGEMENTS
We thank the staff at the schools in which we collected data, as well as the families and children who participated in the study. This project was made possible through financial support from Cure Kids NZ, NZOVRF and the Robert Leitl Trust. The Ranchhod Foundation and NZAID helped fund the broader initiative within which this project was carried out.
Additional information
Funding
REFERENCES
- Hopkins S, Sampson GP, Hendicott P et al. Review of guidelines for children's vision screenings. Clin Exp Optom 2013; 96: 443–449.
- Solebo AL, Cumberland PM, Rahi JS. Whole‐population vision screening in children aged 4‐5-years to detect amblyopia. Lancet 2015; 385: 2308–2319.
- Resnikoff S, Pascolini D, Mariotti SP et al. Global magnitude of visual impairment caused by uncorrected refractive errors in 2004. Bull World Health Organ 2008; 86: 63–70.
- Baltussen R, Naus J, Limburg H. Cost‐effectiveness of screening and correcting refractive errors in school children in Africa, Asia, America and Europe. Health Policy 2009; 89: 201–215.
- Moseley MJ. Preschool vision screening: a recent report calls for a halt. Br J Ophthalmol 1998; 82: 722–723.
- Nottingham chaplin PK, Baldonado K, Hutchinson A et al. Vision and eye health: moving into the digital age with instrument‐based vision screening. NASN Sch Nurse 2015; 30: 154–160.
- Cotter SA, Cyert LA, Miller JM et al. Vision screening for children 36 to G72 months: recommended practices. Optom Vision Sci 2015; 92: 6–16.
- Morgan IG, French AN, Ashby RS et al. The epidemics of myopia: aetiology and prevention. Prog Retin Eye Res 2018; 62: 134–149.
- Holden BA, Fricke TR, Wilson DA et al. Global prevalence of myopia and high myopia and temporal trends from 2000 through 2050. Ophthalmology 2016; 123: 1036–1042.
- Read SA, Vincent SJ, Tan CS et al. Patterns of daily outdoor light exposure in Australian and Singaporean children. Transl Vis Sci Technol 2018; 7: 8.
- Newland HS, Woodward AJ, Taumoepeau LA et al. Epidemiology of blindness and visual impairment in the Kingdom of Tonga. Br J Ophthalmol 1994; 78: 344–348.
- Lees J, Mccool J, Woodward A. Eye health outreach services in the Pacific Islands region: an updated profile. N Z Med J 2015; 128: 25–33.
- Ramke J, du Toit R, Roberts B et al. Vision screening of children attending primary school in rural Timor‐Leste. Clin Exp Ophthalmol 2011; 39: 377–378.
- Garner LF, Kinnear RF, Klinger JD et al. Prevalence of myopia in school children in Vanuatu. Acta Ophthalmol 1985; 63: 323–326.
- Garner LF, Kinnear RF, Mckellar M et al. Refraction and its components in Melanesian school children in Vanuatu. Am J Optom Physiol Opt 1988; 65: 182–189.
- Garner LF, Meng CK, Grosvenor TP et al. Ocular dimensions and refractive power in Malay and Melanesian children. Ophthalmic Physiol Opt 1990; 10: 234–238.
- Grossman DC, Curry SJ, Owens DK et al. Vision screening in children aged 6 months to 5-years: US preventive services task force recommendation statement. J Am Med Assoc 2017; 318: 836–844.
- Yamada T, Hatt SR, Leske DA et al. A new computer‐based pediatric vision‐screening test. J AAPOS 2015; 19: 157–162.
- Hamm LM, Yeoman JP, Anstice N et al. The Auckland Optotypes: an open‐access pictogram set for measuring recognition acuity. J Vis 2018; 18: 13–13.
- Ramke J, Brian G, du Toit R. Eye disease and care at hospital clinics in Cook Islands, Fiji, Samoa and Tonga. Clin Exp Ophthalmol 2007; 35: 627–634.
- Ramke J, Du toit R, Palagyi A et al. Public sector refraction and spectacle dispensing in low‐resource countries of the Western Pacific. Clin Exp Ophthalmol 2008; 36: 339–347.
- Pearce MG, Pearce N. Addressing refractive error visual impairment: volunteer organisations' alignment with Vision 2020 and public health principles. Clin Exp Optom 2012; 95: 583–589.
- Pearce MG. Clinical outcomes following the dispensing of ready‐made and recycled spectacles: a systematic literature review. Clin Exp Optom 2014; 97: 225–233.
- Keeffe JE, Konyama K, Taylor HR. Vision impairment in the Pacific region. Br J Ophthalmol 2002; 86: 605–610.
- Bland JM, Altman DG. Statistical methods for assessing agreement between two methods of clinical measurement. Lancet 1986; 1: 307–310.
- Langridge F. In Our Own Backyard: Investigating the Health Status of Primary School Children in Tonga. Department of Paediatrics: Child and Youth Health and Pacific Health Section, School of Population University of Auckland, Auckland, New Zealand. 2017. p. 379.
- Hyvarinen L, Nasanen R, Laurinen P. New visual acuity test for pre‐school children. Acta Ophthalmol 1980; 58: 507–511.
- Donahue SP, Baker CN. Procedures for the evaluation of the visual system by pediatricians. Pediatrics 2016; 137: e20153597.
- Donahue SP, Arthur B, Neely DE et al. Guidelines for automated preschool vision screening: a 10‐year, evidence‐based update. J AAPOS 2013; 17: 4–8.
- Mu Y, Bi H, Ekure E et al. Performance of spot photoscreener in detecting amblyopia risk factors in Chinese pre‐school and school age children attending an eye clinic. PLoS One 2016; 11: e0149561.
- Watson AB, Pelli DG. Quest: a Bayesian adaptive psychometric method. Percept Psychophys 1983; 33: 113–120.
- Brainard DH. The psychophysics toolbox. Spat Vis 1997; 10: 433–436.
- Shah N, Dakin SC, Redmond T et al. Vanishing Optotype acuity: repeatability and effect of the number of alternatives. Ophthalmic Physiol Opt 2011; 31: 17–22.
- Prins N, Kingdom FAA. Applying the model‐comparison approach to test specific research hypotheses in psychophysical research using the Palamedes toolbox. Front Psychol 2018; 9: 1250.
- Beck RW, Moke PS, Turpin AH et al. A computerized method of visual acuity testing. Am J Ophthalmol 2003; 135: 194–205.
- Hashemi H, Fotouhi A, Yekta A et al. Global and regional estimates of prevalence of refractive errors: systematic review and meta‐analysis. J Curr Ophthalmol 2018; 30: 3–22.
- He M, Xiang F, Zeng Y et al. Effect of time spent outdoors at school on the development of myopia among children in China: a randomized clinical trial. JAMA 2015; 314: 1142–1148.
- Verkicharla PK, Chia NEH, Saw SM. What public policies should be developed to cope with the myopia epidemic? Optom Vis Sci 2016; 93: 1055–1057.
- Owens H, Gamble GD, Bjornholdt MC et al. Topographic indications of emerging keratoconus in teenage New Zealanders. Cornea 2007; 26: 312–318.
- Dudovitz RN, Izadpanah N, Chung PJ et al. Parent, teacher, and student perspectives on how corrective lenses improve child wellbeing and school function. Matern Child Health J 2016; 20: 974–983.
- Bundy DAP, de Silva N, Horton S et al. Investment in child and adolescent health and development: key messages from disease control priorities, 3rd edition. Lancet 2018; 391: 687–699.
- Brady CJ, Villanti AC, Gandhi M et al. Visual function after correction of distance refractive error with ready‐made and custom spectacles: a randomized clinical trial. Ophthalmology 2012; 119: 2014–2020.