Abstract
To clarify the formation condition of Type A humic acids (HAs) from plant residues and to contribute to reducing CO2 emission, three plant residues were incubated for 0, 25, 50, 100 and 160 days with fresh volcanic ash and water at 90°C to produce humic acid like substances (HALS). The HALS of all incubation samples showed a decrease in log (A 400 /A 600 ) values and an increase in A 600 /C values with increasing incubation time. When HALS were classified, only rice straw HALS of 160 days (RS160) belonged to Type A, whereas broad leaf HALS of 160 days (BL160) and Japanese cedar sawdust HALS of 160 days (JCSD160) belonged to Type B. For elemental and nuclear magnetic resonance (NMR) analysis, the HALS samples were prepared according to the International Humic Substances Society (IHSS) method. Data from the elemental composition of all HALS showed high contents (45.98 to 56.55) of carbon (C), low (3.19 to 5.16) hydrogen (H), and low (0.33 to 2.36) nitrogen (N). Carbon content increased in RS and BL, and increased or fluctuated to some extent in the JCSD, whereas H and N contents decreased in all samples as incubation progressed. The H/C and O/C ratios showed a marked decrease, simultaneously the O/H ratio increased, with increased incubation days. These results suggested that oxidation occurred in the incubation system. Although some HALS samples (RS160 and BL160) appeared in the Type A region in both H/C versus O/C and H/C versus O/H diagrams. HALS plotted in the figures of log (A 400 /A 600 ) versus A 600 /C, H/C versus O/C and H/C versus O/H diagrams were generally placed out of the area of natural soil HAs. In the case of 1H NMR, the spectral shape of RS, BL and JCSD differed from that of natural soil HAs. Only the 1H NMR spectrum of RS160 was similar to that of Type A soil HA. Changes in the composition of proton species in HALS showed that percentages of aromatic protons (Har) increased with increasing incubation. Spectra obtained using 13C NMR revealed that RS and BL HALS were different from natural soil HAs, whereas RS160 was similar to Type A HA spectra. In the spectra of RS HALS, the signal intensities of carbohydrate C (approximately 74 and 105 p.p.m.) and methoxyl C (approximately 56 p.p.m.) decreased gradually as incubation time progressed, while carboxylic C (approximately 175 p.p.m.) increased. Simultaneously other distinct signals became broad and overlapped each other. As a result, the changes in RS HALS spectra suggested that progress in the modification of lignin and the oxidative degradation of polysaccharide structure, and the spectrum of RS160 became similar to the spectra of Type A HAs. Although the only signal resulting from phenolic C (approximately 150 p.p.m.) still appeared in RS160, the signal intensity decreased and became broader and weaker from RS0 to RS160 with incubation time. Therefore, it was concluded that RS HALS might form a completely similar spectra to the spectra of natural Type A HAs with longer incubation time.
INTRODUCTION
Andosols are widely distributed around the world and cover more than 124 million hectares, which is approximately 0.8% of the total earth's surface soil (CitationUSDA Soil Survey Staff 1999). The central concept of Andosols is that of a soil developed from volcanic ejecta and these soils usually have a dark A horizon (melanic epipedon) and high humus content (CitationShoji et al. 1993). This thick black or blackish brown A horizon contains a lot of organic carbon, indicative of the predominance of Type A humic acid (HA), a highly humified and very hard to decompose organic material. Type A HAs are frequently present in the surface horizon of melanic Andosols, Mollisols and the buried horizon of Andosols (CitationKumada 1987; CitationOtsuka and Kumada 1984), and in the surface horizon of irrigated paddy fields (CitationKumada 1987; CitationMaie 2000). They are more stable in the soil and the age of carbon, determined by the rate of 14C (CitationKumada et al. 1987), ranged from the present to 28,000 years bp, particularly, in buried horizons, whereas it ranged from 460 to 3820 years bp in agricultural surface soils (CitationYamada 1986). These carbons appeared to be more stable in Mollisols than in any other mineral soils (CitationStevenson 1994).
In contrast, with the growing population of the world, large amounts of waste materials from biological resources such as agricultural wastes, refused foods and kitchen wastes are creating problems in our everyday life and polluting soils and the environment. Therefore, it is important to dispose of these ever-increasing wastes in an appropriate manner. There are several management practices, such as source reduction, recycling, composting and creating soil amendment materials, which can prevent or divert materials from the waste stream. It is also important to consider that the soil organic matter or humus releases carbon dioxide into the atmosphere during decomposition. In addition, global warming is becoming one of the most acute problems in this decade, wherein increases in the concentration of atmospheric carbon dioxide will enhance the earth's natural greenhouse effect through gas emission of fossil fuel by day (CitationWild 1993; CitationCesar et al. 2001). Keeping these points in view, the sequestration of carbon dioxide in the soil for a longer period of time is of great importance. The creation of soil amendment materials (Type A humic acid like substances [HALS]) from plant residues, lumber wood and municipal waste is one way to utilize these wastes. In contrast, if Type A HALS of similar properties to natural Type A HA could be produced, it would be possible to store carbon in the soil for a longer period of time by fixing these Type A HALS in the soil. In connection to the origin and formation of Type A HAs, CitationShindo et al. (1986, Citation2003, Citation2004) suggested that charred grass is one of the origins because the physicochemical and spectroscopic properties of HAs (corresponding to HALS in this paper) obtained from oven-charred materials after treatment of grassland plants, such as susuki (Miscanthus sinensis) with nitric acid or H2O2, were very similar to those of Type A HAs in Andosols. When susuki was incubated with young volcanic ash and water at 90°C for 202 days, HALS containing Type A HA were produced (CitationAtendido et al. 2004; CitationOtsuka et al. 1994). These researchers concluded that fresh volcanic ash and water could accelerate the humification of some plant residues, thereby producing Type A HA. However, they only characterized Type A HALS using certain optical properties (i.e. Δlog K and RF; where Δlog K was expressed by [log K400 − log K600] and K400 and K600 are the optical density at 400 and 600 nm, respectively. The RF value was K600 × 1000/C, where C is the consumption of 0.1 mol L−1 KMnO4 in mL using 30 mL of HA). Therefore, it is important to compare this Type A HALS with natural Type A HA using other spectral methods. The purpose of the present study is to clarify the formation condition of Type A HALS from plant residues and to contribute to a reduction in CO2 emission. Three plant residues were incubated with fresh volcanic ash and water at 90°C to produce HALS.
MATERIALS AND METHODS
Preparation of incubated samples
Rice (Oryza sativa) straw purchased from Kagotani Company (Hungnam, North Korea), broad leaf (Quercus dentata) and Japanese cedar (Cryptomeria japonica) sawdust were ground and passed through a 2 mm sieve. Fresh volcanic ash was collected from around Sakurajima volcano in 1997. Four grams of each air-dried and ground sample was incubated with 20 g of fresh volcanic ash at 90°C at an increasing incubation period of 0, 25, 50, 100, and 160 days. Approximately 20 mL of water (or until saturation) was added to the sample every day.
Preparation of HALS from incubated samples
The International Humic Substances Society IHSS method (CitationSwift 1996) was followed to extract HALS from different incubated samples. Approximately 8 g of each incubated sample was suspended with 0.1 mol L−1 NaOH (300 mL g C−1). The system was shaken for 4 h at room temperature under N2 and centrifuged at 12,000 ×g for 10 min. The supernatant containing HALS was separated, immediately acidified to pH 1 with 3 mol L−1 HCl and allowed to stand for more than 18 h at 4°C. The acidified suspension was again centrifuged at 12,000 ×g for 10 min to remove the supernatant. The residue containing HALS was dissolved with a minimum volume of 0.1 mol L−1 KOH and centrifuged at 18,000 ×g for 60 min. The supernatant was vacuum-filtered through a 0.45 µm membrane filter (JHWP, Millipore Corporation, Bellerica, MA, USA) into a 250 mL centrifuge tube and immediately acidified to pH 1 with 3 mol L−1 HCl, and allowed to stand for more than 18 h at 4°C. After centrifugation, the precipitate was suspended in a mixture of 0.1 mol L−1 HCl and 0.3 mol L−1 Hydrogen Floride (HF) (approximately 50 mL each), shaken overnight at room temperature, and subsequently centrifuged at 12,000 ×g for 10 min to remove the supernatant. This treatment was repeated twice. The residue was then suspended with 0.05 mol L−1 HCl (approximately 100 mL), shaken for 2 h, and centrifuged at 12,000 ×g for 10 min. This treatment was repeated twice. The residue was again suspended with a minimum volume of de-ionized water and transferred into a dialysis membrane tube (Spectra/Por 3 Membrane, molecular weight cut off [MWCO] 3500; Spectrum Laboratories Inc. CA, USA). Subsequently, the suspension was dialyzed against de-ionized water until the dialysis water gave an electrical conductivity (EC) value close to that of the de-ionized water. The sufficiently dialyzed suspension was freeze-dried. The yielded HALS powder was ground uniformly with an agate mortar and stored in a desiccator.
Preparation of soil humic acids and lignin
For comparison with the HALS, the HAs from three soils, NG, SG and OG (from Cambisol, Andosol and buried Andosol, respectively), described in previous reports (CitationFujitake et al. 1998, CitationYanagi et al. 2003) were used. Two standard HA samples, Dando (DN) and Inogashira (IG) from Cambisol and Andosol, respectively, distributed by the Japanese Humic Substances Society (CitationKuwatsuka et al. 1992; CitationWatanabe et al. 1994, Citation2004) were also used. A sample of lignin (LG) was prepared from the purchased reagent, lignin alkaline (Nakarai Tesque Co., Kyoto, Japan). After the reagent was dissolved in de-ionized water, the solution was acidified to pH 1. The supernatant was removed by centrifuge. The precipitate (HA) fraction in the lignin alkaline was treated repeatedly with acid-precipitate procedures and finally the precipitates were dialyzed and freeze-dried.
Analysis of optical properties [log (A 400 /A 600 ) and A 600 /C]
Extraction procedures were carried out according to Kobo and Oba's method (CitationOba 1964). Equivalent gram samples of approximately 200 mg carbon content were extracted using 60 mL of 0.5% NaOH under boiling for 30 min. After cooling, the sample was centrifuged (10,000 g) and 20 mL of the supernatant solution was poured into a 50 mL beaker and acidified with 0.2 mL of concentrated H2SO4. After standing for 1 h the solution was filtered (Toyo No. 6) and the precipitate was dissolved using 5 mL of 0.1 mol L−1 NaOH. Immediately after dissolution, the absorbance at 400 and 600 nm was determined using a UV-visible spectrometer (V-530 JASCO Corporation, Tokyo, Japan). The organic carbon concentration was determined using TOC-VCPH (Shimadzu Corporation, Kyoto, Japan). An optical property was expressed using a log (A 400 /A 600 ) versus A 600 /C diagram (CitationIkeya and Watanabe 2003; CitationIkeya et al. 2004) to classify the type of HALS. Δlog K or log (A 400 /A 600 ) and A 600 /C were calculated as follows: Δlog K or log (A 400 /A 600 ): Color tone of HA expressed as (log A 400 – log A 600 ), where A is the absorbance at 400 and 600 nm, respectively. A 600 /C, where C is the organic carbon concentration in mg mL−1, and A 600 is the absorbance at 600 nm. RF value: A 600 /C/0.0648 (CitationIkeya and Watanabe 2003; CitationIkeya et al. 2004).
Elemental analysis
Approximately 2.5 mg of each vacuum-dried HALS sample was used. Prior to the analysis, each sample was dried at 55°C overnight using a vacuum dry oven (Eyela Company Tokyo Rikakikai Co., Ltd. Tokyo, Japan). The ash content of each sample was determined by burning the sample in micro ceramic crucibles at 550°C for 12 h and measuring the mass of remaining ash. The carbon, hydrogen and nitrogen contents of each humic substance sample were determined using a Perkin-Elmer (Ann Arbor, MI, USA) 2400-CHN/S elemental analyzer. Oxygen content was calculated by subtracting the sum of the C, H and N contents (%wt on moisture- and ash-free basis) from 100.
1H nuclear magnetic resonance spectroscopic analysis
The liquid-state 1H nuclear magnetic resonance (NMR) spectrum of each HALS or HA was recorded at 250.0 MHz on a Bruker DPX 250 spectrometer (Fahrenheitstr. Bremen, Germany) (2.35 T, Bruker GmbH) using a 5 mm (internal diameter) NMR tube. Sample preparation, including deuterium exchange treatment, was based on the report of CitationFujitake et al. (2003). Deuterium oxide (99.9 atom % D, Aldrich Chemical Company, Milwaukee, WI, USA and 100 atom % D, Eurisotop, Milwaukee, WI, USA) was used. The spectra were obtained under homo-gated decoupling (HOD) methods to suppress residual proton signals. The acquisition parameters used were as follows: pulse width 15.0 sec (90° pulse), sweep width 3500 Hz, acquisition time 2.0 sec, and relaxation delay 4.8 sec. The HOD signal (4.7 p.p.m.) associated with water impurities was
Table 1 Log(A400/A600), A600/C, and elementary composition of humic acid like substances obtained from three plant residues with volcanic ash using thermal incubation
13C nuclear magnetic resonance spectroscopic analysis
The liquid-state 13C NMR spectrum of each HALS or HA sample was recorded at 62.896 MHz on a Bruker DPX 250 spectrometer (2.35 T, Bruker GmbH) using the inverse-gated decoupling methods with a 10-mm (internal diameter) NMR tube. Sample preparation was based on the report of CitationFujitake and Kawahigashi (1999). The acquisition parameters used were as follows: pulse width 3.5 sec (45° pulse) and delay for proton relaxation 2.5 sec. A line broadening of 40 Hz was used to improve the signal-to-noise ratio. Approximately 20,000 scans were accumulated for each sample. Chemical shifts were expressed in p.p.m. down field from the external Tetramethylsilane (TMS) (0 p.p.m.) which is harmonised with a capillary tube. The spectra were divided into the following six areas: 0–48 p.p.m. aliphatic C; 48–105 p.p.m. methoxyl and carbohydrate C; 105–145 p.p.m. aromatic C; 145–165 p.p.m. phenolic C; 165–180 p.p.m. carboxylic C; and 180–220 p.p.m. carbonyl C (CitationFujitake and Kawahigashi 1999), and the C composition was obtained in the same way as the H composition. Aromaticity was calculated by expressing the amount of aromatic C (105–165 p.p.m.) as a percentage of aliphatic C + carbohydrate C + aromatic C (i.e. 0–165 p.p.m.) (CitationHatcher et al. 1981).
RESULTS AND DISCUSSION
Log (A 400 /A 600 ) and A 600 /C of HALSs
showed that the log (A 400 /A 600 ) values for rice straw (RS) HALS ranged from 0.74 to 1.01, for broad leaf (BL) HALS the values ranged from 0.82 to 0.94 and for Japanese cedar sawdust (JCSD) HALS the values ranged from 0.84 to 0.90 in the different incubation periods. RS0 HALS showed higher log (A 400 /A 600 ) values than BL0 and JCSD0. Log (A 400 /A 600 ) values decreased
Figure 1 Log (A400/A600) versus A600/C diagrams of humic acid like substances (HALS) and soil humic acids (HAs) and their classification. BL, broad leaf; DN, Dando; IG, Inogashira; JCSD, Japanese cedar sawdust; LG, lignin; NG, Nagamine; OG, Oginosen; RS, rice straw; SG, Sugadaira.
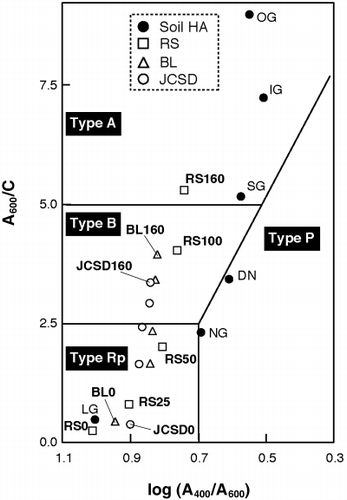
When HALS were classified according to CitationIkeya and Watanabe (2003), each HALS was plotted in . From 0 to 50 days, HALS from all plant residues belonged to Type Rp and Type B HALS occurred from 100 days. Only RS160 belonged to Type A by 160 days of incubation, whereas all other HALS samples belonged to Type B at similar incubation times. Undoubtedly, the HALS from RS0, BL0 and JCSD0 consist of a mixture of plant components (i.e. lignin, polysaccharides and lipids) rather than humic substances. If the classification system in could apply to the HALS as well as natural HA, the results indicate that non-humic substances were converted to humic substances, even Type A. However, the plotted area of HALS in shifted to the left from those of soil HAs in this study and in the data described by CitationKumada (1987).
In general, the log (A 400 /A 600 ) of soil Type A HAs ranged from 0.45 to 0.65, whereas Type A HALS (RS160) was 0.74. Therefore, Type A HALS (RS160) produced in the present study might differ from soil Type A HAs. According to CitationMaie et al. (2002), higher log (A 400 /A 600 ) values of paddy soil HAs implied that the electron resonance system in paddy soil HAs did not develop as well as that of Andosol HAs. Therefore, it was concluded that, for assessing the humification degree for HALS, values of log (A 400 /A 600 ) may be unbefitting and/or Type A HALS samples need more incubation time to develop the electron resonance system that could give high humification degree like soil Type A HAs. For this reason HALS should also be analyzed using other spectral methods.
Elemental composition
Elemental compositions of the HALS are listed in . All incubated samples were high (45.98 to 56.55) in C, low (3.19 to 5.16) in H and low (0.33 to 2.36) in N contents. These values were very close to the soil HAs reported by CitationKumada (1987) and CitationYonebayashi and Hattori (1988). Carbon content increased in RS and BL, and for JCSD increased or fluctuated to some extent, whereas H and N contents decreased in all samples as incubation progressed. The atomic H/C, O/C, N/C and O/H ratios are also listed in . H/C ranged from 0.68 to 1.23 in RS, 0.79 to 1.27 in BL and 0.86 to 1.14 in JCSD, which showed a marked decrease with increased incubation. Similarly, the O/C ratios ranged from 0.51 to 0.67 in RS, 0.62 to 0.77 in BL and 0.66 to 0.80 in JCSD, and also decreased with incubation time. In contrast, O/H ratios ranged from 0.51 to 0.75 in RS, 0.61 to 0.78 in BL and 0.70 to 0.76 in JCSD, and increased markedly with incubation time with all HALS. In general, a decrease in the H/C ratio reflects a decrease in saturated bond content (CitationYanagi et al. 2003; CitationYonebayashi and Hattori 1988) and the O/H ratio expresses the degree of humification (CitationKumada 1987). Therefore, the above results indicated that HALS with lower H/C and higher O/H ratios reflect a higher degree of humification. When the value of the H/C, O/C and O/H ratios of HALS were compared with those of the soil HAs reported by CitationFujitake et al. (1999), CitationKumada (1987), CitationKuwatsuka et al. (1978), CitationYanagi et al. (2003) and CitationYonebayashi and Hattori (1988), HALS of 0, 25, 50 and 100 days from all RS, BL and JCSD were different from the soil HAs.
Figure 2 (a) H/C versus O/C and (b) H/C versus O/H diagrams of humic acid like substances (HALS) and soil humic acids (HAs). The direction of the arrows indicates: a, dehydration; b, demethanation; c, decarboxylation. BL, broad leaf; DN, Dando; IG, Inogashira; JCSD, Japanese cedar sawdust; LG, lignin; NG, Nagamine; OG, Oginosen; RS, rice straw; SG, Sugadaira.
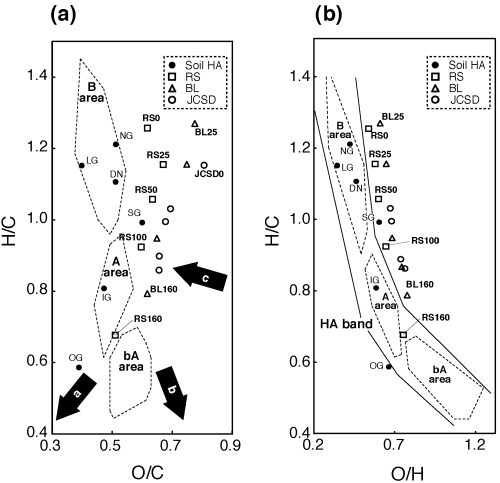
According to CitationKuwatsuka et al. (1978), CitationVan Krevelen (1950) and CitationYonebayashi and Hattori (1988) the atomic H/C versus O/C diagram was developed to obtain more detailed information on the type of reactions by straight lines (such as decarboxylation, demethanation and dehydration) that occurred during the incubation () that was frequently used in the coal field. From , it appears that dehydration, decarboxylation and slight demethanation occurred in RS, BL and JCSD HALS with increased incubation time. These results coincided with the works of CitationKuwatsuka et al. (1978), who found that demethanation and decarboxylation occurred during the humification process. However, the plotted area of HALS () shifted to the right from those of soil HAs reported by CitationKumada (1987), except for RS160. RS160 was located on the border between A and bA (CitationKumada 1987). Therefore, it appears that RS160 could be equated to soil Type A HAs. According to CitationKumada (1987), the H/C versus O/H diagram can discriminate the area of all Type of HA more clearly than the H/C versus O/C diagram in considering the progress of humification by plotting the distribution of all the soil HAs in a comprising area, which is called the HA band. Therefore, the H/C versus O/H diagram was drawn to plot the HALS as well as soil HAs in one diagram (). RS160 HALS completely appeared in the A area in the HA band, and RS100 and BL160 HALS almost appeared, although RS0 HALS, which was raw plant material, appeared outside the HA band. Simultaneously, BL HALSs also appeared outside the HA band. The O/H ratios increased with increased incubation time with all HALS samples, which suggests that oxidation occurred in the incubation system and as a result some HALS samples (RS160, RS100 and BL160) appeared or almost appeared in the Type A region of the HA band. The location of all HALS, except for RS160, shifted the area from soil HA area, as did the results for log (A 400 /A 600 ) versus A 600 /C. HALS created in the present study might be of a different category from soil HA, except for RS160.
1H nuclear magnetic resonance spectra
1H NMR spectra of HALS samples from RS, BL, JCSD and of HAs from five soils and lignin are shown in . The spectra of all HALS showed peaks in the same chemical shift regions; however, the magnitude of the peaks varied. The chemical shift assignment of the 1H NMR spectra were interpreted according to CitationFujitake et al. (2003), CitationKawahigashi et al. (1996), CitationWilson (1987) and CitationYonebayashi and Hattori (1989).
The spectral shape of RS0, RS25 and RS50 was very similar. The shape of RS100 was slightly different in the peak shape of the aromatic region. The spectrum of RS160 drastically changed from that of RS100 and the shape was quite similar to the shape of soil HAs, particularly IG and SG belonging to Type A HA. The results
Figure 3 1H nuclear magnetic resonance spectra of humic acid like substances (HALS) and soil humic acids (HAs). BL, broad leaf; DN, Dando; IG, Inogashira; JCSD, Japanese cedar sawdust; LG, lignin; NG, Nagamine; OG, Oginosen; RS, rice straw; SG, Sugadaira.
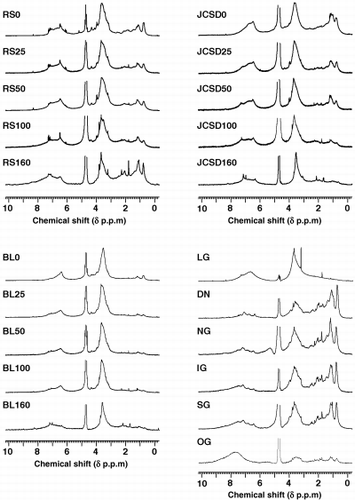
Table 2 Distribution of proton species on humic acid like substances thermally created from different plant residues in various incubation periods and on various soil humic acids
The values of the proton species estimated by the integral area in different samples are listed in . The values of the HALS were close to soil HAs, but different when compared to soil HA reported by CitationFujitake et al. (2003), CitationKawahigashi et al. (1996) and CitationYonebayashi and Hattori (1989). The table shows that the values of aromatic protons increased in every sample during incubation. In particular, RS HALS clearly showed a gradual increase of aromatic proton (from 21.3% to 26.5%) over 160 incubation days. The values of Hc-o in RS declined markedly from 48.0% to 25.7% in 160 days, whereas the values in the other two series (BL and JCSD) did not show gradual change during incubation. From the above results it can be assumed that with incubation time, condensation of aromatic protons takes place.
13C nuclear magnetic resonance spectra
13C NMR spectra of selected samples (five RS and two BL HALS, five soil HAs and lignin) are shown in . HALS of RS and BL showed significant results (and belonged to Type A or almost appeared in the Type A area) with respect to the log (A 400 /A 600 ) versus A 600 /C diagram and in the elemental analysis, but HALS of JCSD did not belong to Type A like the RS and BL HALS. Therefore, all RS and two BL HALS were used for this analysis to acquire more detailed information about HALS. To compare the carbon species distribution, the percentage of each carbon species estimated by the integral area is listed in . The RS0 spectrum, which had distinct and intensive peaks around 30, 56, 74, 105, 120, 130, 150 and 175 p.p.m. (), was completely different from soil HA, which had broader and overlapping signals. In a practical sense, RS0 HALS consisted of the manifold of non-humic substances in fresh rice straw. Thus, the assignment of individual signals in the RS0 spectrum should be less complex than those in the soil HA spectra. Dominant resonance at approximately 56 and 150 p.p.m. originated from methoxyl C and phenolic C in lignin structure, respectively (CitationMaciel et al. 1981), as shown in the spectrum of lignin HA (LG). The signals at approximately 74 and 105 p.p.m. resulted from the carbohydrate C that originated from sugar moieties of rice straw containing hydrolyzed cellulose or hemicelluloses. Others were assigned to chains of methylene group (approximately
Figure 4 13C nuclear magnetic resonance spectra of humic acid like substances (HALS) and soil humic acids (HAs). BL, broad leaf; DN, Dando; IG, Inogashira; LG, lignin; NG, Nagamine; OG, Oginosen; RS, rice straw; SG, Sugadaira.
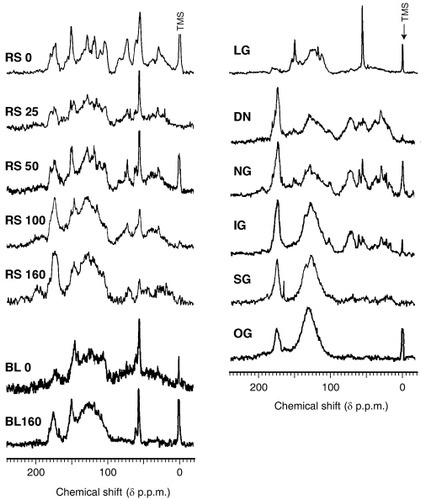
In the spectra of RS HALS, the signal intensities of carbohydrate C (approximately 74 and 105 p.p.m.) and methoxyl C (approximately 56 p.p.m.) decreased gradually as incubation progressed, whereas those of carboxylic C (around 175 p.p.m.) increased. In addition to that, broadness of the signals resulting from C = C double bonds (105–145 p.p.m.) increased markedly. According to CitationFlaig (1988), changes in the lignin structure during the conversion of lignin to humic substances would include a loss of methoxyl groups, with exposure of phenolic hydroxyl groups, and oxidation of terminal side chain to form carboxyl groups. CitationMannu (2002) reviewed recent NMR studies of wood and wood products and found that demethoxylation, depolymerization and condensation of lignin was detected on the 13C CPMAS NMR spectra in thermally or chemically modified lignin. Therefore, changes in RS HALS spectra suggest progress in the modification of lignin structure.
In addition, CitationLehtonen et al. (2001) stated that after oxidation of HAs with CuO, the peaks at approximately 74 p.p.m. in the HCOH carbons in the polysaccharide structure decreased and there was an increase in the carboxyl carbon. It is well known that carbohydrates play a role in forming humic substances by producing brown nitrogenous polymers through condensation of reducing sugars and amines called
Table 3 Distribution of carbon species on humic acid like substances of rice straw and broad leaf incubated with volcanic ash for various incubation periods and on various soil humic acids.
In contrast, the spectral shapes of RS25 and RS50 were quite different from natural soil HAs. They had marked methoxyl and phenolic C signals and a relatively small carboxylic C signal. Indeed, RS25 was relatively similar to LG. However, with incubation time, these signals became broad and overlapped each other. This indicates that the constituents of non-humic substances from RS changed to Type A HALS over this incubation period, but the process of the formation of Type A HALS was different from the process in soil HAs (humification). As mentioned in , RS HALS showed a marked increase in the portion of aromatic carbon and a decrease in the aliphatic portion with increased incubation time. Carboxylic C increased and the methoxyl portion decreased with incubation time. In BL HALS samples, aliphatic, methoxyl and carbohydrate C fractions decreased and the carboxyl C portion increased with incubation time. In the spectra of BL0 and BL160, HALS had no signals of methylene C or polysaccharide C originally, which was completely similar to the lignin spectra. The spectral shape of the aromatic C area was characterized by the dispersed aromatic C signals that were focused on a broad signal with a maximum resonance at approximately 125 p.p.m. This continues to occur with a longer incubation period.
The well-known major pathways of humic substance synthesis are lignin, polyphenols and melanoidin theory (CitationStevenson 1994). Considering the melanoidin theory, with the presence of sugars and amino acid in the plant residues, melanoidin can be produced through the Maillard reaction. However, the 13C NMR spectroscopy revealed that in RS and BL HALS, there were peaks at approximately 55 p.p.m. and 105 p.p.m., which were responsible for methoxyl group C and polysaccharide C, respectively. Melanoidin did not resolve these peaks. In contrast, a peak at approximately 15 p.p.m., which arises from terminal methyl carbons of alkyl chains, appears only in melanoidin spectra (CitationBenzing and Ripmeester 1983). Therefore, the product produced through this incubation was different from melanoidin and it is suggested that HALS produced in the present study might be part of the oxidative degradation of polysaccharide structure, rather than melanoidin formation.
In natural conditions microorganisms would decompose lignin and HAs low degrees of humification would be produced. In contrast, this study was conducted under controlled and abiotic conditions. We were able to produce Type A HALS from plant residues with volcanic ash using thermal incubation, which belonged to Type A using log (A 400 /A 600 )–A 600 /C analysis, and were similar to natural Type A HAs with respect to elemental composition. However, they did differ a bit from natural Type A HA in spectroscopic properties. Therefore, it can be concluded that thermal incubation of plant residues with fresh volcanic ash might be able to produce Type A HALS by modification of lignin and oxidative degradation of polysaccharide from plant residues, and HALS of a similar type to natural Type A HAs could be produced with longer incubation times. This is the first report describing the spectroscopic properties of Type A HALS by determining 1H and 13C NMR. The present study has shown the similarities and differences between Type A HAs and the formation conditions of Type A HALS from plant residues, and provides invaluable information for researchers working in the same field of interest.
REFERENCES
- USDA Soil Survey Staff . 1999 . Andosols in soil taxonomy: a basic system of soil classification for making and interpreting soil surveys , 2nd edn , Blackburg : Pocahontas Press .
- Shoji , S , Nanzyo , M and Dahlgreen , R . 1993 . “ Terminology, concepts and geographic distribution of volcanic ash soils ” . In Volcanic Ash Soils , Edited by: Shoji , S , Nanzyo , M and Dahlgreen , R . 1 – 4 . Tokyo : Elsevier .
- Kumada , K . 1987 . “ Humus composition of soils ” . In Chemistry of Soil Organic matter , Kumada 95134 Tokyo : Japan Scientific Society Press .
- Otsuka , H and Kumada , K . 1974 . Studies on the volcanic ash soils at Ohnobaru, Tarumizu City, Kagoshima Prefecture. Part 4. Transformation of P0 type humic acid . JSciSoil Manure Jpn , 45 : 463 – 468 . (in Japanese)
- Maie , N , Taki , A , Yano , K and Kimura , M . 2000 . Comparison of humus composition in subsoil of Japanese paddy and upland fields . Soil SciPlant Nutr , 46 : 163 – 175 .
- Yamada , Y . 1986 . The characterization of humus accumulation in Andosols by 14C dating . BullNatl InstAgro-environSci , 3 : 23 – 86 . (in Japanese with English summary)
- Stevenson , FJ . 1994 . “ Genesis, composition, and reactions ” . In Humus Chemistry , 2nd edn , Edited by: Stevenson , FJ . 303 – 324 . New York : John Wiley & Sons .
- Wild , A . 1993 . Soil and the Environment , New York : Cambridge University Press .
- Cesar , IR , Norman , JR and Rattan , L . 2001 . “ Mitigation of climatic change by soil carbon sequestration: issues of science, monitoring, and degraded lands ” . In Advances in Agronomy , Edited by: Donald , LS . Vol. 70 , 2 – 62 . San Diego : Academic Press .
- Shindo , H , Matsui , Y and Higashi , T . 1986 . Comparison of humic acids from charred residues of susuki (Eulalia, Miscanthus sinensisA.) and from the A horizons of volcanic ash soils . Soil SciPlant Nutr , 32 : 579 – 586 .
- Shindo , H , Ushijima , N and Amano , Y . 2003 . Comparison of elementary and humus composition of woody plants before and after burning . Soil SciPlant Nutr , 49 : 685 – 693 .
- Shindo , H , Honna , T , Yamamoto , S and Honma , H . 2004 . Contribution of charred plant fragments to soil organic carbon in Japanese volcanic ash soils containing black humic acids . OrgGeochem , 35 : 685 – 693 .
- Atendido , SAB , Suzuki , T , Otsuka , H , Fujitake , N and Ishibashi , T . 2004 . Humification of three plant residues with sakurajima volcanic ash as influenced by phosphate addition and low pH condition . Pedologist , 48 : 72 – 82 .
- Otsuka , H , Kimiwada , K and Uehara , Y . 1994 . Genesis of humic acid derived from each plant residue of Susuki (Miscanthus sinensis), Sasa (Sasa nipponica), or Kashiwa (Quercus dentate) in fresh volcanic ash . JpnJSoil SciPlant Nutr , 65 : 629 – 636 . (in Japanese with English summary)
- Swift , RS . 1996 . “ Organic matter characterization ” . In Methods of Soil Analysis, Part 3, Chemical Methods, Soil SciSocAmBook Series: 5 , Edited by: Sparks , DL . 1018 – 1020 . Madison : Soil Sci. Soc. Am .
- Fujitake , N , Kusumoto , A , Tsukamoto , M , Kawahigashi , M , Suzuki , T and Ostuka , H . 1998 . Properties of soil humic substances in fractions obtained by sequential extraction with pyrophosphate solution at different pHs. I. Yields and particle size distribution . Soil SciPlant Nutr , 44 : 253 – 260 .
- Yanagi , Y , Hamaguchi , S , Tamaki , H , Suzuki , T , Ostuka , H and Fujitake , N . 2003 . Relation of chemical properties of soil humic acids to decolorization by white rot fungus-Coriolus consors . Soil SciPlant Nutr , 49 : 201 – 206 .
- Kuwatsuka , S , Watanabe , A , Itoh , K and Arai , S . 1992 . Comparison of two methods of preparation of humic and fulvic acids, IHSS method and NAGOYA method . Soil SciPlant Nutr , 38 : 23 – 30 .
- Watanabe , A , Itoh , K , Arai , S and Kuwatsuka , S . 1994 . Comparison of the composition of humic and fulvic acids prepared by IHSS method and NAGOYA method . Soil SciPlant Nutr , 40 : 601 – 608 .
- Watanabe , A , Maie , N Hepburn , A . 2004 . Chemical characterization of Japanese Humic Substances Society standard soil humic and fulvic acids by spectroscopic and degradative analyses . Humic Substances Research , 1 : 18 – 28 .
- Oba , Y . 1964 . Methodology for the study of soil humus. II . Pedologist , 8 : 108 – 116 . (in Japanese)
- Ikeya , K and Watanabe , A . 2003 . Direct expression of an index for the degree of humification of humic acids using organic carbon concentration . Soil SciPlant Nutr , 49 : 47 – 53 .
- Ikeya , K , Yamamoto , S and Watanabe , A . 2004 . Semi quantitative GC/MS analysis of thermochemolysis products of soil humic acids with various degrees of humification . OrgGeochem , 35 : 583 – 594 .
- Fujitake , N , Kusumoto , A , Tsukamoto , M , Noda , Y , Suzuki , T and Ostuka , H . 2003 . Properties of soil humic substances in fractions obtained by sequential extraction with pyrophosphate solution at different pHs. III. FT-IR and 1H NMR spectra of humic acids . Soil SciPlant Nutr , 49 : 347 – 353 .
- Kawahigashi , M , Fujitake , N and Takahashi , T . 1996 . Structural information obtained from spectral analysis (UV-VIS, IR, 1H NMR) of particle size fractions in two humic acids . Soil SciPlant Nutr , 42 : 355 – 360 .
- Fujitake , N and Kawahigashi , M . 1999 . 13C NMR spectra and elemental composition of fractions with different particle sizes from Andosol humic acid . Soil SciPlant Nutr , 45 : 359 – 366 .
- Hatcher , PG , Schnitzer , M , Dennis , LW and Maciel , GE . 1981 . Aromaticity of humic substances in soils . Soil SciSocAmJ , 45 : 1089 – 1094 .
- Maie , N , Watanabe , A , Hayamizu , K and Kimura , M . 2002 . Comparison of chemical characteristics of Type A humic acids extracted from subsoils of paddy fields and surface ando soils . Geoderma , 106 : 1 – 19 .
- Yonebayashi , K and Hattori , T . 1988 . Chemical and biological studies on environmental humic acids. I. Composition of elemental and functional groups of humic acids . Soil SciPlant Nutr , 34 : 571 – 584 .
- Fujitake , N , Kusumoto , A , Tsukamoto , M , Noda , Y , Suzuki , T and Ostuka , H . 1999 . Properties of soil humic substances in fractions obtained by sequential extraction with pyrophosphate solution at different pHs. II. Elemental composition and UV-VIS spectra of humic acids . Soil SciPlant Nutr , 45 : 349 – 358 .
- Kuwatsuka , S , Tsutsuki , K and Kumada , K . 1978 . Chemical studies on soil humic acids. I. Elementary composition of humic acids . Soil SciPlant Nutr , 24 : 337 – 347 .
- Van Krevelen , DW . 1950 . Graphical-statistical method for the study of structure and reaction processes of coal . Fuel , 29 : 269 – 284 .
- Wilson , MA . 1987 . “ Humic substances. NMR techniques and applications ” . In Geochemistry and Soil Chemistry , Edited by: Wilson , MA . 182 – 216 . New York : Pergamon Press .
- Yonebayashi , K and Hattori , T . 1989 . Chemical and biological studies on environmental humic acids. II. 1H NMR and IR spectra of humic acids . Soil SciPlant Nutr , 35 : 383 – 392 .
- Maciel , GE , O'Donnell , DJ , Ackerman , JJH , Hawkins , BH and Bartuska , VJ . 1981 . A 13C NMR study of four lignins in the solid and solution states . MakromolChem , 182 : 2297 – 2304 .
- Flaig , W . 1988 . “ Generation of model chemical precursors ” . In Humic Substances and Their Role in the Environment , Edited by: Frimmel , FH and Christman , RF . 75 – 92 . New York : Wiley .
- Mannu , SL . 2002 . NMR studies of wood and wood products . Progress in Nuclear Magnetic Resonance Spectroscopy , 40 : 151 – 174 .
- Lehtonen , K , Hanninen , K and Ketola , M . 2001 . Structurally bound lipids in peat humic acids . OrgGeochem , 32 : 33 – 43 .
- Cheshire , MV . 1979 . “ Analysis of hydrolysate for classes of sugars ” . In Nature and Origin of Carbohydrates in Soils , Edited by: Black , CV . 38 – 44 . London : Academic Press .
- Cheshire , MV , Tussell , JD Fraser , AR . 1992 . Nature of soil carbohydrate and its association with soil humic substances . JSoil Sci , 43 : 359 – 373 .
- Ikan , R , Ioselis , P Rubinsztain , Y . 1986 . Carbohydrate origin in humus substances . Naturwissenchaften , 73 : 150 – 151 .
- Ikan , R , Rubinsztain , Y , Nissenbaum , A and Kaplan , IR . 1996 . “ Geochemical aspects of the Millard Reaction ” . In The Millard Reaction Consequences for the Chemical and Life Sciences , Edited by: Ikan , R . 1 – 25 . Chichester : Wiley .
- Benzing , PL and Ripmeester , JA . 1983 . Melanoidins and soil organic matter: evidence of strong similarities revealed by 13C CP-MAS NMR . Soil SciSocAmJ , 47 : 56 – 61 .
- Kumada , K . 1987 . Classification of humic acidsInChemistry of Soil Organic matter , Edited by: Kumada , K . 17 – 33 . Tokyo : Japan Scientific Society Press .