Abstract
We examined the vertical distributions of total, Bray II and organic phosphorus (P) in the Ap horizons of five paddy rice fields including no tillage treatment. Soil samples were collected from the Ap horizons as nine thin layers of 0–1, 1–2, 2–3, 3–4, 4–6, 6–8, 8–10, 10–15 and 15–20 cm from the soil surface after harvest. In three lowland paddy soils of no-tillage Hachirogata (HA-NT), conventional-tillage Hachirogata (HA-T) and conventional-tillage Furukawa (FU-T), the total P (TP) content was relatively low. In these soils, the modified Bray II P (soil : solution = 1:20; shaking time 60s) content decreased and the organic P (OP) content increased at a depth of 0–1 cm compared with the underlying layers, possibly because of high microbial activities as suggested from the increased total C and N contents in this layer. In contrast, the decrease in Bray II P content and the increase in the OP content of the surface layer were not evident in two Andosols of the conventional-tillage Utsunomiya (UM-T) and conventional-tillage Kawatabi (KA-T). Even TP content fluctuated in the thin surface layers of 0–3 cm depending on the sampling site. Accordingly, percentages of Bray II P and OP to TP were calculated to compare the vertical distribution curves between Bray II P and OP. The percentage of Bray II P to TP of the 0–1 cm layer was lower and the percentage of OP to TP in the layer was higher than the underlying layers for HA-T, HA-NT and FU-T. The decrease in Bray II P was nearly compatible with the increase in OP for the surface of the 0–1 cm layers of HA-NT, HA-T and FU-T. This result suggests that a part of Bray II P was converted to OP in the thin surface layer of the Ap horizons in these paddy soils. This change in chemical form of P was more pronounced in the HA-NT by accumulating the effect of the microbial activities over a longer period of time because of no tillage compared with HA-T and FU-T. These findings add a new dimension to P behavior in submerged rice soils under field conditions, particularly near the soil surface. Moreover, we must be careful in soil sampling for P availability evaluation, and soil samples should represent the vertical distribution of P in the whole Ap horizon of a paddy field. Changes in OP with depth in UM-T and KA-T may have been masked by the high OP content as well as by the high TP content in these Andosols.
INTRODUCTION
In general, Ap horizon soils of Japanese paddy rice fields are completely mixed with plowing and puddling before transplanting. The vertical distribution of nutrients must be homogenized once, except the microlayers with soil texture modification (muddy; 0–1.5 mm depth, single grain; 1.5–1.7 mm depth from the surface) in the very surface of soils (CitationSaito and Kawaguchi 1971) because of sedimentation after puddling. Even under these situations, heterogeneous vertical distribution of nutrients can be observed in the Ap horizon soil during a single rice-cropping season. For example, the distribution of P in the Ap horizon is affected by the method of fertilizer application. High values of P were detected at the position of localized P fertilizer application even after rice harvest (CitationAkahane et al. 2006). Moreover, in gley lowland soils of paddy rice fields, Bray II P values were often low at the surface layer of 0–1 cm (CitationAkahane et al. 2006).
The dynamics of plant nutrients in the paddy fields are affected by microbial activity and redox reaction during the rice-growing season. CitationInubushi (1984) showed accumulation of easily decomposable organic nitrogen that was caused by the addition of algal debris in the upper layer (0–1 cm) during the period of submergence. In the surface soil (0–2 cm) of paddy fields, biological nitrogen fixation by, for example, blue-green alga and photosynthetic bacteria resulted in nitrogen enrichment (CitationYasuda et al. 2000).
Dynamics of P in the paddy fields might also be affected by these microbial activities in the soil surface (CitationTurner and Haygarth 2001). Paddy rice soil differentiates into an oxidized surface layer of approximately 0–2 cm and an underlying reduced layer by submergence during the rice-growing season. A sharp transition from a thin oxidized layer in the surface soil (0–2 cm) by oxygen supply through percolation water to a strongly reduced layer has been recognized in the submerged plow layer of a paddy soil (CitationKyuma 2004a; CitationTakai and Uehara 1973). In the reduced layer, the ferric phosphate, if it exists, is reduced to a more soluble ferrous phosphate and P sorbed by poorly crystalline hydrous iron oxide is released with reductive dissolution of the sorbent (CitationKyuma 2004b). The released P as well as ferrous ion can diffuse to the oxidized layer to form a new precipitate of iron phosphate or P sorption products by active Fe and Al in the oxidized layer (CitationFurukawa 1984; CitationSasaki et al. 2001).
Microbial activities and reducing conditions in paddy soil are affected by the intensity of tillage. The redox potential (Eh) of the no-tillage paddy soils is, in many cases, kept higher than that of the conventional tillage paddy soil and soil organic matter tends to accumulate on the no-tillage surface soils because organic residues including rice straw are not mixed with the surface soil. Accordingly, total carbon and total nitrogen tend to accumulate in the no-tillage surface soils (0–2 cm; CitationFujii et al. 2000; CitationIto 2002 or 0–5 cm; CitationKaneta et al. 1995). Both laboratory and field experiments show that the amount of nitrogen mineralization in Ap horizons of no-tillage paddy soils (0–10, 5–10, 2–18 or 1–16 cm) is less than that of conventional tillage paddy soils (CitationFujii et al. 2000; CitationIshibashi et al. 2001; CitationKaneta et al. 1994; CitationTakahashi 1993). In a gley lowland soil, the amount of available P in a no-tillage paddy soil (0–10 cm) was lower than that of conventional tillage soil (CitationIto 2002), possibly because of relatively weak reduction in the former soil.
It is, therefore, plausible that chemical forms of P and their contents in the paddy fields are affected by biological activities, redox conditions and tillage. The objective of this study was to identify the vertical distribution of total phosphorus (TP), Bray II P, organic phosphorus (OP) and their relationships in the Ap horizon soil of the paddy rice fields.
MATERIAL AND METHODS
Study fields
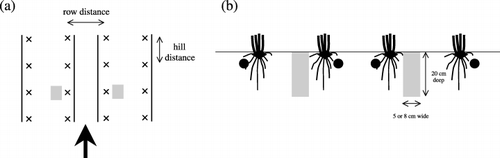
Soil samples were collected from the Ap horizon and its underlying layers in five paddy rice fields with different soil properties and tillage treatments. Two Hachirogata soils were sampled from no-tillage paddy rice fields (HA-NT) continuously for 5 years and conventional-tillage paddy rice fields (HA-T) at the Akita Prefectural College of Agriculture, Ohgata-mura, Akita Prefecture, on 28 March 2003. The Utsunomiya soil was taken from a conventional-tillage paddy rice field (UM-T) at the Utsunomiya University Farm, Mohka, Tochigi Prefecture, on 27 November 2004. Kawatabi soil was collected from a conventional-tillage paddy rice field (KA-T) at the Field Science Center, Tohoku University, Naruko, Miyagi Prefecture, on 22 September 2004. Furukawa soil was sampled from a conventional-tillage paddy rice field (FU-T) at the Miyagi Prefectural Furukawa Agricultural Experiment Station, Furukawa, Miyagi Prefecture, on 19 October 2004. In HA-NT, nitrogen (N) was applied to the nursery boxes as poly-olefin coated urea (LPS-60) before seeding and the rice seedlings were machine transplanted with fertilizer capsules enmeshed with their roots. Fertilizers were applied to HA-T by broadcasting and rotavating before puddling and transplanting of rice seedlings. In UM-T, KA-T and FU-T, fertilizers were side-dressed along the rice-seedling row at a depth of 5 cm from the soil surface () from a nozzle equipped with the transplanting machine. Fertilizer constituents (percentage of N–P2O5–K2O) applied to HA-NT, HA-T, UM-T, KA-T and FU-T were 40-0-0, 13-17-12, 5-20-20, 14-20-14 and 12-18-14, respectively. The P fertilizer rates and soil classification of the paddy fields studied are summarized in . In all paddy fields studied, rice straw was cut and spread on the soil surface at harvest. The rice straw was then mixed with the Ap horizon soil when the soil was plowed in autumn or spring, except HA-NT.
Table 1 Locations, soil classification and P fertilizer rates of the paddy fields studied
Figure 1 The sampling positions (shaded bars) of soils after harvest for UM-T, KA-T and FU-T from above (a) and vertically (b) from the arrow side of (a). ×, rice stubbles (a); – in (a) and • in (b); the positions of P application through nozzles equipped with the transplanting machine. Schematic representation of depth and width of the soil sampling pit (b).
Methods of soil sampling
After rice harvest, soil samples were collected from the Ap horizon and the subsoil of the five paddy fields (HA-NT, HA-T, UM-T, KA-T and FU-T) as semi-micro thin nine layers of 0–1, 1–2, 2–3, 3–4, 4–6, 6–8, 8–10, 10–15 and 15–20 cm deep, 15 cm long along row and 8 cm wide for HA-NT, HA-T and UM-T and 5 cm wide for KA-T and FU-T (). Soil sampling was triplicated in HA-NT and HA-T and duplicated in UM-T, KA-T and FU-T with selecting positions without P fertilizer application as shown in . The positions of P application were faintly observable as 2–3 cm wide grooves on the soil surface even after harvest. Bulk soil samples for soil physical and chemical analyses were collected from the surface layer (0–10 cm) in the five paddy rice fields. The samples were air-dried and passed through a 2-mm mesh sieve.
Soil analysis
The pH of the bulk soils was determined using a glass electrode in water (soil : water = 1:2.5). Acid-oxalate extractable Al, Fe and Si (Alo, Feo and Sio) of the bulk soils were determined as described by CitationBlakemore et al. (1981). Pyrophosphate-extractable Al and Fe (Alp and Fep) of the bulk soils were determined as described by CitationWada and Higashi (1976). Phosphorus retention was determined using the method of CitationBlakemore et al. (1981). The total carbon (TC) and total nitrogen (TN) of soil samples were determined using an NC analyzer (Sumigraph NC-80, Sumitomo Chemical, Tokyo, Japan). The TP content was determined after hydrofluoric acid and perchloric acid digestion of the soil samples. The modified Bray II method (soil : solution = 1:20; shaking time 60s; CitationShoji et al. 1964) was used to determine labile P content. The OP content was determined using a modified method of CitationHedley (1982). To 1 g of soil in a plastic bottle, 60 mL of 1 mol L−1 ammonium chloride (NH4Cl) was added and shaken for 30 min at room temperature. The suspension was centrifuged at 900 g and the supernatant was discarded. Subsequently, 60 mL of 0.1 mol L−1 sodium hydroxide (NaOH) was added to the bottle. After shaking for an additional 16 h at 24°C, the suspension was centrifuged at 900 g and filtered with a filter paper (Advantec Toyo No.5C, Toyo Roshi Kaisha Ltd, Tokyo, Japan). To 10 mL of the filtrates in a bottle, 1 mL of 1 mol L−1 sulfuric acid (H2SO4) and two drops of concentrated H2SO4 were added, shaken and allowed to stand for 30 min at room temperature. Then, to the filtrates, a spoon of active carbon was added, shaken and filtrated to determine extractable inorganic P (Pi). Forty milliliters of the remaining filtrates was digested with HNO3–HClO4 for the determination of the amount of total extractable P (Pt). The amount of OP was calculated by subtracting the amount of Pi from that of Pt. In this study, P was determined colorimetrically using the molybdate-ascorbic acid procedure of CitationMurphy and Riley (1962). All chemical analyses were performed in duplicate.
RESULTS AND DISCUSSION
Soil properties
Soil properties of the bulk soils (0–10 cm) in five paddy fields after harvest are shown in . The pH (H2O) values of air-dried bulk soils of UM-T, KA-T and FU-T were 5.6–6.1, within the range of pH (H2O) for ordinary paddy soils. The pH (H2O) values of HA-NT and HA-T were higher than 7, reflecting the influence of fossil shells included in these soils, which are in polder-land. The field textures of the five soils were CL-HC. The Alo content was high in UM-T and KA-T, which are Andosols, and low in HA-NT, HA-T and FU-T. The Feo content was high in UM-T and was similar in HA-NT, HA-T, KA-T and FU-T. The Sio was high in UM-T, which is characteristic of an allophanic Andosol. In Andosols, the Alp/Alo ratio was low in UM-T and high in KA-T, which reflects the allophanic or non-allophanic colloidal composition of these Andosols, respectively. Phosphorus retention was high in UM-T and KA-T and low in HA-NT, HA-T and FU-T.
Vertical distribution of TC and TN in the Ap horizon of the paddy rice fields
In all five soils, TC and TN contents tended to be high in the surface layer (0–1 cm) (,), particularly conspicuous in HA-NT, HA-T and UM-T, although their deviation was also high in the surface layer. These results were compatible with those reported by CitationInubushi (1984) and CitationYasuda et al. (2000), suggesting the high activities of nitrogen fixing bacteria and other organisms in the surface soils. It is highly probable that chemical forms of P are also affected by these biological activities.
Table 2 Soil properties of Ap horizon (0–10 cm) in paddy fields after harvest
Figure 2 Vertical distribution of total carbon (C) in soils which were sampled from the five paddy rice fields as semi-micro thin layers of 0–1, 1–2, 2–3, 3–4, 4–6, 6–8, 8–10, 10–15 and 15–20 cm from the soil surface. (a) No-tillage Hachirougata soil (HA-NT), conventional-tillage Hachirougata soil (HA-T). (b) Conventional-tillage Utsunomiya soil (UM-T), conventional-tillage Kawatabi soil (KA-T), conventional-tillage Furukawa soil (FU-T). Error bars show standard deviation (a: n= 3; b: n= 2).
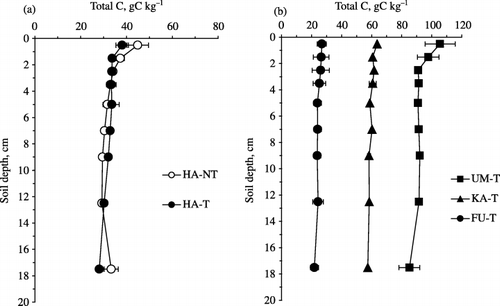
Figure 3 Vertical distribution of total nitrogen (N) in soils which were sampled from the five paddy rice fields as semi-micro thin layers of 0–1, 1–2, 2–3, 3–4, 4–6, 6–8, 8–10, 10–15 and 15–20 cm from the soil surface. (a) No-tillage Hachirougata soil (HA-NT), conventional-tillage Hachirougata soil (HA-T). (b) Conventional-tillage Utsunomiya soil (UM-T), conventional-tillage Kawatabi soil (KA-T), conventional-tillage Furukawa soil (FU-T). Error bars show standard deviation (a: n= 3; b: n= 2).
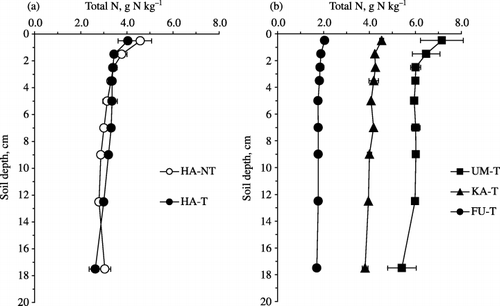
Figure 4 Vertical distribution of total phosphorus (P) in soils which were sampled from the five paddy rice fields as semi-micro thin layers of 0–1, 1–2, 2–3, 3–4, 4–6, 6–8, 8–10, 10–15 and 15–20 cm from the soil surface. (a) No-tillage Hachirougata soil (HA-NT), conventional-tillage Hachirougata (HA-T). (b) Conventional-tillage Utsunomiya soil (UM-T), conventional-tillage Kawatabi soil (KA-T), conventional-tillage Furukawa soil (FU-T). Error bars show standard deviation (a: n= 3; b: n= 2).
Vertical distribution of TP and Bray II P in the Ap horizon of the paddy rice fields
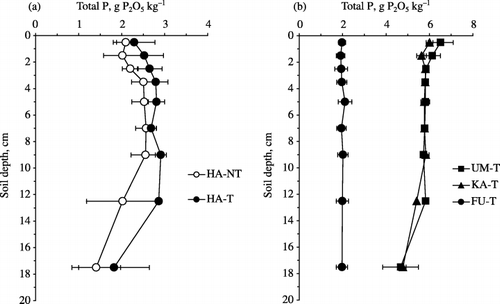
The TP contents of UM-T and KA-T, which are Andosols, were two or threefold that of the other three samples (). In Andosols, TP content of their parent material (volcanic ash) is mostly higher than unconsolidated sediments, the parent materials of HA-NT, HA-T and FU-T. In addition, a large quantity of P fertilizer is applied to Andosols to amend available-P deficiency. Examining the vertical distribution, TP of HA-NT and HA-T was low in the 0–3 cm layers () whereas the vertical distribution of TP in FU-T was homogeneous. Further study is necessary to find the reason for the low TP in the 0–3 cm of HA-NT and HA-T.
Bray II P content of HA-NT and HA-T also tended to decrease in the 0–3 cm layers from the soil surface (). To examine these vertical distributions in detail, the ratios of the minimum value/maximum value within the depth of 10 cm were calculated for Bray II P and TP. The ratios for TP (0–1 cm) of HA-NT and HA-T were 0.79 and 0.79, respectively, whereas those for Bray II P (0–1 cm) of HA-NT and HA-T were 0.45 and 0.61, respectively. Thus, the decrease in Bray II P in the surface (0–1 cm) was more marked than that for TP. In addition, in FU-T the Bray II P content decreased in the surface layer (). Although the TP content was high in UM-T, its Bray II P content was very low, and the vertical distribution was homogeneous (). The TP content of KA-T was on the same level with UM-T, but its Bray II P content was more than 10-fold that of UM-T. As
Figure 5 Vertical distribution of Bray II P in soils which were sampled from the five paddy rice fields as semi-micro thin layers of 0–1, 1–2, 2–3, 3–4, 4–6, 6–8, 8–10, 10–15 and 15–20 cm from the soil surface. (a) No-tillage Hachirougata soil (HA-NT), conventional-tillage Hachirougata soil (HA-T). (b) Conventional-tillage Utsunomiya soil (UM-T), conventional-tillage Kawatabi soil (KA-T), conventional-tillage Furukawa soil (FU-T). Error bars show standard deviation (a: n= 3; b: n= 2).
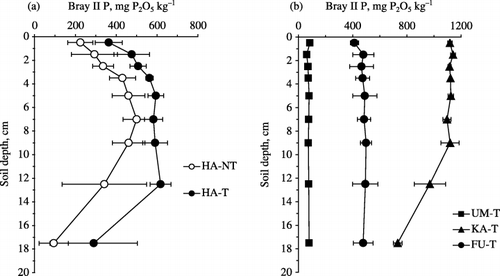
Table 3 Ratios of Bray II P and Organic P to total P in the five paddy soils
Vertical distribution of OP in the Ap horizon of the paddy rice fields
The OP contents were high in the surface layer (0–1 cm) of HA-NT and HA-T (). The OP contents of 0–1 cm of HA-NT and HA-T were 418 and 326 mg kg−1, respectively, and were 1.9 and 1.5-fold the average OP content of 1–10 cm in the Ap horizons, respectively. These vertical distributions are opposite to those for Bray II P, which decreased at the surface layer (). Conversion of the available P to organic forms by biological activities in the upper most surface layers of HA-NT and HA-T was suggested because the vertical distribution of OP resembled the distribution of TC and TN. The OP of FU-T showed a similar vertical distribution to HA-T (). The OP contents of UM-T and KA-T were in the range 1390–1980 mg kg−1, much higher than those of lowland soils, showing similar vertical distribution to TC and TN contents that are in an almost straight line in the Ap horizons with a very small increase in the top layers ().
Relationship between the ratios of Bray II P/TP and OP/TP in the paddy rice fields
Although the partial conversion of available P to OP in the surface layers was suggested, a comparison between these was not clear because the TP content also fluctuated in the surface layers. Hence, the percentages of Bray II P to TP and of OP to TP were used to cancel the fluctuation of TP with depth. Bray II P percentage of the four soils, except UM-T, was approximately 20% in the 3–10 cm layers of the Ap horizon (). The very small Bray II P percentage of UM-T is because of its very high Alo content. The Bray II P percentage of HA-NT, HA-T and FU-T tended to decrease toward the soil surface. Bray II P percentage of 0–1 cm of HA-NT was 11%, which is
Figure 6 Vertical distribution of organic phosphorus (P) in soils which were sampled from the five paddy rice fields as semi-micro thin layers of 0–1, 1–2, 2–3, 3–4, 4–6, 6–8, 8–10, 10–15 and 15–20 cm from the soil surface. (a) No-tillage Hachirougata soil (HA-NT), conventional-tillage Hachirougata soil (HA-T). (b) Conventional-tillage Utsunomiya soil (UM-T), conventional-tillage Kawatabi soil (KA-T). (c) Conventional-tillage Furukawa soil (FU-T). Error bars show standard deviation (a: n= 3; b: n= 2; c: n= 2).
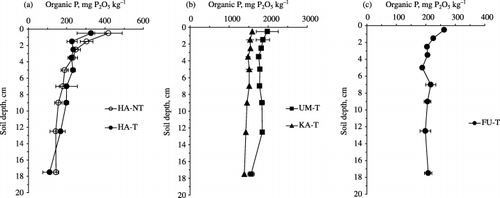
In contrast to Bray II P, the OP percentage of HA-NT, HA-T and FU-T tended to increase toward the soil surface. The OP percentage of the 3–10 cm layers was approximately 10% in HA-NT, HA-T and FU-T (). As the OP percentage of HA-NT at the 0–1 cm layer was 20%, it was almost double the OP percentage of the 3–10 cm layers. The increase in OP percentage in the 0–1 cm layer of HA-T and FU-T was seven and three points, respectively. Each increase in OP in the 0–1 cm was roughly comparable with the decrease in Bray II P. The OP content changed little with depth in UM-T and KA-T as well as Bray II P (). As both TP and OP of the two Andosols were much higher than those of the lowland soils, a change in OP with depth might have been masked. Regarding Bray II P of the two Andosols, very high values were obtained for KA-T because of high P fertilizer application and very low values for UM-T because of inadequate P extractability. Accordingly, even using Bray II P/TP values for the two Andosols, the change with depth in the upper part was not clear enough.
Thus, it is highly probable that a part of available P is converted to OP even during one rice-growing season possibly because of biological activities (CitationLee et al. 2004). The effect of biological activity appears cumulative in the no-tillage paddy soils (HA-NT) as indicated in the intensive changes in chemical forms of P in the surface layers. These findings will add a new dimension to P behavior in submerged rice soils under field conditions, particularly near the soil surface. Previous understanding was that P is simply enriched in the thin and oxidized surface layer by the diffusion of P from the underlying reduced layer of the submerged soil under laboratory conditions (CitationFurukawa 1984).
The influence of microbial activities in the surface of paddy fields should be considered when collecting soil samples from the Ap horizon in paddy fields for soil P tests. The soil sample should represent the whole Ap horizon of a paddy field. Further, it is necessary to investigate the intensity and the generality of the phenomenon that P (Bray II P) is converted to OP in the surface of paddy fields and to evaluate a P cycle including mineralization and immobilization of P in relation to P utilization by paddy rice plants.
ACKNOWLEDGMENTS
We thank Mr N. Hoshi, Furukawa Agricultural Experiment Station and Dr T Maeda, Utsunomiya University Farm, for supplying the soil samples and for their valuable suggestions.
REFERENCES
- Saito , M and Kawaguchi , K . 1971 . Flocculating tendency of paddy soils (Part 4). Soil structure of paddy plow-layers . JpnJSoil SciPlant Nutr , 42 : 95 – 96 . (in Japanese)
- Akahane , I , Nanzyo , M , Takahashi , T , Sekiguchi , O and Saigusa , M . 2006 . Special distribution of phosphorus in the Ap horizon soils of paddy rice fields after harvest. Effect of machinery localized fertilizer application at transplanting of rice seeding . JpnJSoil SciPlant Nutr , 77 : 171 – 177 . (in Japanese with English summary)
- Inubushi , K . 1984 . Easily decomposable organic nitrogen in paddy soils . Soil Microorganisms , 26 : 31 – 39 . (in Japanese with English summary)
- Yasuda , M , Okada , T and Nozoe , T . 2000 . “ Characteristics of nitrogen enrichment by biological nitrogen fixation (BNF) on different management of paddy soils in the d1istrict of Japan ” . In JpnJSoil SciPlant Nutr Vol. 71 , 849 – 856 . (in Japanese with English summary)
- Turner , BL and Haygarth , PM . 2001 . Phosphorus solubilization in rewetted soils . Nature , 411 : 258
- Kyuma , K . 2004a . “ Chemical and biological changes of paddy soils in the annual cycle of submergence and drainage ” . In Paddy Soil Science , Edited by: Kyuma , K. 36 – 59 . Kyoto : Kyoto University Press .
- Takai , Y and Uehara , Y . 1973 . Nitrification and denitrication in the surface layer of submerged soil (Part 1). Oxidation–reduction condition, nitrogen transformation and bacterial flora in the surface and deeper layers of submerged soils . JpnJSoil SciPlant Nutr , 44 : 463 – 470 .
- Kyuma , K . 2004b . “ Fertility considerations for paddy soils (II) – Phosphorus and other nutrients ” . In Paddy Soil Science , Edited by: Kyuma , K. 169 – 203 . Kyoto : Kyoto University Press .
- Furukawa , H . 1984 . “ Phosphate dynamics in paddy soils – An approach by laboratory experiments ” . In The Paddy Soils and Phosphorus , Edited by: Japanese Society of Soil Science and Plant Nutrition . 5 – 58 . Tokyo : Hakuyusha . (in Japanese)
- Sasaki , K , Noriki , S and Tsunogai , S . 2001 . Vertical distributions of interstitial phosphate and fluoride in anoxic sediment: Insight into the formation of an authigenin fluoro-phosphorus compound . GeochemJ , 35 : 295 – 306 .
- Fujii , H , Kominami , C and Ando , H . 2000 . “ Mineralization pattern of soil organic nitrogen – A case study of continued non-tillage paddy soil ” . In JpnJSoil Sci Plant Nutr Vol. 71 , 243 – 245 . (in Japanese)
- Ito , T . 2002 . “ Soil and plant nutrition science now developed from field study – Acquisition and analysis of data from the new view point – 6. Influence of no-tillage on soil properties and crop growth ” . In JpnJSoil SciPlant Nutr Vol. 73 , 193 – 201 . (in Japanese)
- Kaneta , Y , Tsutiya , K and Murai , Y . 1995 . Soil management of heavy subsoil for the rotational use of paddy fields. 6. Influence of the continued non-tillage cultivation on soil chemical properties . Tohoku AgricRes , 48 : 101 – 102 . (in Japanese)
- Ishibashi , E , Akai , N , Yamamoto , S , Ishii , T and Oki , K . 2001 . “ The characteristics and productivity of the non-tilled direct seeding soil ” . In JpnJSoil SciPlant Nutr Vol. 72 , 807 – 811 . (in Japanese)
- Kaneta , Y , Awasaki , H and Murai , Y . 1994 . “ The non-tillage rice culture by single application of fertilizer in a nursery box with controlled-release fertilizer ” . In JpnJSoil Sci Plant Nutr Vol. 65 , 385 – 391 . (in Japanese with English summary)
- Takahashi , Y . 1993 . “ Uptake ratio of paste fertilizer-N by side dressing and specificity of N-absorption on the non-tilled transplanting culture of paddy rice plant ” . In JpnJSoil SciPlant Nutr Vol. 64 , 681 – 684 . (in Japanese)
- Blakemore , LC , Searle , PL and Daly , BK . 1981 . “ A. Methods for Chemical Analysis of Soils ” . New Zealand Soil Bureau Scientific Report 10A Department of Scientific and Industrial ResearchNew Zealand .
- Wada , K and Higashi , T . 1976 . The categories of aluminium and iron-humus complexes in Ando soils determined by selective dissolution . JSoil Sci , 27 : 357 – 368 .
- Shoji , S , Miyake , M and Takeuchi , Y . 1964 . Comparison of methods of available soil phosphorus determination. II. Correlation between soil tests and “A” values . BullHokkaido NatAgricExpSta , 84 : 32 – 39 . (in Japanese with English summary)
- Hedley , MJ , Stewart , JWB and Chauhan , BS . 1982 . “ Changes in inorganic and organic soil phosphorus fractions induced by cultivation practices and by laboratory incubations ” . In Soil Sci SocAmJ Vol. 46 , 970 – 976 .
- Murphy , J and Riley , JP . 1962 . A modified single solution method for the determination of phosphorus in natural waters . AnalChemActa , 27 : 31 – 36 .
- Lee , CH , Lee , IB and Kim , PL . 2004 . “ Effect of long-term fertilization on organic phosphorus fraction in paddy soil ” . In Soil SciPlant Nutr Vol. 50 , 485 – 491 .
- Classification Committee of Cultivated Soils . 1996 . Classification of Cultivated Soils in Japan, 3rd approximation , Edited by: Classification Committee of Cultivated Soils . Tsukuba : National Institute of Agro-Environmental Sciences .
- Furukawa , H . 1978 . “ Transformation of phosphorus and its mobility under submerged condition ” . In Paddy Soil Science , Edited by: Kawaguchi , K . 264 – 274 . Tokyo : Kodansya . (in Japanese)