Abstract
The practice of monoculture land use without regard for local environmental conditions can accelerate organic matter decomposition. In the agriculturally and environmentally important soils of northern Kazakhstan, which primarily support cereal cultivation, economic rewards might encourage such monoculture practices. The purpose of this study was to clarify the influence of land use on the dynamics of soil organic carbon in situ for the three different soil classes, Dark Chestnut (DC), Southern Chernozem (SC) and Ordinary Chernozem (OC), in this region. Fluctuations in CO2 emission from the soils showed a similar pattern to temperature fluctuations. Land use markedly influenced the seasonal variation of CO2 emission, in particular fluctuations in CO2 sensitivity to soil temperature. To estimate daily CO2 emission, a prediction equation of CO2 emission using stepwise multiple regression of the Arrehenius model was derived from environmental soil factors by soil type and land use type. Using soil environmental factors, 40–80% of the variation in CO2 emission could be estimated. For cereal fields, the mean annual CO2 emission was estimated to range from 0.75 (DC) to 1.14 (SC) Mg C ha−1, and carbon input as plant residues ranged from 0.75 (DC) to 1.82 (SC) Mg C ha−1. The annual carbon budget ranged from 0.10 to 0.35 Mg C ha−1. In contrast, the carbon budget of summer fallow fields was approximately −0.8 Mg C ha−1. Thus, the carbon budget of the typical 4-year crop rotation system was estimated to range from −0.42 (DC) to 0.25 (OC) Mg C ha−1. It should be noted that carbon budgets were negative at DC and SC sites. Although the carbon budget of meadow fields ranged from 0.81 to 1.26 Mg C ha−1, meadow management at all sites contributed to carbon sequestration. Therefore, to prevent depletion of soil organic carbon in northern Kazakhstan, we recommend that meadow management be introduced as part of the crop rotation system, especially at SC and DC sites.
INTRODUCTION
Land degradation poses serious economic, social and environmental problems for the transition economies of the Central Asian countries of Kazakhstan, Kyrgyzstan, Tajikistan, Turkmenistan and Uzbekistan (CACs). It directly affects the livelihood of the rural population by reducing the productivity of land resources and adversely affecting the stability, functions and services derived from natural systems (CitationAsian Development Bank 2004). The loss of soil organic carbon (SOC) is accentuated by deforestation, land-use conversion, attendant soil degradation and desertification, all of which are severe problems in the CACs (CitationLal 2004). In Kazakhstan, CitationMcNab (1997) reported that summer fallowing caused rapid mineralization of soil organic matter. Plowing and excessive tillage is one of the major culprits exacerbating the problem of soil degradation and reduces the SOC pool (CitationLal 2004).
Kazakhstan accounts for approximately 90% of the total cereal production area in the CACs (CitationInternational Maize and Wheat Improvement Center (CYMMIT) 2000), making it one of the most important regions for global food production. Northern Kazakhstan alone produces 70% of the national cereal production (CitationNobe 1998). This area is covered with fertile Chernozem soils (CitationMain management of geoolesy and cartography, USSR (GUGK) 1982) and these soils are also considered to store a substantial amount of organic carbon, functioning as a huge source and sink of carbon dioxide (CO2). The Chernozem soils in northern Kazakhstan are, therefore, a vital resource from both agricultural and environmental viewpoints.
Although the Chernozem soils in northern Kazakhstan are fertile, climatic conditions are severe, with an annual precipitation of approximately 300 mm. Such low precipitation represents a major abiotic stress (CitationMorgounov et al. 2001) and water management is a major concern for sustainable production. The summer fallow are used for conventional water management practices, which are usually rotated over a 4-year timeframe, to retain moisture in soils, decrease weed hazard and accumulate mineral nitrogen through mineralization of soil organic matter. Fields under fallow are usually mechanically harrowed several times to keep the land bare and to minimize evapotranspiration during the cropping season (CitationShegebaev 1998). Unfortunately, such agricultural practice accelerates organic matter decomposition in Chernozem soils (CitationBuyanovsky et al. 1987; CitationKarbozova-Saljnikov et al. 2004; CitationMikhailova et al. 2000; CitationSrivastava and Meyer 1998). CitationFunakawa et al. (2004a) found that the cereal farming system used in northern Kazakhstan resulted in the loss of approximately 2.9 Mg C ha−1 from surface soil during periods of fallow, and concluded that fallow is disadvantageous in terms of SOC budget.
In northern Kazakhstan, three types of Chernozem soils are present: Dark Chestnut (DC; Typic Haplustolls), Southern Chernozem (SC; Typic Haplustolls) and Ordinary Chernozem (OC; Pachic Haplustolls). The main difference between DC and SC is soil color, which is related to the soil organic matter content. In general, DC has a lower organic matter content than SC. The characteristics of soils in the steppe region of northern Kazakhstan were reported by CitationFunakawa and Kosaki (2005). Farmers apply a 4-year or 5-year crop rotation system, comprising summer fallow and 3 years or 4 years of continuous cereal cultivation. From an economic viewpoint, some farmers may consider applying a 3-year crop rotation system, including fallow, without concern for the soil environment. To assist in the application of appropriate, environmentally friendly land-use planning in northern Kazakhstan, information about the SOC budget under cereal production in the three different soil ecosystems would be of considerable importance. To date, there is, however, little such information available for this region. Therefore, the objective of this study was to clarify the influence of land use on the dynamics of soil organic carbon in situ for the three different soil classes in northern Kazakhstan.
MATERIALS AND METHODS
Description of study region
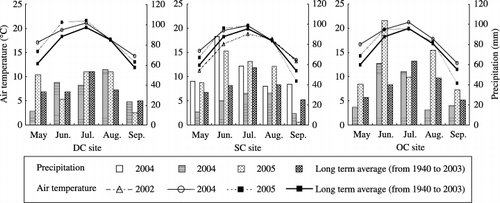
The study was conducted in the Tselinogratsukaya district (51°12′N 71°06′E) east of Astana, in the Shortandy district (51°40′N 71°02′E) 60 km north of Astana, and in the Reonidovka district (53°57′N 69°32′E) 300 km north of Astana, serving as representative soil sites of DC, SC and OC, respectively. The climate of Astana is drier than that of the upper north. In the Reonidovka district, the soil color becomes progressively darker, presumably because of decreasing evapotranspiration. Monthly climatic data for the three sites during the cropping season (May–September) for the years 2002, 2004 and 2005 are shown in . Monthly mean air temperature reached a maximum in July, and was higher at the DC site than at the OC site.
Soil and plant sampling
In September 2003, surface soil samples were taken from 10 cereal fields and two meadow fields at both the OC and DC sites. In addition, in May 2005, surface soil samples were collected from eight and one cereal field(s) adjacent to the 2003 sampling fields at the DC and OC sites, respectively. Sampling distance was within 3 km. At the SC site, soil sampling was conducted in May 2001 (10 cereal fields and two meadow fields), May 2003 (same fields as in 2001) and May 2005 (12 cereal fields and two meadow fields). All plots were situated within a diameter of 50 km. In addition, the meadow fields contained Agropyron cristatum, which is not for grazing, and there is only one harvest in June.
Plant sampling was carried out in 2002, 2004 and 2005 at the soil sampling plots. From each cereal plot, above and below ground plants were harvested from 1 m × 0.5 m quadrats, and the above-ground biomass was threshed. In the meadow plots, above and below ground biomass was sampled in triplicate from 35 cm × 35 cm quadrats (15 cm depth) twice a year (in 2004 and 2005) in May and August. Experimental fallow fields were established at each site in 2004 and tilled by hand three times (in June, July and August). Before each tillage, plant biomass was sampled in triplicate from 50 cm × 50 cm quadrats. Total carbon content of crop residue and of weed samples collected from cereal, meadow and fallow fields was determined using the dry-combustion method (Elementar VarioMax NC analyzer Hanau, Germany). In meadow fields, input carbon content was calculated as follows:
Figure 1 Climatic condition at each site during CO2 emission monitoring period.
In situ CO2 emission monitoring
The CO2 emission was measured during the cropping season (May–September) 2002 (SC site only), 2004 and 2005. Chemical fertilizer was not applied to any of the cereal or fallow plots. An alkaline absorption method was used to determine CO2 emission. Chambers were installed at the soil surface and CO2 respired in 24 h was titrated with 0.1 mol L−1 HCl. A root-impermeable mesh was buried at a depth of 15 cm to avoid the influence of root respiration. During the investigation period, respired CO2 was measured approximately twice per month. At the time of measurement, maximum and minimum temperature at 5 cm depth was recorded using a maximum–minimum thermometer (CT-410WR, CUSTOM, Tokyo) installed at each site. In addition, volumetric water content (%) at 0–15 cm depth was recorded using a soil moisture sensor (Hydro Sense, Campbell Scientific, Queensland, Australia).
Climate monitoring and dryness factor
Air temperature, soil temperature (5 cm and 15 cm depths), soil moisture (0–15 cm) and precipitation were monitored in 2002 (SC site), 2004 (OC and SC sites) and 2005 (OC, SC and DC sites) using a micro logger (Campbell Scientific) at 30 min intervals during the cropping season. We introduced a dryness factor, derived from potential evapotranspiration (PET) and precipitation because of the economic difficulties involved in monitoring soil water content daily at each site. Daily PET was estimated using the Hargreaves–Samani equation (CitationHargreaves and Samani 1982; CitationHargreaves et al. 1985) as follows:
ET0 is defined and calculated using the following equation:
Table 1 Potentially mineralizable organic carbon content and soil organic content at the CO2 monitoring plots
Calculation of the crop coefficient Kc followed the method recommended by the CitationFood and Agriculture Organization (1998). For cereal plots, length of the crop development stage was set at 120 days (seeding on 15 May). For KC, 0.3 and 1.0 were used for fallow and meadow plots, respectively. The daily dryness factor was computed by dividing precipitation by PET.
RESULTS AND DISUCUSSION
Climate and soil status at the CO2 emission monitoring sites
Monthly precipitation and mean air temperature during the crop growing season are shown in . Precipitation patterns show relatively high annual variability at the SC and OC sites. In 2004, there was a severe drought from May to July at the SC site and from August to September at the OC site. In contrast, in 2005 there was a wet period from May to August at the SC and OC sites. Only the DC site received normal precipitation in both years. Mean air temperature was slightly higher than usual in 2004 and 2005 at all sites. There was a new monthly precipitation record in June 2002 at the SC site.
The PMC and SOC at the CO2 monitoring plots are shown in . At all sites, PMC and SOC were higher in meadow plots than in the cereal or fallow plots, except for PMC at the OC site. It is well known that differences between PMC and SOC among land-use types are associated with long-term differences in substrate addition (CitationKarbozova-Saljnikov et al. 2004; CitationSchomberg and Jones 1999). In the cereal plots, PMC and SOC ranged from 1.64 (OC) to 2.80 (SC) Mg C ha−1 and 29.72 (SC) to 46.92 (OC) Mg C ha−1. Clay content was approximately 40% (CitationFunakawa and Kosaki 2005), and was the same level at all sites and for all land-use types.
Relationship between CO2 emission and climatic factors
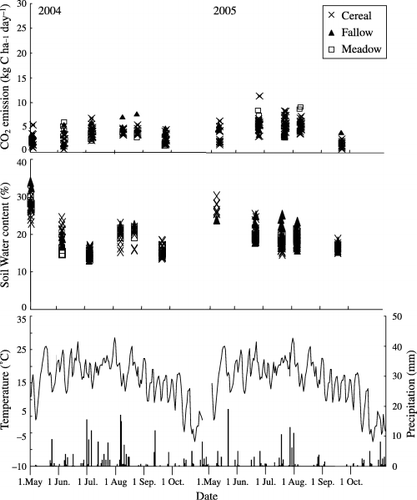
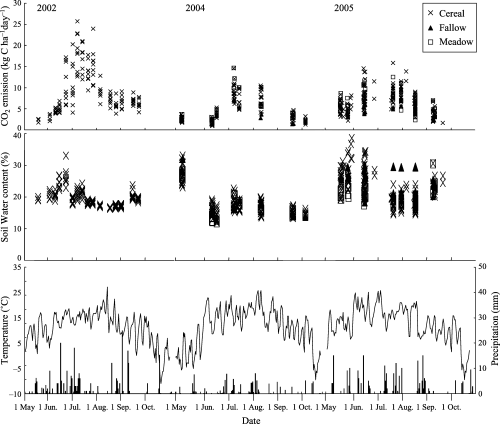
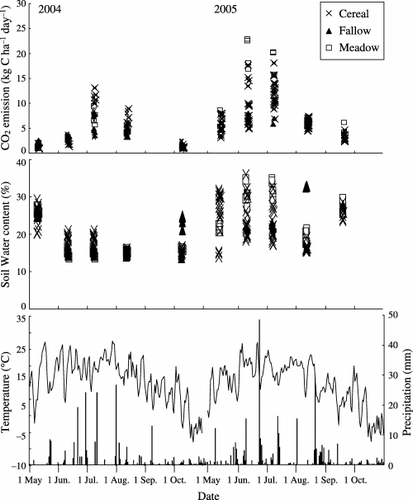
Daily CO2 emission, air temperature and precipitation during the cropping season are shown in , , . Fluctuations in CO2 emission from the soils showed a similar pattern for temperature, which reached a maximum value at each site in June or July, and started to fall in September. This corresponded with the results of CitationRochette et al. (1991) and CitationSingh and Shekhar (1986). CitationRochette et al. (1991) found maximum CO2 emission occurred in June, but maximum growth of the plant was also in June. In addition, CitationBuyanovsky et al. (1986) found in their investigation of carbon dynamics in winter wheat ecosystems that maximum CO2 emission coincided with maximum air and soil temperatures.
Precipitation also had a marked influence on soil water content and CO2 emission. For example, soil water content and CO2 emission in June 2004 was lower than that recorded in June 2005 at all sites. As there was a severe drought in June 2004, especially at the SC site, only small amounts of CO2 were emitted at that time. Despite air temperature being the same in 2004 and
Figure 2 Daily CO2 emission, soil water content, precipitation, daily mean air temperature and daily precipitation at DC site. Upper figure shows daily CO2 emission. Middle figure shows soil water content. Lower figure shows mean air temperature (solid line) and precipitation (rods).
Influence of land use on seasonal variation of CO2 emission
Land use markedly affected seasonal variation in the amount of CO2 emission. The influence of increased CO2 emission together with increased temperature was not so clear in meadow fields as in cereal and summer fallow fields during the drought period of 2004. In contrast, in June 2005, in the wet period, maximum CO2 emission was observed in meadow fields at the OC site. CitationTang et al. (2003) suggested that temperature sensitivity is relatively low in the dry season, and CitationXu and Qi (2001) showed that this sensitivity is correlated
Figure 3 Daily CO2 emission, soil water content, precipitation, daily mean air temperature, and daily precipitation at SC site. Upper figure shows daily CO2 emission. Middle figure shows soil water content. Lower figure shows mean air temperature (solid line) and precipitation (rods).
Prediction equations of CO2 emission
Stepwise multiple regression of the Arrehenius model was used to estimate daily CO2 emission using the following parameters: soil temperature, dryness factor, precipitation, PMC and SOC by soil type and by land-use type. To avoid multicollinearity, a precipitation or dryness factor was used in the regression analysis, and we used one, which had a high R2 value. The Arrehenius equation together with an extensive form of estimating CO2 emission can be stated as follows:
Figure 4 Daily CO2 emission, soil water content, precipitation, daily mean air temperature, and daily precipitation at OC site. Upper figure shows daily CO2 emission. Middle figure shows soil water content. Lower figure shows mean air temperature (solid line) and precipitation (rods).
The results are given in . Soil temperature showed a high and positive contribution in all nine equations, and a significant relationship at 1% level was obtained between the CO2 emission and the activation energy E, indicating a significant dependency of CO2 emission on soil temperature. Such dependency was also reported for Chernozem soil in northern Kazakhstan by CitationFunakawa et al. (2004a) and in Russia by CitationKudeyarov and Kurganova (1998). Based on the value of E, we estimated that Q10 values between 10 and 20°C ranged between 1.55 and 3.18. CitationRaich and Schlesinger (1992) reviewed soil respiration rates of various ecosystems and showed that Q10 varied from 1.3 to 3.3, with a mean value of 2.4. CitationFunakawa et al. (2004a) showed Q10 in cereal fields at an SC site ranged from 1.3 to 2.0. In the present study, Q10 values of fallow and meadow fields were higher at the OC site than at the DC site. CitationSchinner (1982) reported that higher Q10 values were observed at lower temperatures, a finding supported by the present results.
The cumulative precipitation or dryness factor also showed a positive contribution in all nine equations, and generally a significant 1% level was obtained. Precipitation was selected in cereal plots at all sites, and dryness factor was selected in DC and SC fallow plots and DC and OC meadow plots. There was a significant
Table 2 Coefficients determined by stepwise multiple regression analysis
Relationship between land use and determining factors of CO2 emission
The mean Q10 value of the three soil types for each land-use type was 1.78 for cereal, 2.04 for fallow and 2.62 for meadow. The mean Q10 value of fallow was higher than that of cereal, implying that tillage alters the decomposition environment by aerating the soil, breaking up soil aggregates, and incorporating weeds into the soil profile (CitationBeare et al. 1994; CitationFortin et al. 1996; CitationLee et al. 1996; CitationPrior et al. 1997; CitationSix et al. 2002). Meadow fields showed the highest Q10 value at each site, indicating that the sensitivity of CO2 fluctuation resulting from soil temperature was highest under a meadow management system. Precipitation factor was selected at all sites under the cereal cropping condition, whereas dryness factor tended to be selected for fallow and meadow fields. This result suggests that the sensitivity of fluctuation of CO2 is more strongly influenced by dryness in fallow and meadow fields than in cereal fields.
The contribution of soil organic matter was somewhat uncertain in fallow and meadow fields, where CO2 sampling plots were fewer than in the cereal plots. Prediction of the variance of CO2 emission using the parameter of soil organic matter may, thus, not have been possible because of the limited number of CO2 sampling datasets in fallow and meadow fields.
Annual carbon flow and carbon budget of crop rotation
To estimate annual CO2 emission, we used prediction equations and the climatic data from data loggers or the meteorological station closest to the CO2 measuring sites. Air temperature monitored by the meteorological observatory was calibrated to soil temperature at 5 cm depth at each site by a correlation analysis using monitored air temperature and soil temperature data from data loggers.
The annual carbon flow and carbon budget of the crop rotation system are summarized in . Annual CO2 emission is the summation of daily CO2 emission from 1 April to 31 October. Mean annual CO2 emission of cereal fields was estimated to range from 0.75 (DC) to 1.14 (SC) Mg C ha−1. This estimated value is the same level as that for the Canadian prairie (Citationde Jong 1974), while it was lower than the value recorded for Eurasian Chernozem (CitationLarionova et al. 1998; CitationVugakov and Popova 1968). According to other data obtained from agricultural experimental field stations at the SC site, approximately 2.5–3.2 Mg C ha−1 is respired annually (CitationFunakawa et al. 2004a). Comparatively, the present study showed that carbon was respired as low as approximately 1.01–1.14 Mg C ha−1 annually at the SC site. This discrepancy in findings could be because of Funakawa et al.'s (2004a) use of experimental fields that were managed intensively, using such methods as snow trap management, fertilization, herbicide application and subsoil cutting, all of which are believed to magnify the carbon dynamics by increasing carbon input as well as output. Snow management is a drifting-snow trap technology that makes parallel snow-rows at certain intervals, and
Table 3 Annual (from April to October) carbon flow and carbon budget of the crop rotation systems
Mean annual CO2 emission of fallow and meadow fields was estimated to range from 0.71 (DC) to 0.92 (SC) Mg C ha−1 and from 0.61 (DC) to 1.34 (OC) Mg C ha−1, respectively. Annual CO2 emission of cereal and meadow fields in 2005 was slightly higher than in 2004 at each site because precipitation in 2005 was higher than that in 2004, which greatly affected water availability for soil microbes.
Average carbon input as plant residues 2004–2005 in cereal fields ranged from 0.87 to 1.38 Mg C ha−1, with the highest value at the OC site, followed by the SC and the DC sites. In 2002, there was extremely high carbon input at the SC site. The high carbon input as plant residues in 2002 might have resulted from new a precipitation record in June at the SC site. Thus, the high carbon input at the SC site is highly unusual. The annual carbon budget was calculated by subtracting annual CO2 emission from carbon input as plant residues, and was found to vary between 0.00 and 0.77 Mg C ha−1 in cereal fields. It is noteworthy that cereal cropping fields at all sites contributed to carbon sequestration. Plant residue burning is an occasional practice in this study area, and it has agronomic advantages linked to soil management, such as the tillage. In addition, disease control effects, derived from residue burning, could be an agronomic advantage in this study area. However, the advantages of not burning, especially the long-term increase in soil organic matter and its impact on aggregation, have been reported in detail (CitationCrovetto 1996). Therefore, the profit of plant residues, such as carbon sequestration, should be paid more attention. The carbon budget of summer fallow fields, however, ranged from −0.69 to −0.90 Mg C ha−1. To obtain the representative carbon budget data, 2004 and 2005 data were used for calculating the average carbon budget at all sites. The carbon budget of a 3-year crop rotation system was estimated to range from −0.51 (DC) to −0.10 (OC) Mg C ha−1. It should be noted that the carbon budget was negative at all sites. This result indicates that a 3-year crop rotation system contributes to a marked decrease in soil organic carbon at all sites. The carbon budget of a 5-year crop rotation system, however, was estimated to range from −0.32 to 0.60 Mg C ha−1, with only the DC site contributing as a carbon source. In meadow fields, the 2004–2005 carbon budget ranged from 0.8 to 1.3 Mg C ha−1 and meadow management at all sites contributed to carbon sequestration.
To further reduce the loss of soil organic matter, extensive use of summer fallow should be reconsidered. CitationYanai et al. (2005) reported that spatial dependency of PMC and carbon input as plant residue were well developed in this region, and suggested that the spatial patterns of the soil organic matter dynamics under grain farming are markedly affected by the topography. CitationFunakawa et al. (2004b) recommended intensive snow management as an alternative approach for improving the soil moisture conditions at some topographical locations. Diversification of cropping systems is also important for eliminating summer fallow, especially legumes as pea and chickpea and/or oilseed as sunflower and mustard are alternative crops (CitationSulemenov et al. 2005). Given the findings of the present study, we recommend meadow management be introduced as a part of the crop rotation system, especially at DC sites and at some SC or OC sites depending on topographical locations. Obviously, as the most appropriate management would vary regionally depending on both environmental and socio-economic conditions (CitationPaustian et al. 1997), the nature of site-specific management should be carefully selected depending on local conditions. The general conclusion reached in the present study is that land use influences the dynamics of soil organic carbon because of temperature sensitivity of soil CO2 emission, precipitation or dryness factor sensitivity of intra-seasonal variation of CO2 emission, and carbon input as plant residue. These findings will support decision making for environmentally friendly land-use planning of cereal production in northern Kazakhstan.
ACKNOWLEDGMENTS
The authors thank Messrs Koishibai Erzhanov, Kairat Kuitenov, Ansagan Bolatbek and Daniel Shorppack for their collaboration during the field research, and Mrs Sholpan Akshalov for her constant assistance during our long-term stay in Shortandy, Kazakhstan.
Related Research Data
REFERENCES
- Asian Development Bank . 2004 . Project Development Facility Block B Proposal to the Global Environmental Facility for the Central Asian Countries Initiative for Land Management , Manila : Asian Development Bank .
- Emmerich , WE . 2003 . Carbon dioxide fluxes in a semi-arid environment with high carbonate soils . Agric. Forest Meteorol. , 116 : 91 – 102 .
- Lal , R . 2004 . Carbon sequestration in soils of central Asia . Land DegradDevelop , 15 : 563 – 572 .
- McNab , A . Continuous wheat grown under semi-arid conditions of northern Kazakhstan . InWheat Prospect for Global Improvement. Proc. Of the 5th International Wheat Conference . June 10–14 1996 , Ankara, Turkey.
- International Maize and Wheat Improvement Center (CIMMYT) . 2000 . World Wheat Overview and Outlook 2000–2001 , D.F. Mexico .
- Nobe , K . 1998 . The agriculture of Kazakhstan during shifting socio-economic systems . Nougyou Sougou Kenkyuu , 54 : 1 – 111 . (in Japanese)
- GUGK1982 Atlas Kazakhskoi SSR TOM1 Russia (in Russian)
- Morgounov , A , Karabayev , M Bedoshvili , D . 2001 . “ Improving wheat production in Central Asia and the Caucasus ” . In Research Highlights of the CYMMIT Wheat Program 1999–2000 , 65 – 68 . Mexico : CYMMT .
- Shegebaev , OS . Scientific support for spring wheat production in Kazakhstan . InSpring Wheat in Kazakstan: Current Status and Future Directions. Proc. of the Kazakstan-CIMMYT Conference . September 22–24 1997 , Shortandy, Akmola, Kazakstan. pp. 24 – 29 .
- Buyanovsky , GA , Kucera , CL and Wagner , GH . 1987 . Comparative analysis of carbon dynamics in native and cultivated ecosystems . Ecology , 68 : 2023 – 2031 .
- Karbozova-Saljnikov , E , Funakawa , S Akhmetov , K . 2004 . Soil organic matter status of Chernozem soil in North Kazakhstan: effects of summer fallow . Soil BiolBiochem , 36 : 1373 – 1381 .
- Mikhailova , EA , Bryant , RB Vaasenev , II . 2000 . Cultivation effects on soil organic carbon and nitrogen contents at depth in the Russian Chernozem . Soil SciSocAmJ , 64 : 738 – 745 .
- Srivastava , J and Meyer , E . 1998 . Is conservation tillage a viable option in the CIS? , New York : World Bank . World Bank Report
- Funakawa , S , Nakamura , I Akshalov , K . 2004a . Soil organic matter dynamics under grain farming in Northern Kazakhstan . Soil SciPlant Nutr , 50 : 1211 – 1218 .
- Funakawa , S and Kosaki , T . 2005 . Characteristics of soils in steppe region of northern Kazakhstan . Pedologist , 49 : 52 – 66 . (in Japanese)
- Hargreaves , GH and Samani , ZA . 1982 . Estimation potential evapotranspiration . JIrrigDrain Engr ASCE , 108 : 223 – 230 .
- Hargreaves , GL , Hargreaves , GH and Riley , JP . 1985 . Irrigation water requirements for Senegal River Basin . JIrrigDrainEng ASCE , 111 : 265 – 275 .
- Food and Agriculture Organization . 1998 . Crop Evapotranspiration for Computing Crop Water Requirement , Rome : Food and Agriculture Organization .
- Schomberg , HH and Jones , OR . 1999 . Carbon and nitrogen conservation in dryland tillage and cropping systems . Soil SciSocAmJ , 63 : 1359 – 1366 .
- Rochette , P , Desjardins , RL and Pattey , E . 1991 . Spatial and temporal variability of soil respiration in agricultural fields . CanJSoil Sci , 71 : 189 – 196 .
- Singh , KP and Shekhar , C . 1986 . Seasonal pattern of total soil respiration, its fractionation and soil carbon balance in a wheat-maize rotation cropland at Varanasi . Pedobiologia , 29 : 305 – 318 .
- Buyanovsky , GA , Wangner , GH and Gantzer , CH . 1986 . Soil respiration in a winter ecosystem . Soil SciSocAmJ , 50 : 338 – 344 .
- Orchard , VA and Cook , FJ . 1983 . Relationship between soil respiration and soil moisture . Soil BiolBiochem , 15 : 447 – 453 .
- Tang , J , Baldocchi , DD Qi , Y . 2003 . Assessing soil CO2efflux using continuous measurements of CO2profiles in soils with small solid-state sensors . AgriForest Meteor , 118 : 207 – 220 .
- Xu , M and Qi , Y . 2001 . Spatial and seasonal variations of Q10determined by soil respiration measurements at a Sierra Nevadan forest . GlobBiogeochemCycle , 15 : 687 – 696 .
- Kudeyarov , VN and Kurganova , IN . 1998 . Carbon dioxide emissions and net primary production of Russian terrestrial ecosystems . BiolFertilSoils , 27 : 246 – 250 .
- Raich , JW and Schlesinger , WH . 1992 . The global carbon dioxide flux in soil respiration and its relationship to vegetation and climate . Tellus , 44B : 81 – 99 .
- Schinner , F . 1982 . Soil microbial activities and litter decomposition related to altitude . Plant Soil , 65 : 87 – 94 .
- Davidson , EA , Verchot , LV Henrique Cattanio , J . 2000 . Effects of soil water content on soil respiration in forests and cattle pastures of eastern Amazonia . Biogeochemistry , 48 : 53 – 69 .
- Huxman , TE , Snyder , KA Tissue , D . 2004 . Precipitation pulses and carbon fluxes in semiarid and arid ecosystems . Oecologia , 141 : 317 – 324 .
- Kessavalou , A , Doran , JW Mosier , AR . 1998 . Greenhouse gas fluxes following tillage and wetting in a wheat-fallow cropping system . JEnvironQual , 27 : 1105 – 1116 .
- Schlentner , RE and Van Cleve , K . 1985 . Relationships between CO2evolution from soil, substrate temperature, and substrate moisture in four mature forest types in interior Alaska . CanJForest Res , 15 : 97 – 106 .
- Beare , MH , Hendrix , PF and Coleman , DC . 1994 . Water-stable aggregates and organic matter fractions in conventional and no-tillage soils . Soil SciSocAmJ , 58 : 777 – 786 .
- Fortin , MC , Rochette , P and Pattey , E . 1996 . Soil carbon dioxide fluxes from conventional and no-tillage small-grain cropping systems . Soil SciSocAmJ , 60 : 1541 – 1547 .
- Lee , WJ , Wood , CW Reeves , DW . 1996 . Interactive effects of wheel-traffic and tillage system on soil carbon and nitrogen . Comm Soil SciPlant Anal , 27 : 3027 – 3043 .
- Prior , SA , Rogers , HH Runion , GB . 1997 . Carbon dioxide-enriched agroecosystems: Influence of tillage on short-term soil carbon dioxide efflux . JEnvironQual , 26 : 244 – 252 .
- Six , J , Feller , C Denef , K . 2002 . Soil organic matter, biota and aggregation in temperate and tropical soils—Effects of no-tillage . Agronomie , 22 : 755 – 775 .
- de Jong . 1974 . Soil aeration as affected by slope position and vegetative cover . Soil Sci , 131 : 34 – 43 .
- Larionova , AA , Yermolayev , AM Blagodatsky , SA . 1998 . Soil respiration and carbon balance of gray forest soils as affected by land use . BiolFertilSoils , 27 : 251 – 257 .
- VugakovPS PopovaYEP1968 Carbon dioxide regime in soils of the Krasnoyarsk forest steppe SovSoil Sci 795801
- Crovetto , C . 1996 . Stubble Over the Soil: the Vital Role of Plant Residue and Soil Management to Improve Soil Quality , Madison : American Society of Agronomy .
- Yanai , J , Mishima , A Funakawa , S . 2005 . Spatial variability of organic matter dynamics in semi-arid croplands in northern Kazakhstan . Soil SciPlant Nutr , 51 : 261 – 269 .
- Funakawa , S , Nakamura , I Akshalov , K . 2004b . Water dynamics in soil–plant systems under grain farming in Northern Kazakhstan . Soil SciPlant Nutr , 50 : 1219 – 1227 .
- Suleimenov , M , Akshalov , KA Kaskarbayev , Z . 2005 . Role of wheat in diversified cropping systems in dryland agriculture of Central Asia . TurkJAgricFor , 29 : 143 – 150 .
- Paustian , K , Andren , O Janzen , HH . 1997 . Agricultural soils as a sink to mitigate CO2emissions . Soil Use Manage , 13 : 230 – 244 .