Abstract
In determining the soil and ecosystem carbon balance, it is necessary to distinguish between autotrophic respiration and heterotrophic respiration. We attempted to measure the contribution of CO2 emissions from plant roots (RRHI), from soil organic matter (RSOM), and from litter (RL) to CO2 emissions from the forest floor (soil respiration; RS) in a deciduous forest of oak (Quercus serrata Thunb.) and hornbeams (Carpinus laxiflora Sieb. et Zucc. Bl., Carpinus tschonoskii Maxim. and Carpinus japonica Bl.) on Andosols in Japan, using a 13C natural abundance technique. The 13C natural abundances of roots (δRHI), litter (δL) and SOM (δSOM) in the surface soil were −28.9, −30.1 and −24.3‰, respectively. This means that the differences between δSOM and δRHI are large enough to calculate the contributions of RRHI, RSOM and RL to RS based on the mass balance of the CO2 isotope ratios. RRHI and RSOM had close relationships with soil temperature, and RL was influenced by soil temperature and moisture. In summer, under high soil temperatures, RRHI and RSOM were the predominant sources of RS and the proportion of RRHI to RSOM to RL was 51:44:5. In winter, RL was predominant and the proportion of RRHI to RSOM to RL was 20:11:69. The estimated annual emissions of RRHI, RSOM and RL were 1.45, 2.10 and 1.30 Mg C ha−1, respectively; thus, the proportion of RRHI to RSOM to RL was 30:43:27 on a whole-year basis.
INTRODUCTION
In recent decades, in an attempt to determine the exact capacity of carbon fixation for forests, researchers have examined the carbon balance in forest ecosystems. Net ecosystem production (NEP), calculated as net primary production minus heterotrophic respiration, has been estimated in various forest ecosystems using ecological mass production methods and meteorological flux observations (CitationBaldocchi 2003; CitationDore et al. 2003; CitationFalge et al. 2002). A challenge in determining NEP is to estimate CO2 flux from belowground processes; this flux is composed of heterotrophic respiration from decomposing soil organic matter (SOM) and litter, and autotrophic respiration from plant roots in the soil (CitationRaich and Schlesinger 1992). Although separation of these respiration components is crucial for determining NEP, methodological difficulties have not been solved at this stage (CitationHanson et al. 2000).
Separation of heterotrophic respiration from autotrophic respiration has been carried out using various methods, such as the trenching method, the integrated method, and the isotope method (CitationHanson et al. 2000). Of these, the isotope method has the advantage of disturbing the field very little (CitationMeharg 1994). When the isotope ratio of the soil differs from that of the plant roots, the isotope method can be used to estimate the relative contributions of heterotrophic and autotrophic respiration to the total respiration by measuring the isotope ratio of soil CO2 or the isotope ratio of soil-respired CO2 (CitationAmundson et al. 1998; CitationHanson et al. 2000). The artificially controlled isotope method has been applied to some forest ecosystems on which free-air CO2 enrichment experiments have been carried out (CitationAndrews et al. 1999; CitationMatamala and Schlesinger 2000) and to pot experiments (CitationRobinson and Scrimgeour 1995). The 13C natural abundance method, which uses the difference in 13C ratio between growing plants and soil organic carbon, is simple and has been applied mainly to agricultural fields of C4 plants, such as maize, which have higher isotope ratios than those of their soils (CitationRochette and Flanagan 1997; CitationRochette et al. 1999). In forest ecosystems, however, the natural abundance method has not been used because the difference in stable carbon isotope ratios (13C/12C) between vegetation and SOM is usually less than 1‰ (CitationBoutton 1996) and the isotope ratio of CO2 emitted from soil respiration is nearly the same as that of CO2 emitted by vegetation (CitationCerling et al. 1991).
Recent reports (CitationIshizuka et al. 1999; CitationYoneyama et al. 2001) suggest that the SOM in Andosols (CitationFAO et al. 1998) and in Black soil groups (CitationForest Soil Division 1976) have higher carbon isotope ratios than those in Cambisols and Brown forest soil groups in Japan. Up to approximately half of the SOM in Andosols originated from Japanese pampas grass (Miscanthus sinensis Anderss.), which was a C4 plant that grew in the past (CitationHiradate et al. 2004; CitationIshizuka et al. 1999; CitationKawamuro and Torii 1986; CitationShindo et al. 1986). Based on this finding, we expect the difference in carbon isotope ratios between vegetation and SOM in Andosols to be large enough to measure using the 13C natural abundance technique. If this method proves successful, it will be possible to distinguish between autotrophic respiration and heterotrophic respiration in areas of Andosols without disturbing the site.
The objectives of the present study were to: (1) distinguish between autotrophic respiration and total soil respiration in forest ecosystems on Andosols by measuring the natural abundance of stable isotopes, (2) examine seasonal changes in the contributions of different CO2 sources (litter, roots and SOM) to soil respiration. We also discuss limitations in the application of this method.
MATERIALS AND METHODS
Study sites
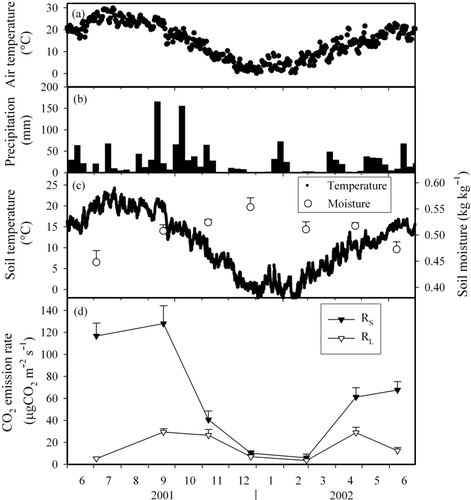
We established a study site in a deciduous broad-leaved forest in Sakuragawa City, Ibaraki Prefecture, central Japan (36°19′N, 140°9′E). The elevation of the site is 470 m. According to the meteorological station data at Kasama, which is located approximately 10 km northeast from the study site (Japan Meteorological Agency: http://www.data.kishou.go.jp), the mean annual temperature, maximum monthly temperature (August), and minimum monthly temperature (January) in the area are 13.1, 29.3 and −3.5°C, respectively. The average annual precipitation for the previous 20-year period is 1,330 mm, with high precipitation from April to October and low precipitation from November to March. shows seasonal fluctuation in the daily air temperature and the weekly precipitation. In winter, the maximum snow depth is approximately 10 cm and the maximum freezing depth of the soil is approximately 5 cm.
The site is a secondary deciduous broad-leaved forest, mainly consisting of oak (Quercus serrata Thunb.) and hornbeams (Carpinus laxiflora Sieb. et Zucc. Bl., Carpinus tschonoskii Maxim. and Carpinus japonica Bl.), with dwarf bamboo (Pleioblastus chino Franch. et Savat Makino) on the forest floor. In this area, Japanese cypress (Chamaecyparis obtusa Endl.), Japanese red pine (Pinus densiflora S. et Z.) and Japanese cedar (Cryptomeria japonica D. Don) were reforested after clear-cutting in 1969, but did not grow well. After this, broad-leaved trees came to dominate again. The average tree height of the dominant species, stem density and basal area are 8.9 m, 3,500 stems ha−1, and 15.6 m2 ha−1, respectively. The site is on a well-drained slope with an inclination of 15°. The soil type is light-colored Black soil (CitationForest Soil Division 1976) and Fulvic Andosols (CitationFood and Agriculture Organization et al. 1998). The soil has a loamy clay texture with little gravel and the A horizon extends to a depth of 20 cm.
Sampling methods
The CO2 emitted from the forest floor (soil respiration, RS) was measured using the static closed chamber method (CitationSakata et al. 2004). Three chambers (baseless stainless steel cylinders with an internal diameter of 40 cm and a height of 15 cm) were inserted into the forest floor to approximately 5 cm in depth. Three chambers were installed at the site. To measure soil respiration rate, 50 mL of gas in the chamber was sampled at 0, 10, 20 and 40 min after the chamber was sealed. The gas sample was captured in a vacuum vial that had been evacuated to less than 10 Pa. Vials were taken to the laboratory for analysis of CO2 concentration and stable isotope ratios. The gas was sampled approximately every 2 months from July 2001 to June 2002. After gas sampling, three surface soil (0–5 cm) samples were collected from near the chambers and the soil moister contents were calculated after drying the soil at 105°C for 24 h in the laboratory. The field soil temperature was measured every hour using a thermometer logger (Hioki, Model 3632, Japan) at 5 cm depth ().
The CO2 emission from litter (RL) was measured in the field at the same time as the soil respiration was measured. Litter was cut from three circles, each 30 cm in diameter, and transferred to a plastic cylindrical container (30 cm in diameter, 15 cm in height) with as little disturbance as possible. After the container was sealed, 40 mL of gas in the container was sampled after 0, 15 and 30 min. The gas samples were captured in a vacuum vial and taken to the laboratory for analysis.
Litter was cut from three squares, each 20 cm × 20 cm, and collected in July 2001 to measure its deposition mass. Litterfall was collected using five litter traps (42 cm × 30 cm) from September to November 2001, which is the defoliation period. Fine roots (diameter ≤ 2 mm) were collected from the A horizon (0–20 cm depth) in May (three replications) and November 2001 (ten replications) and washed to remove adhering soil. There were few fine roots in the litter layer. We did not separate live roots from dead roots. Dry weights of litter and fine roots were measured after oven-drying at 70°C for 48 h. Soil samples and soil cores (100 mL) were collected from the A horizon in May 2001, with three replications for each. The gas phase volume of the soil core was measured using a gas pycnometer (Daiki, DIK1121, Saitama, Japan). Then, the bulk density of the soil was calculated after drying the soil at 105°C for 24 h. The dried litter, fine root, and soil samples were ground in an agate mortar before analysis.
Gas and isotope analysis
The CO2 concentration was measured using a gas chromatograph (GC14B-TCD, Shimadzu, Kyoto, Japan) or an infrared gas analyzer (ZFP9, Fuji Electric, Tokyo, Japan). The stable carbon isotope ratio of the CO2 in the gas samples was analyzed using combustion gas chromatograph coupled isotope ratio mass spectrometry (HP6890-MAT252, Thermo Finnigan, Bremen, Germany). The isotope ratios of the litter, soil and fine roots were determined using automated nitrogen–carbon analysis mass spectrometry (NC2500-MAT252, Thermo Finnigan). Isotopic compositions are expressed using delta notation:
where δ13C is the stable isotope ratio in parts per thousand (‰), 13C/12Csample is 13C/12C for the sample, and 13C/12Cstandard is 13C/12C for the Pee Dee Belemnite (PDB).
Calculating respiration, emission and isotope ratios
The CO2 concentrations after 0, 10 and 20 min in the chamber were used to calculate the rates of soil respiration and the CO2 emission from litter by substituting those concentrations into the following equation (CitationHutchinson and Mosier 1981):
where RS (kg CO2 m−2 s−1) is the soil respiration rate, RL (kg CO2 m−2 s−1) is the CO2 emission rate from the litter, ρ (kg m−3) is the gas density (1.96 for CO2), V (m3) is the volume of the chamber, A (m2) is the area of the chamber's base, t (s) is the gas sampling interval (10 min in this case), Ci (kg m−3) is the CO2 concentration in the chamber at time i (min), and T (°C) is the air temperature.
The δ13C value of the CO2 emitted from the forest floor was calculated by substituting the CO2 concentrations and the δ13C values into the following mass balance expression:
where δRS (‰) is the δ13C value of the CO2 emitted from the forest floor and δC i (‰) is the δ13C value of the gas in the chamber at time i (min).
Soil respiration rate is the sum of the CO2 emission rates of roots, SOM and litter:
where RSOM and RRHI are the emission rates from SOM and roots, respectively.
Under normal conditions, such as when the soil is well aerated and in a steady state, the δ13C value of the soil-respired CO2 is approximately equal to that of the CO2 emitted from the source (CitationAmundson et al. 1998). Therefore, we can make the following mass balance equation for the CO2 isotope ratio:
where δRS, δRRHI, δRSOM and δRL (‰) are the δ13C values of CO2 emitted from the forest floor, roots, SOM and litter, respectively, and fRHI, fSOM and fL are the proportions of RRHI, RSOM and RL in RS, respectively.
Based on reports that the δ13C values of CO2 emitted from roots are nearly the same as those emitted from other plant organs (CitationAmundson et al. 1998; CitationCerling et al. 1991; CitationLin and Ehleringer 1997) and that isotope fractionation by soil microbial respiration is negligible (CitationBalesdent and Mariotti 1996; CitationBlair et al. 1985; CitationLin et al. 1999), we assumed that the δ13C values of CO2 emitted from the litter, roots and SOM were the same as the δ13C values of organic matter in their sources Under this assumption, EquationEq. 5 can be converted to EquationEq. 5′, and EquationEq. 6 and EquationEq. 5′ can then be transformed into EquationEq. 7 and EquationEq. 8:
Figure 1 Seasonal fluctuations in (a) air temperature, (b) precipitation, (c) soil temperature and soil moisture content at 5 cm depth and (d) CO2 emission rates from forest floor (RS) and litter (RL). Error bars represent the standard error.
It is noted that RRHI in the present study is actually composed of root respiration and heterotrophic respiration in the rhizosphere to some extent, because rhizosphere microbes metabolize root exudates and root deposits with quick turnover rates; metabolism that is difficult to distinguish from root respiration. Consequently, RSOM originates from SOM in the non-rhizosphere soil.
Calculated errors of contribution ratios of RRHI and RSOM
If we make the reasonable assumption that δRS, δRHI, δSOM and δL are independently measured, then a first-order Taylor series approximation of the variance of fRHI evaluated at δRS, δRHI, δSOM and δL can be calculated using partial derivatives (CitationTaylor, 1997):
which reduces to:
where σ2δRS, σ2δRHI, σ2δSOM and σ2δL (‰) represent variances of δRS, δRHI, δSOM and δL, respectively (i.e. the square of the standard errors [SE]: CitationPhillips and Gregg 2001). In the same way, the variance of fSOM can be calculated:
RESULTS
Masses and stable carbon isotope ratios of soil, litter and roots
In the A horizon at this site, the bulk density was 357 ± 19.3 kg m−3 and the gas phase was 0.48 ± 0.02 m3 m−3. The surface soil had relatively high permeability. The litter in July, 0.440 kg m−2 (), was almost the same as the litterfall that occurred in the defoliation period from September to November (0.422 ± 0.812 kg m−2). In the A horizon (0–20 cm) the total mass of fine roots (0–2 mm in diameter) was 0.306 kg m−2 in May and 0.247 kg m−2 in November (), which is not significantly different (t-test, P = 0.25). The δ13C values of plant roots (δRHI), litter (δL) and SOM (δSOM) were −30.1, −28.9 and −24.3‰, respectively. Thus, δSOM was higher than δRHI and δL, and the δ13C values of the litter were nearly equal to those of the plant roots.
Fluctuations in soil respiration and annual CO2 emission
The soil respiration rate (RS) showed seasonal fluctuations, large in summer and autumn (July and September) and small in winter (December and February) (). RS correlated exponentially with soil temperature:
where TS (°C) is the soil temperature at 5 cm depth. Seasonal changes in soil moisture and temperature had the opposite pattern, but RS was not significantly correlated
Table 1 Masses and stable carbon isotope ratios of soil, litter and roots
The annual RS was 1.78 kg CO2 m−2 (4.85 Mg C ha−1), which was estimated by summing up the hourly soil respiration calculated by inserting hourly soil temperature into EquationEq. 12 from July 2001 to June 2002. Although our observations were conducted over the course of only 1 year, this annual CO2 emission was comparable to previous reports from temperate forests in Japan (3.1–10.6 Mg C ha−1; CitationIshizuka et al. 2006) and to a worldwide review of temperate deciduous forests (3.0–14.1 Mg C ha−1; CitationHibbard et al. 2005).
Fluctuations in δ13C values and error analysis
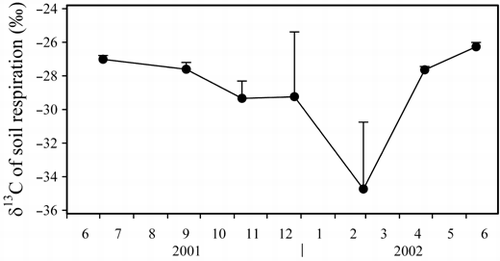
The δ13C values of soil respiration (δRS) also showed seasonal fluctuations (). The δRS values ranged from −34.7 to −26.2‰, but were lower than those of SOM (δSOM) and higher than those of plant roots (δRHI) and litter (δL) except in February (). This may be attributable to surface-soil freezing in December and snow coverage of the forest floor in February; it has been reported that during freezing and thawing periods the δ13C values of soil air change as a result of alterations to soil physical properties (CitationDudziak and Halas 1996).
The greater the difference between δRHI and δSOM, the smaller the errors of fRHI and fSOM (EquationEq. 10). We used a significance level of 5%; thus, the errors of δRS need to be 0.21‰ or smaller because the isotopic difference between δRHI and δSOM is 4.2‰ at this site. As the standard errors of δRS were 0.23–3.98‰ (), the relative errors of estimated ratios were 5–93%. The error of the δRS was large when soil respiration was small, for example, in winter.
Figure 2 Seasonal fluctuations in the carbon isotope ratio of CO2 emitted by soil respiration. Error bars represent the standard error.
Contribution of RRHI, RSOM and RL to RS
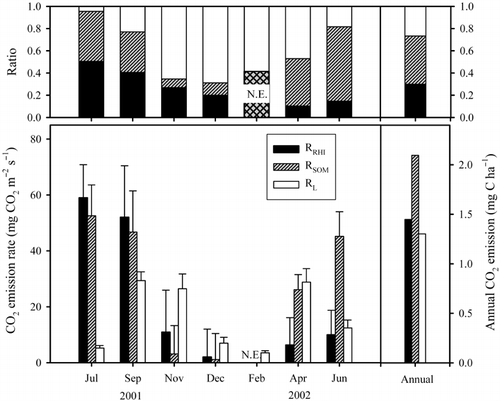
The ratios of RSOM to RS calculated using EquationEq. 7 and EquationEq. 8 tended to increase in summer and decrease in winter and ranged from 8 to 67% of RS (). Those of RRHI to RS showed a similar seasonal trend and ranged from 10 to 51%. RRHI and RSOM were exponentially correlated with soil temperature:
and the maximum values of RRHI and RSOM occurred in July; 59.0 and 52.6 µg CO2 m−2 s−1, respectively. Accordingly, in summer RRHI and RSOM were the predominant sources of RS, that is, the ratio of RRHI to RSOM to RL was 51:44:5 in July. The contribution ratios of RL to RS ranged from 5 to 69%; that ratio was at a maximum in December and a minimum in July (). Therefore, RL was predominant in winter and the ratio was 20:11:69 in December. The annual RRHI and RSOM were 0.53 and 0.77 kg CO2 m−2 (1.45 and 2.10 Mg C ha−1), respectively, which were estimated by summing up the hourly RRHI and RRHI calculated by inserting hourly soil temperature into EquationEq. 13 and EquationEq. 14 from July 2001 to June 2002. The annual RL was 0.48 kg CO2 m−2 (1.30 Mg C ha−1), which was estimated by the annual RS minus the annual RRHI minus the annual RSOM; thus, the contributions of RRHI, RSOM and RL were 30:43:27 on a whole-year basis.
DISCUSSION
As in many previous reports, the RRHI and the contribution of RRHI to RS were found to increase in summer (). For example, the contribution of RRHI increased from spring to summer in Japanese cedar forests (CitationLee et al. 2003; CitationOhashi et al. 2000), an oak forest (CitationTakahashi et al. 2002) and a boreal pine forest (CitationHogberg et al. 2001). This seasonal pattern may result from root phenology, such as a large mass of fine roots and high root respiration in summer. The mass of fine roots did tend to be larger in summer (July) than in winter (December) at our study site. Furthermore, the amount of roots produced in summer (June to September) was greater than that produced in other seasons as observed using the ingrowth coring method at this site (Mizoguchi T, 2002, pers. comm.).
We confirmed the annual contribution ratios of RRHI, RSOM and RL from the balance of carbon in the soil. The annual carbon emission from litter (RL) was 1.30 Mg C ha−1, which corresponded to 61% of the carbon in the litter in July. This value also corresponded to 64% for the leaf litterfall (2.05 Mg C ha−1) at the site. According to a review article (CitationPaul et al. 2002), the soil carbon content in various forests did not significantly change in the 30 years after trees were planted. If we assume that the carbon balance of the soil at this site is almost at equilibrium, then the turnover rate of roots can be calculated. When the annual carbon emission from the SOM is balanced with carbon supplied from roots and the litter layer to the soil, the annual deposition from roots can be explained by the annual RSOM (2.10 Mg C ha−1) plus RL minus leaf litterfall. Root deposition was found to be 1.35 Mg C ha−1 in this study. This deposition was almost equivalent to the fine root mass 1.07–1.33 Mg C ha−1 (0.247–0.306 kg m−2) in the surface soil. In other words, fine root turnover was estimated to be approximately 1 year, which is close to the values reported in previous studies (CitationChen et al. 2004; CitationGill and Jackson 2000; CitationMajdi et al. 2005; CitationMeharg 1994).
It is essential that there be a significant difference in 13C values between roots (δRHI) and SOM (δSOM) when applying the 13C natural abundance technique to
Figure 3 Seasonal fluctuations of CO2 emissions and the contribution ratios from roots (RRHI), soil organic matter (RSOM) and litter (RL). Error bars represent the standard error. N.E., values that were not able to be estimated.
We should consider the isotope fractionations of the CO2 emissions from SOM, roots and litter. If the isotope fractionations occurred, this isotope method would have larger estimated errors. Although there are some reports examining isotope fractionation (CitationAmundson et al. 1998; CitationBalesdent and Mariotti 1996; CitationBlair et al. 1985; CitationCerling et al. 1991; Lin and Ehleringer 1997; CitationLin et al. 1999), in general, the mechanisms of the isotopic fractionations during SOM decomposition and root respiration are not well understood. That isotopic fractionations during decomposition and root respiration even occur is currently under debate (CitationCrow et al. 2006; CitationFernandez et al. 2003; CitationKlumpp et al. 2005). In the future, to estimate more accurately the ratio of the CO2 emission from each source using this technique, we should not only measure the δRS more accurately, but also clarify the isotope fractionations.
ACKNOWLEDGMENTS
The authors wish to thank Drs N. Okada of Kyoto University and Y. Tsuboyama of the Forestry and Forest Products Research Institute for their help in the use and maintenance of the isotope analysis equipment. We appreciate being allowed to use the research site by the Ibaraki District Forest Office. This work was supported by research grant numbers 199903 and 200303 from the Forestry and Forest Products Research Institute, Japan.
Related Research Data
REFERENCES
- Baldocchi , DD . 2003 . Assessing the eddy covariance technique for evaluating carbon dioxide exchange rates of ecosystems: past, present and future . Global Change Biol , 9 : 479 – 492 .
- Dore , S , Hymus , GJ , Johnson , DP , Hinkle , CR , Valentini , R and Drake , BG . 2003 . Cross validation of open-top chamber and eddy covariance measurements of ecosystem CO2exchange in a Florida scrub-oak ecosystem . Global Change Biol , 9 : 84 – 95 .
- Falge , E , Baldocchi , D Tenhunen , J . 2002 . Seasonality of ecosystem respiration and gross primary production as derived from FLUXNET measurements . AgricForest Meteorol , 113 : 53 – 74 .
- Raich , JW and Schlesinger , WH . 1992 . The global carbon dioxide flux in soil respiration and its relationship to vegetation and climate . Tellus , 44B : 81 – 99 .
- Hanson , PJ , Edwards , NT , Garten , CT and Andrews , JA . 2000 . Separating root and soil microbial contributions to soil respiration: a review of methods and observations . Biogeochemistry , 45 : 115 – 146 .
- Meharg , AA . 1994 . A critical review of labeling techniques used to quantify rhizosphere carbon-flow . Plant Soil , 166 : 55 – 62 .
- Amundson , R , Stern , L , Baisden , T and Wang , Y . 1998 . The isotopic composition of soil and soil-respired CO2 . Geoderma , 82 : 83 – 114 .
- Andrews , JA , Harrison , KG , Matamala , R and Schlesinger , WH . 1999 . Separation of root respiration from total soil respiration using carbon-13 labeling during free-air carbon dioxide enrichment (FACE) . Soil SciSocAmJ , 63 : 1429 – 1435 .
- Matamala , R and Schlesinger , WH . 2000 . Effects of elevated atmospheric CO2on fine root production and activity in an intact temperate forest ecosystem . Global Change Biol , 6 : 967 – 979 .
- Robinson , D and Scrimgeour , CM . 1995 . The contribution of plant C to soil CO2measured using delta13C . Soil BiolBiochem. , 27 : 1653 – 1656 .
- Rochette , P and Flanagan , LB . 1997 . Quantifying rhizosphere respiration in a corn crop under field conditions . Soil SciSocAmJ , 61 : 466 – 474 .
- Rochette , P , Flanagan , LB and Gregorich , EG . 1999 . Separating soil respiration into plant and soil components using analyses of the natural abundance of Carbon-13 . Soil SciSocAmJ , 63 : 1207 – 1213 .
- Boutton , RS . 1996 . “ Stable carbon isotopic ratios of SOM and their use as indicators of vegetation and climate change ” . In Mass Spectrometry of Soil , Edited by: Boutton , TW and Yamasaki , S . 47 – 82 . New York : Marcel Dekker .
- Cerling , TE , Solomon , DK , Quade , J and Bowman , JR . 1991 . On the isotopic composition of carbon in soil carbon dioxide . Geochim. Cosmochim. Acta , 55 : 3404 – 3405 .
- Ishizuka , S , Kawamuro , K and Minami , H . 1999 . [Contribution of past C4 plants estimated from δ13C values of SOM to the black soil genesis in Hakkoda Mountain, northeast Japan.] . Quaternary Res , 38 : 85 – 92 . (in Japanese with English summary)
- Yoneyama , T , Nakanishi , Y , Morita , A and Liyange , BC . 2001 . δ13C values of organic carbon in cropland and forest soils in Japan . Soil SciPlant Nutr , 47 : 17 – 26 .
- Food and Agriculture Organization, International Soil Reference and Information Centre, International Society for the Systems Sciences1998 World Reference Base for Soil ResourcesWorld Soil Resources Report. Food and Agriculture Organization, Rome. No. 84
- Forest Soil Division . 1976 . [Classification of forest soil in Japan 1975 . BullGovernForestExpStation , 280 : 1 – 28 . (in Japanese with English summary)
- Hiradate , S , Nakadai , T , Shindo , H and Yoneyama , T . 2004 . Carbon source of humic substances in some Japanese volcanic ash soils determined by carbon stable isotopic ratio, delta C-13 . Geoderma , 119 : 133 – 141 .
- Kawamuro , K and Torii , A . 1986 . Past vegetation on volcanic ash forest soil. 1. Pollen analysis of the black soils, brown forest soils and podozolic soil at Mt. Hakkoda . BullForestry Forest Products ResInstit , 337 : 69 – 89 .
- Shindo , H , Higashi , T and Matsui , Y . 1986 . Comparison of humic acids from charred residues of Susuki (Eulalia, Miscanthus sinenesisAnderss.) and from the A horizon of volcanic ash soils . Soil SciPlant Nutr , 32 : 579 – 586 .
- Sakata , T , Ishizuka , S and Takahashi , M . 2004 . A method for measuring fluxes of green house (greenhouse??) gases from forest soils . BullForestry Forest Products ResInst , 392 : 259 – 264 .
- Hutchinson , GL and Mosier , AR . 1981 . Improved soil cover method for field measurement of nitrous oxide fluxes . Soil SciSocAmJ , 45 : 311 – 316 .
- Lin , G and Ehleringer , JR . 1997 . Carbon isotopic fractionation does not occur during dark respiration in C3 and C4 plants . Plant Physiol , 114 : 391 – 394 .
- Balesdent , J and Mariotti , A . 1996 . “ Measurement of soil organic matter turnover using 13C natural abundance ” . In Mass Spectrometry of Soil , Edited by: Boutton , TW and Yamasaki , S . 83 – 111 . New York : Marcel Dekker .
- Blair , N , Leu , A , Munoz , E , Olsen , J , Kwong , E and Desmarais , D . 1985 . Carbon isotopic fractionation in heterotrophic microbial metabolism . ApplEnvironMicrobiol , 50 : 996 – 1001 .
- Lin , G , Ehleringer , JR , Rygiewicz , PT , Johnson , MG and Tingey , DT . 1999 . Elevated CO2and temperature impacts on different components of soil CO2efflux in Douglas-fir terracosms . Global Change Biol , 5 : 157 – 168 .
- Taylor , JR . 1997 . An Introduction to Error Analysis , 2nd edn , Sausalito : University Science Books .
- Phillips , DL and Gregg , JW . 2001 . Uncertainty in source partitioning using stable isotopes . Oecologia , 127 : 171 – 179 .
- Ishizuka , S , Sakata , T Sawata , S . 2006 . High potential for increase in CO2flux from forest soil surface due to global warming in cooler areas of Japan . AnnForest Sci , 63 : 537 – 546 .
- Hibbard , KA , Law , BE , Reichstein , M and Sulzman , J . 2005 . An analysis of soil respiration across northern hemisphere temperate ecosystems . Biogeochemistry , 73 : 29 – 70 .
- Dudziak , A and Halas , S . 1996 . Influence of freezing and thawing on the carbon isotope composition in soil CO2 . Geoderma , 69 : 209 – 216 .
- Lee , MS , Nakane , K , Nakatsubo , T and Koizumi , H . 2003 . Seasonal changes in contribution of root respiration to total soil respiration in a cool-temperate deciduous forest . Plant Soil , 255 : 311 – 318 .
- Ohashi , M , Gyokusen , K and Saito , A . 2000 . Contribution of root respiration to total soil respiration in a Japanese cedar (Cryptomeria japonica) artificial forest . EcolRes , 15 : 323 – 334 .
- Takahashi , H , Konohira , E , Hiyama , T , Minami , M , Nakamura , T and Yoshida , N . 2002 . Diurnal variation of CO2concentration, Δ14C and δ13C in an urban forest: estimate of the anthropogenic and biogenic CO2contributions . Tellus , 54B : 97 – 107 .
- Hogberg , P , Nordgren , A Buchmann , N . 2001 . Large-scale forest girdling shows that current photosynthesis drives soil respiration . Nature , 411 : 789 – 792 .
- Paul , KI , Polglase , PJ , Nyakuengama , JG and Khanna , PK . 2002 . Change in soil carbon following afforestation . Forest EcolManage , 168 : 241 – 257 .
- Chen , WJ , Zhang , QF , Cihlar , J , Bauhus , J and Price , DT . 2004 . Estimating fine-root biomass and production of boreal and cool temperate forests using aboveground measurements: A new approach . Plant Soil , 265 : 31 – 46 .
- Gill , RA and Jackson , RB . 2000 . Global pattern of root turnover for terrestrial ecosystems . New Phytologist , 147 : 13 – 31 .
- Majdi , H , Pregitzer , K , Moren , AS , Nylund , JE and Agren , GI . 2005 . Measuring fine root turnover in forest ecosystems . Plant Soil , 276 : 1 – 8 .
- Morisada , K , Ono , K and Kanomata , H . 2004 . Organic carbon stock in forest soils in Japan . Geoderma , 199 : 21 – 32 .
- Crow , SE , Sulzman , EW , Rugh , WD , Bowden , RD and Lajtha , K . 2006 . Isotopic analysis of respired CO2during decomposition of separated soil organic matter pools . Soil BiolBiochem , 38 : 3279 – 3291 .
- Fernandez , I , Mahieu , N and Cadisch , G . 2003 . Carbon isotopic fractionation during decomposition of plant materials of different quality . Global BiogeochemCycles , 17 : 1075
- Klumpp , K , Schäufele , R , Lötscher , M , Lattanzi , FA , Feneis , W and Schnyder , H . 2005 . C-isotope composition of CO2respired by shoots and roots: fractionation during dark respiration? . Plant Cell Environ , 28 : 241 – 250 .