Abstract
Viruses are the most abundant biological entities in marine and freshwater environments. Many studies have shown the ecological importance of viruses in the primary production and microbial food web in aquatic environments. However, no studies have examined viral abundance in the floodwater of paddy fields. The present study surveyed the abundance of virus-like particles (VLPs) and bacteria in the floodwater of a Japanese paddy field under a long-term fertilizer trial since 1925 during the rice cultivation period. Virus-like particles and bacterial abundances in the floodwater ranged from 5.6 × 10⁶ to 1.2 × 10⁹ VLPs mL−1 and from 9.2 × 10⁵ to 4.3 × 10⁸ cells mL−1 with mean abundances of 1.5 × 10⁸ VLPs mL−1 and 5.1 × 10⁷ cells mL−1, respectively, and increased with an increase in the turbidity of the floodwater with suspended particles. The magnitude of seasonal variation was more than 50-fold for VLP abundance and 100-fold for bacterial abundance. The virus-to-bacterium ratios fluctuated over the rice cultivation period, ranging from 0.11 to 72 and their increase correlated with the decrease in bacterial abundance. Our results suggest that viral abundance in the floodwater of paddy fields is larger than in natural marine and freshwater environments.
INTRODUCTION
Viruses are the most abundant biological entities in marine and freshwater environments. And many studies have shown the ecological importance of viruses in global biogeochemical nutrient cycles (CitationFuhrman 1992; CitationWeinbauer 2004; CitationWeinbauer and Höfle 1998). Viruses are recognized as the greatest genomic reservoirs in marine and freshwater environments because of their huge abundance and diversity (CitationFrost et al. 2005; CitationPaul and Sullivan 2005; CitationWeinbauer and Rassoulzadegan 2004).
The floodwater in paddy fields is a unique, man-made aquatic environment. Several studies have enumerated specific phages in the floodwater using a plate method. CitationSingh (1973) reported that phages of a cyanobacterium Plectonema boryanum strain 594 ranged from zero to 1000 phage forming units (PFU) mL−1 in Cuttack rice fields in India. CitationEzuka and Kaku (2000) enumerated phages of Xanthomonas oryzae pv. oryzae, a pathogen of bacterial blight in rice plants, in Japanese paddy fields during the nursery and early paddy field stages to enable forecasting of disease severity prior to the appearance of the disease and showed that phages varied from zero to 102 PFU mL−1 according to the disease severity. However, there is no information about viral abundance in the paddy field floodwater, which is an aquatic environment covering 1.6 million ha worldwide (International Rice Research Institute World Rice Statistics: http://www.irri.org/science/ricestat/index.asp).
The type of field management used, for example, the fertilizer application, agrochemical application and drainage, directly influences the floodwater ecosystem in paddy fields. The type of fertilizers, the growth stage of the rice plants and midseason drainage are known to influence the community structure of microorganisms, phytoplankton and zooplankton in the floodwater (CitationKimura et al. 2002; CitationOkabe et al. 2000; CitationYamazaki et al. 2001).
The present study aims to enumerate viral and bacterial abundances, and to understand their relationships in the floodwater of a Japanese paddy field during the rice cultivation period. We examined a paddy field under a long-term fertilizer trial to compare the effects of fertilizer type and
Table 1 Total C and N contents, cation exchange capacity and pH (H2O) in the soil
MATERIALS AND METHODS
Study site
The study paddy field was located in the Aichi-ken Anjo Research and Extension Center, Central Japan (latitude 34.8° N, longitude 137.5°E). The soil in the field was an Anthraquic Yellow Soil (an Oxyaquic Dystrudept). The field had been subjected to a long-term fertilizer trial since 1925, and the following four plots were chosen for the present study: a plot without fertilizer (NF plot), a plot with chemical fertilizers (CF plot), a plot with chemical fertilizers and lime (CFCa plot), and a plot amended with chemical fertilizers, lime and compost (CM plot). The size of the plots ranged from 3.6 m × 7.3 m to 3.6 m × 9.1 m, with no replication of treatment. The soil properties of the plots are shown in . Paddy rice (Oryza sativa L. cv. Nihonbare) was cultivated in the plots using conventional means. Irrigation water was introduced from an irrigation canal. The calendar of field management and the amounts of fertilizers and herbicides applied are shown in .
Sampling of floodwater
Approximately 100 mL of floodwater was collected from the middle part of each of the four sides of each plot, along the footpaths, once every 6–13 days from 15 June 2005 (1 week after transplanting rice) during the cultivation period (11 times). The floodwater was sampled carefully from the upper part to avoid mixing with surface soil soared into the floodwater by disturbance. The depth of floodwater ranged from 1.4 to 15 cm during the cultivation period, and the water requirement in depth was approximately 3 cm day−1 for the experimental plots. In addition, irrigation water was collected on 18 and 24 August and 1, 13 and 22 September. Sampling times were between 10:30 and 11:30 hours. Large aquatic organisms were removed from the water samples by passing the water through a 46-µm sieve. After adding 0.25 m3 m−3 glutaraldehyde solution (final concentration 0.005 m3 m−3), the water samples were stored in a container with ice. The water samples were kept at −80°C in the laboratory until viral and bacterial enumeration (CitationMarie et al. 1999). Separately, pH and the temperature of the floodwater were determined in the field using a pH meter (SS974, HORIBA Co., Kyoto, Japan).
Enumeration of virus-like particle abundance
Immediately after the preserved floodwater and irrigation water samples were melted at room temperature, they were sonicated for 3 min (38 kHz, 80 W) and vortexed for 30 s, successively. For the enumeration of planktonic viruses (not adsorbed on suspended particles), the floodwater samples were directly filtrated using a 0.45-µm Nuclepore filter (Whatman Japan KK, Tokyo, Japan), diluted 10-fold to 100-fold with TE buffer (10 mmol L−1 Tris, 1 mmol L−1 ethylenediaminetetraacetic acid [pH 8]; CitationBrussaard et al. 2000), and stained with SYBR Green I (final concentration 0.0001 m3 m−3; Molecular Probes, Eugene, OR, USA) for 15 min at 80°C under dark conditions (CitationBrussaard et al. 2000). SYBR Green I is the most stable fluorescent dye used for viral enumeration (CitationWommack and Colwell 2000). Enumeration of planktonic viruses was conducted for the samples collected from the right and left side footpaths of the irrigation inlet footpath on 15 June, 7 July, 2 August, 18 August and 13 September.
For the enumeration of total viral abundance, 1 mL of the water samples was placed into a 20-mL glass bottle
Table 2 Calendar of field management in the study paddy field in 2005
Enumeration of viruses was carried out using epifluorescence microscopy (EFM). Stained viruses were collected on a 0.022-µm pore-size Anodisc 25 membrane filter (25 mm diameter; Whatman Japan KK) that had been stained beforehand with Irgaran Black for absorbing autofluorescence of the filter, placed on a glass slide, and guarded from color fading with 20 µL of SlowFade Gold Antifade reagent (Invitrogen Japan KK, Tokyo, Japan). Viruses on the filters were observed at a magnification of ×1,000 using an Olympus BX-50 epifluorescence microscope equipped with a UPlan Fl Objective lens with U-MNIBA filter (Olympus, Tokyo, Japan), and 6–8 fields of the scope were randomly recorded using a digital camera (shutter speed 10 s). Large particles were regarded as bacterial particles, and viruses were enumerated by counting the smaller particles in 2–4 filters for every sample. As all the viral particles that were counted by EFM were not confirmed to be viruses, we called the enumerated viruses virus-like particles (VLPs) in the present study (CitationWommack and Colwell 2000).
To check the reliability of viral enumeration using EFM, a portion of the filtrate that passed through a 0.45-µm Nuclepore filter was subjected to observation using a transmission electron microscope (TEM; H-7500AMT Advantage HR, Hitachi High-Technologies, Tokyo, Japan). Floodwater samples collected from every plot on 15 and 28 June and 7 July were used. Viruses in 0.5 mL of the filtrate were collected onto formvar-coated 400 mesh Cu grids using ultracentrifugation (100,000 g for 60 min; Beckman TL-100 tabletop ultracentrifuge, Beckman Coulter KK, Tokyo, Japan) according to the method of CitationBørsheim et al. (1990). The TEM enumeration was carried out by taking photographs of more than 20 fields after negative staining with 20 g L−1 uranyl acetate.
The sample bottles in the VLP enumeration were glass to prevent the viruses adhering to the surface of the bottles (CitationThompson et al. 1998). Distilled water was used for the preparation of the NB solution and the TE buffer, and the SYBR Green I solution was rendered virus-free by passing it through a 0.022-µm filter.
Enumeration of bacterial abundance
The melted water samples were ultrasonicated and vortexed as described above. One milliliter of the sample was placed into a 15-mL centrifuge tube (Asahi Technoglass Co., Tokyo, Japan) and mixed with 1 mL of TE buffer. Bacterial staining was carried out by the addition of SYBR Green I reagent (final concentration 0.0001 m3 m−3) and subsequent incubation for 30 min at room temperature under dark conditions. Stained bacteria were collected on a 0.22-µm pore-size polycarbonate 25 black membrane filter (25 mm diameter; Advantec Toyo Kaisha, Tokyo, Japan). The membrane filter was placed on a glass slide, and 20 µL of SlowFade Gold Antifade reagent was added. Bacterial abundance was counted for 7–13 fields measuring 50 µm × 50 µm using an Olympus BX-50 epifluorescence microscope equipped with a UPlan Fl Objective lens with U-MNIBA filter.
Measurement of the turbidity of floodwater samples
Immediately after the melted water samples were ultrasonicated and vortexed as described above, the turbidity of the floodwater samples was determined using a spectrophotometer (UV-2200, Shimadzu Co., Kyoto, Japan) with a wavelength of 660 nm. In addition, the dry weight of the suspended particles in sample water collected on 28 June and 7 July was determined after desalting the floodwater by centrifuging the water twice at 8,500 g in distilled water, and the absorption coefficient (absorbance per dry weight) was calculated. The dry weight was determined after drying the samples at 105°C.
Statistical analyses
A correlation matrix was calculated to estimate the correlation among environmental properties, VLP abundance, bacterial abundance, and virus-to-bacterium ratios (VBRs). To identify the sampling date and the plot that was significantly different from the other samples for the respective variables, two-way anovas and Tukey's honestly significant difference tests were carried out (SPSS for Windows, Ver. 10.0). In addition, as midseason drainage is known to affect the communities of microorganisms, phytoplankton and zooplankton in paddy fields (CitationSugano et al. 2005; CitationTanahashi et al. 2005; CitationYamazaki et al. 2001, Citation2003), the influences of the midseason drainage during cultivation (15–25 July) were also statistically analyzed using a Tukey's honestly significant difference test.
RESULTS AND DISCUSSION
Temperature, pH and turbidity of the floodwater
Floodwater temperature ranged from 20.6 to 35.3°C during the rice cultivation period (). The highest temperature was recorded on 2 August in the CF, CFCa and CM plots, and on 13 September in the NF plot.
Figure 1 Seasonal variations in (a) temperature, (b) pH and (c) turbidity determined by absorbance at 660 nm wavelength in the floodwater samples in a plot without fertilizer (○), a plot with chemical fertilizers (□), a plot with chemical fertilizers and lime (⧫) and a plot amended with chemical fertilizers, lime and compost (▴) during the rice cultivation period. Shaded columns show the period of midseason drainage. Values are means ± standard deviation; n = 4.
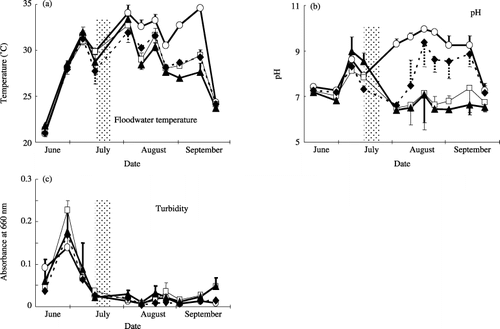
Floodwater pH ranged from 5.9 to 10.0 during the rice cultivation period (). Floodwater pH was significantly correlated with floodwater temperature throughout the cultivation (P < 0.01). After the midsummer drainage, the NF plot showed a higher floodwater pH than the other plots (: P < 0.01), in part, because of the active photosynthesis of phytoplankton resulting in a decrease in HCO− 3 concentration (the increase in OH−; HCO− 3 = CO2[to photosynthesis] + OH−) in the floodwater (CitationMikkelsen et al. 1978). Higher pH was also observed after midseason drainage in the CFCa plot compared with the CF and CM plots (P < 0.01), which was attributed to the application of lime. In general, variations in pH among the sampling sites were relatively small except for the CF plot on 18 August and 13 September, the CFCa plot on 10 August, and the CM plot on 18 August, when extremely high pHs (8.9 or higher) were observed at one of the four sampling sites. As the pH on 15 June was higher than on 28 June (P < 0.01), the effect of herbicide application (20 June) on the floodwater pH was estimated (through the suppression of photosynthesis by phytoplankton; ).
Turbidity of the floodwater estimated from the absorbance at 660 nm was higher before the midseason drainage than after it in every plot (; P < 0.01). In addition, turbidity in the CF plot (mean ± standard deviation [SD]: 0.023 ± 0.017) and the CM plot (0.025 ± 0.015) was larger than in the NF plot (0.012 ± 0.006) and the CFCa plot (0.011 ± 0.007) after the midseason drainage (P < 0.05), although these values were low. Turbidity correlated well with floodwater pH throughout the flooded period (P < 0.05) and with floodwater temperature after the midseason drainage (P < 0.01). Suspended substances were estimated to consist mainly of soil particles from the brown color and texture of the suspended substances collected on the Nuclepore filters. The higher floodwater pH seemed to have accelerated the dispersion of soil particles by ionizing the sites of variable charges on soil particles negatively.
Validity of viral enumeration using EFM
Estimation of viral abundance using TEM is the standard method. However, enumeration of viruses using EFM is now more frequently used than TEM to estimate total viral abundance in aquatic environments because of the rapidity and lower costs of the former method (CitationWeinbauer 2004; CitationWommack and Colwell 2000). As
Figure 2 Comparison of viral counts using epifluorescence microscopy (EFM) and transmission electron microscopy (TEM). The line indicates the linear regression (EFM = 1.27 × TEM −13.80, R2 = 0.824).
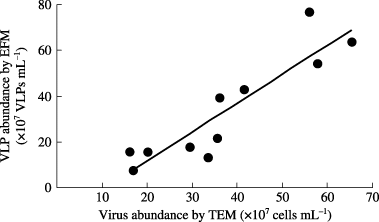
As shown in , VLP abundance estimated using EFM showed a highly significant correlation (P < 0.01) with the abundance determined using TEM, on average 33% larger viral counts were recorded using the former method. Overestimation of viral abundance using EFM or underestimation using TEM is a common occurrence in viral enumeration of aquatic samples (CitationWeinbauer 2004; CitationWommack and Colwell 2000), and CitationNoble and Fuhrman (1998) also found on average 28% larger viral counts using EFM with SYBR Green I for coastal water samples. The overestimation using EFM resulted, in part, from the counting of dots of non-viral origins. Underestimation using TEM was attributable to viral loss when uranyl acetate was wicked away from the grids. Furthermore, viruses might be obscured by other larger, darkly stained particles on the grids (CitationNoble and Fuhrman 1998). Non-viral origins in the present study may be attributed to bacteria that could pass through the 0.45-µm filter. However, VLPs in the floodwater were generally larger than the bacterial abundance and the large fluorescent particles of bacterial sizes could be excluded visually, although the bacterial portion that passed through a 0.45-µm filter is generally greater than 50% (CitationCole et al. 1993). Therefore, the potential bias exerted by incorrect counting of bacteria as viruses would not be serious in the present study. On the whole, we regarded our method of VLP enumeration as satisfactory for the purposes of the present study.
Abundance of virus-like particles
The VLP abundance in the floodwater during the rice cultivation period ranged from 1.3 × 10⁷ to 6.4 × 10⁸ (mean ± SD: 1.5 ± 1.4 × 10⁸) VLPs mL−1 in the NF plot, from 5.6 × 10⁶ to 8.1 × 10⁸ (1.6 ± 2.1 × 10⁸) VLPs mL−1 in the CF plot, from 6.1 × 10⁶ to 1.2 × 10⁹ (1.8 ± 3.2 × 10⁸) VLPs mL−1 in the CFCa plot, and from 8.6 × 10⁶ to 9.4 × 10⁸ (1.0 ± 1.7 × 10⁸) VLPs mL−1 in the CM plot (). Thus, VLP abundance fluctuated by 50 to 200-fold. It tended to increase with time after transplanting first until the beginning of July and VLPs were more numerous on 28 June and 7 July than at the other sampling times (P < 0.01 except for P < 0.02 between 15 June and 7 July). The largest and the smallest fluctuations in VLP abundance during the rice cultivation period were observed in the CFCa and NF plots, respectively. The VLPs were more numerous in the NF plot than in the CFCa and CM plots after midseason drainage (P < 0.01). The VLP abundance in the irrigation water ranged from 5.1 × 10⁶ to 1.1 × 10⁷ VLPs mL−1 (), which was smaller than that in the floodwater. No correlation was found between the VLP abundances.
Figure 3 Seasonal variations in the abundance of (a) virus-like particles (VLPs) and (b) bacteria in the water samples in a plot without fertilizer (○), a plot with chemical fertilizers (□), a plot with chemical fertilizers and lime (⧫), a plot amended with chemical fertilizers, lime and compost (▴), and the irrigation water (★) during the rice cultivation period. Shaded columns show the period of midseason drainage. Values are means ± standard deviation; n = 4.
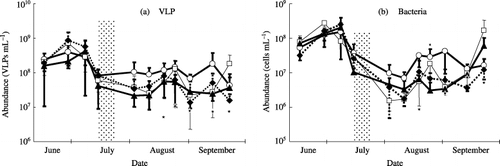
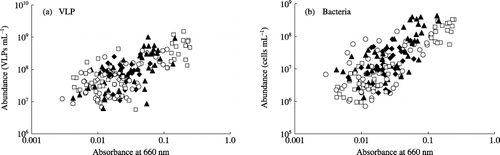
Figure 4 Relationships between (a) virus-like particles (VLPs) and (b) bacterial abundance and floodwater turbidity in a plot without fertilizer (○), a plot with chemical fertilizers (□), a plot with chemical fertilizers and lime (⧫) and a plot amended with chemical fertilizers, lime and compost (▴) during the rice cultivation period. Correlation coefficients were 0.688 (significant at the 1% level) between the abundance of VLPs and the floodwater turbidity and 0.691 (significant at the 1% level) between the abundance of bacteria and the floodwater turbidity.
These findings on VLP abundance in the floodwater suggest that the floodwater is an aquatic environment abundant in viruses compared with marine, estuarine and freshwater systems, where VLP abundance is generally less than 107 VLPs mL−1 (CitationWeinbauer 2004; CitationWommack and Colwell 2000). The floodwater is a very shallow aquatic environment (15 cm or less for the study paddy field), and the nutrient supply from the soil and fertilizers might result in active growth of microorganisms and a subsequent increase in viruses. The floodwater was also characterized by large seasonal variations of more than 50 to 200-fold in VLP abundance. Seasonal variation of viruses is mainly attributed to the autumn and spring blooms of phytoplankton in natural aquatic environments, but the magnitude of variation was less than 30-fold at most (CitationBratbak et al. 1990; CitationLarsen et al. 2001; CitationWilson et al. 2002). Smaller VLP abundance in the irrigation water compared with the floodwater indicated that viruses in the floodwater were not derived directly from the irrigation water, but rather occurred in the floodwater at least after the midseason drainage ().
The VLP abundance in every plot correlated significantly with turbidity (; P < 0.01). CitationHewson et al. (2001) also found correlations between VLP abundance and suspended particles in the water columns of eutrophic and oligotrophic estuaries in subtropical Queensland, Australia, and they attributed the benthic viral populations as the settlement of planktonic viruses by adsorbing to suspended particles (> 0.7 µm) in the water column, in which suspended particles mainly consisted of organic matter.
The VLP abundance also correlated well with floodwater pH after midseason drainage in the CFCa plot (P < 0.01). Significant relationships in VLP abundance with floodwater temperature were only observed in the CF plot (P < 0.01) and the CFCa plot (P < 0.05) after midseason drainage, as well as in the CM plot during the flooding period (P < 0.05).
Abundance of planktonic virus-like particles
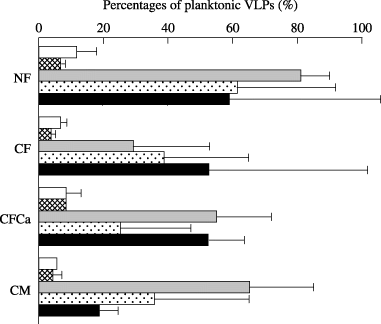
The VLP abundance of the planktonic forms ranged from 2.2 × 10⁶ to 8.0 × 10⁷ VLPs mL−1 (mean ± SD: 2.0 ± 1.7 × 10⁷ VLPs mL−1), with greater abundance in the NF plot compared with the CF and CFCa plots (P < 0.05). The abundance was not significantly different among the sampling times, and accounted for 1.7 to 106% of the total VLP abundance in the floodwater (). The proportion of planktonic forms in the total viral populations was small when VLP abundance was numerous, and the average proportions were 8.1, 5.8, 58, 40 and 46% on 15 June, 7 July, 2 August, 18 August and 13 September, respectively.
Abundance of VLPs adsorbed to suspended particles in the sample water (VA; ×107 VLPs mL−1) was estimated by subtracting the abundance of planktonic VLPs from the abundance of the total VLPs (,). The VA significantly correlated with the weights of the suspended particles (x; g L−1); VA = 560x − 2.7 (r = 0.7255, P < 0.01), where the absorption coefficient (absorbance 1 = 0.71 mg mL−1) was used to translate the turbidity of floodwater samples to the weight of their suspended particles. The average proportions of particle-adsorbed forms of VLPs in the floodwater were 75% during the rice cultivation period. Larger VLP abundance and seasonal variation in the floodwater in comparison with other aquatic environments were, therefore, estimated to be because of the presence of suspended particles in the
Figure 5 Percentage of planktonic virus-like particles (VLPs) in the total viral populations. The figure shows the average values with a half difference between duplication. (□), 15 June; (▓), 7 July; (▒), 2 August; (░), 18 August; (▀), 13 September. CF, plot with chemical fertilizers; CFCa, plot with chemical fertilizers and lime; CM, plot amended with chemical fertilizers, lime and compost; NF, plot without fertilizer.
Bacterial abundance
As shown in , bacterial abundance ranged from 3.0 × 10⁶ to 3.4 × 10⁸ (mean ± SD: 4.7 ± 6.2 × 10⁷) cells mL−1 in the NF plot, from 6.9 × 10⁵ to 3.9 × 10⁸ (6.1 ± 10.0 × 10⁷) cells mL−1 in the CF plot, from 1.0 × 10⁶ to 3.9 × 10⁸ (4.7 ± 9.1 × 10⁷) cells mL−1 in the CFCa plot, and from 9.2 × 10⁵ to 4.3 × 10⁸ (4.7 ± 8.9 × 10⁷) cells mL−1 in the CM plot. Bacterial abundance fluctuated by 100 to 600-fold over the rice cultivation period (). Bacterial abundance in the floodwater on 28 June and 7 July was more numerous than at the other sampling times (P < 0.01), just as VLP abundance was. The largest and smallest fluctuations in bacterial abundance over the rice cultivation period were observed in the CF and NF plots, respectively. There was no significant difference in bacterial abundance among the plots after the midseason drainage. Bacterial abundance in the irrigation water ranged from 8.4 × 10⁵ to 6.2 × 10⁷ cells mL−1 (), smaller than the abundance in the floodwater, and did not correlate with that in the floodwater. These facts indicated that bacteria in the floodwater were not derived from the irrigation water, at least after the midseason drainage, as in the case of viruses.
Bacterial abundance in every plot was also significantly correlated with turbidity (P < 0.01; ). Bacterial abundance in the floodwater samples on 28 June and 7 July ranged from 1.29 × 10⁸ to 3.22 × 10⁸ cells mL−1, and suspended particles ranged from 0.05 to 0.22 mg mL−1 for those samples. Assuming that all the bacterial cells in the floodwater are coccoid with the diameter of 1 µm and contain 90% water, their dry weight amounted to 0.0068–0.0169 mg mL−1, and bacteria were estimated to be 4–14% of suspended particles on the weight basis in those floodwater samples. As the average diameter of bacteria in lakes is far smaller than 1 µm (CitationCole et al. 1993), the contribution of bacteria to suspended particles might be less than 10%. Therefore, suspended particles were estimated to consist mainly of soil particles as estimated before from the appearance of them. Suspended particles contribute to an increase not only in VLP abundance but also in bacterial abundance in the floodwater. Most of the bacteria under a microscope adsorbed to suspended particles in the present study (data not shown). Compared with VLP, bacterial abundance is more sensitive to fluctuations in turbidity.
Virus-to-bacterium ratios
As shown in , VBRs ranged from 0.81 to 23 (mean ± SD: 7.1 ± 7.3) in the NF plot, from 0.40 to 72 (7.9 ± 11.5) in the CF plot, from 0.80 to 59 (10.2 ± 12.0) in the CFCa plot, and from 0.11 to 47 (7.4 ± 10.2) in the CM plot. The VBRs in the irrigation water ranged from 0.17 to 6.1. There was no significant difference in VBRs among the plots. As expected from , VLP abundance showed a significant correlation with bacterial abundance for every plot (P < 0.01). The VBRs tended to be higher in August after the midseason drainage (11.5 ± 13.9 to 17.4 ± 11.3) than in June and July before the midseason drainage (3.8 ± 2.7 to 4.3 ± 4.8) and in September (1.5 ± 1.2 to 8.3 ± 7.3). The higher VBRs in August resulted, in part, from the lower abundance of bacterial communities in August compared with those in the other months.
In contrast to the general findings that VBRs fall between 3 and 25 in aquatic environments (CitationFuhrman 1999; CitationWeinbauer 2004; CitationWommack and Colwell 2000), 35% and 6% of the floodwater samples in this study showed lower and higher VBRs, respectively, than the range recorded in aquatic environments (). CitationWeinbauer (2004) reviewed the results on VBRs in marine sediments and found that they ranged from 0.11 to 71, which may indicate that shallow aquatic environments
Figure 6 Seasonal variations in virus-to-bacterium ratios (VBRs) in the floodwater in a plot without fertilizer (○), a plot with chemical fertilizers (□), a plot with chemical fertilizers and lime (◊) and a plot amended with chemical fertilizers, lime and compost (▴) during the rice cultivation period. The correlation coefficient between the abundance of VLPs and bacteria was 0.608 (significant at the 1% level).
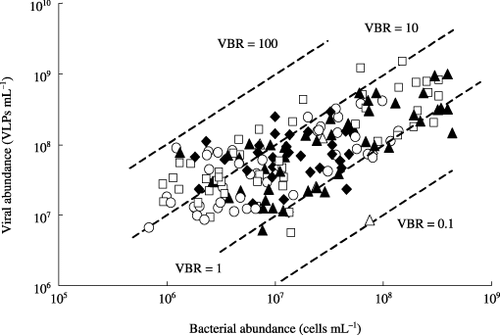
Figure 7 Relationships between virus-like particles (VLPs) and bacterial abundance and virus-to-bacterium ratios (VBRs) in the floodwater in a plot without fertilizer (○), a plot with chemical fertilizers (□), a plot with chemical fertilizers and lime (⧫) and a plot amended with chemical fertilizers, lime and compost (▴) during the rice cultivation period. The correlation coefficients were 0.041 (not significant) between VLPs and VBRs and −0.296 (significant at the 1% level) between bacteria and VBRs.
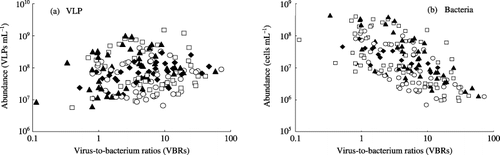
There was no significant correlation between VLP abundance and VBRs in total, although there were positive correlations between them when the correlation was calculated separately among the floodwater samples before (P < 0.01) and after (P < 0.05) the midseason drainage (). Seasonal variation in VBRs showed significant correlation with the change in bacterial abundance, and VBRs increased with the decrease in bacterial abundance in the floodwater (; P < 0.01). The inverse relationship between VBRs and bacterial abundance observed in the present study is common in aquatic environments (CitationWommack and Colwell 2000).
In conclusion, the floodwater of paddy fields is a unique aquatic environment for viruses and bacteria with their higher abundances compared with other aquatic environments. The floodwater was characterized by large seasonal variations in viral and bacterial abundances with magnitudes of more than 50-fold for VLP abundance and 100-fold for bacterial abundance, and the largest and smallest fluctuations in VLP abundance during the rice cultivation period were observed in the CFCa and NF plots, respectively. Viruses and bacteria in the floodwater were not directly derived from the irrigation water, but rather occurred in the floodwater. The VLP and bacterial abundances correlated with the turbidity (the amount of suspended particles) of the floodwater, and suspended particles were estimated to consist mainly of soil particles. The VBRs fluctuated widely during rice cultivation, and were negatively correlated with changes in bacterial abundance.
ACKNOWLEDGMENTS
The authors thank Professor Hiroshi Miyake and Assistant Professor Michio Kawasaki, Graduate School of Bioagricultural Sciences, Nagoya University, for their technical assistance with the transmission electron microscope manipulation. This study was conducted with the financial support of the Sumitomo Foundation for Environmental Sciences in 2005.
Related Research Data
REFERENCES
- Fuhrman , JA . 1992 . “ Bacterioplankton roles in cycling of organic matter: the microbial food web ” . In Primary Productivity and Biogeochemical Cycles in the Sea , Edited by: Palkowski , PG and Woodhead , AD . 361 – 383 . New York : Plenum .
- Weinbauer , MG . 2004 . Ecology of prokaryotic viruses . FEMS MicrobiolRev , 28 : 127 – 181 .
- Weinbauer , MG and Höfle , MG . 1998 . Significance of viral lysis and flagellate grazing as factors controlling bacterioplankton production in a eutrophic lake . ApplEnvironMicrobiol , 64 : 431 – 438 .
- Frost , LS , Leplae , R , Summers , AO and Toussaint , A . 2005 . Mobile genetic elements: the agents of open source evolution . Nat. Rev./Microbiol. , 3 : 722 – 732 .
- Paul , JH and Sullivan , MS . 2005 . Marine phage genomics: what have we learned? . CurrOpinBiotechnol , 16 : 299 – 307 .
- Weinbauer , MG and Rassoulzadegan , F . 2004 . Are viruses driving microbial diversification and diversity? . EnvironMicrobiol , 6 : 1 – 11 .
- Singh , PK . 1973 . Occurrence and distribution of cyanophages in ponds, sewage and rice fields . ArchMicrobiol , 89 : 169 – 172 .
- Ezuka , A and Kaku , H . 2000 . A historical review of bacterial blight of rice . BullNatlInstAgrobiolRes , 15 : 1 – 207 . (in Japanese)
- Kimura , M , Shibagaki , T , Nakajima , Y , Matsuya , K and Ikenaga , M . 2002 . Community structure of the microbiota in the floodwater of a Japanese paddy field estimated by restriction fragment length polymorphism and denaturing gradient gel electrophoresis pattern analyses . BiolFertilSoils , 36 : 306 – 312 .
- Okabe , A , Toyota , K and Kimura , M . 2000 . Seasonal variations of phospholipid fatty acid composition in the floodwater of a Japanese paddy field under a long-term fertilizer trial . Soil SciPlant Nutr , 46 : 177 – 188 .
- Yamazaki , M , Hamada , Y , Ibuka , T , Momii , T and Kimura , M . 2001 . Aquatic organisms in the floodwater of a Japanese paddy field under a long-term fertilizer trial . Soil SciPlant Nutr , 47 : 587 – 599 .
- Marie , D , Brussaard , CPD , Thyrhaug , R , Bratbak , G and Vaulot , D . 1999 . Enumeration of marine viruses in culture and natural samples by flow cytometry . ApplEnvironMicrobiol , 65 : 45 – 52 .
- Brussaard , CPD , Marie , D and Bratbak , G . 2000 . Flow cytometric detection of viruses . JVirolMeth , 85 : 175 – 182 .
- Wommack , KE and Colwell , RR . 2000 . Virioplankton: viruses in aquatic ecosystems . MicrobiolMolBiolRev , 64 : 69 – 114 .
- Danovaro , R , Dell’anno , A , Trucco , A , Serresi , M and Vanucci , S . 2001 . Determination of virus abundance in marine sediments . ApplEnvironMicrobiol , 67 : 1384 – 1387 .
- Germida , JJ and Casida , LE . 1981 . Isolation of Arthrobacter bacteriophage from soil . ApplEnvironMicrobiol , 41 : 1389 – 1393 .
- Lanning , S and Williams , ST . 1982 . Methods for the direct isolation and enumeration of actinophages in soil . JGenMicrobiol , 128 : 2063 – 2071 .
- Børsheim , KY , Bratbak , G and Heldal , M . 1990 . Enumeration and biomass estimation of planktonic bacteria and viruses by transmission electron microscopy . ApplEnvironMicrobiol , 56 : 352 – 356 .
- Thompson , SS , Flury , M , Yates , MV and Jury , WA . 1998 . Role of the air–water–solid interface in bacteriophage sorption experiment . ApplEnvironMicrobiol , 64 : 304 – 309 .
- Sugano , A , Tsuchimoto , H , Tun , CC , Kimura , M and Asakawa , S . 2005 . Succession of methanogenic archaea in rice straw incorporated into a Japanese rice field: estimation by PCR-DGGE and sequence analyses . Archaea , 1 : 391 – 397 .
- Tanahashi , T , Murase , J , Matsuya , K , Asakawa , S and Kimura , M . 2005 . Bacterial communities responsible for the decomposition of rice straw compost in a Japanese rice paddy field determined by DGGE analysis of amplified 16S rDNA and 16S rRNA fragments . Soil SciPlant Nutr , 51 : 351 – 360 .
- Yamazaki , M , Hamada , Y Kamimoto , N . 2003 . Changes in the community structure of aquatic organisms after midseason drainage in the floodwater of Japanese paddy fields . Soil SciPlant Nutr , 49 : 125 – 135 .
- Mikkelsen , DS , De Datta , SK and Obcema , WN . 1978 . Ammonia volatilization losses from flooded rice soils . Soil SciSocAm J , 142 : 725 – 730 .
- Noble , RT and Fuhrman , JA . 1998 . Use of SYBR Green I for rapid epifluorescence counts of marine viruses and bacteria . AquatMicrobEcol , 14 : 113 – 118 .
- Cole , JJ , Pace , ML , Caraco , NF and Steinhart , GS . 1993 . Bacterial biomass and cell size distributions in lakes: More and larger cells in anoxic waters . LimnolOceanogr , 38 : 1627 – 1632 .
- Bratbak , G , Heldal , M , Norland , S and Thingstad , TF . 1990 . Viruses as partners in spring bloom microbial trophodynamics . ApplEnvironMicrobiol , 56 : 1400 – 1405 .
- Larsen , A , Castberg , T Sandaa , RA . 2001 . Population dynamics and diversity of phytoplankton, bacteria and viruses in a seawater enclosure . MarEcolProgSer , 221 : 47 – 57 .
- Wilson , WH , Tarran , G and Zubkov , MV . 2002 . Virus dynamics in a coccolithphore-dominated bloom in the North Sea . Deep-Sea ResII , 49 : 2951 – 2963 .
- Hewson , I , O’Neill , JM , Fuhrman , JA and Dennison , WC . 2001 . Virus-like particle distribution and abundance in sediments and overlaying waters along eutrophication gradients in two subtropical estuaries . LimnolOceanogr , 46 : 1734 – 1746 .
- Fuhrman , JA . 1999 . Marine viruses and their biogeochemical and ecological effects . Nature , 399 : 541 – 548 .