Abstract
Intensive field experiments were conducted from 1999 to 2001 to examine the effects of farmland improvement on methane (CH4) emission from two rice paddy fields in Niigata, Japan. Rice cultivation and field management were similar in both paddy fields; however, one field had a subsurface drainage system installed 0.6–0.8 m below the soil surface (drained paddy field) and the other had no such system (non-drained paddy field). Methane emissions from the drained paddy field during each rice-growing season were approximately 71% lower than those from the non-drained paddy field. The subsurface drainage system lowered the groundwater level and top of the gley soil layer to the drainage pipe level, enhanced soil permeability, and resulted in more oxidized soil conditions in the fallow season. The lower total and hot water extractable carbon in the plowed layer soil of the drained field versus the non-drained field strongly suggests that the organic substrate that gives rise to CH4 decomposed more quickly in the drained field. Ferrous iron concentrations in the fresh plowed layer soil, collected from before submergence up to mid-summer drainage, were also much lower in the drained field. This indicated that ferrous iron produced during the flooding seasons was quickly oxidized to ferric iron in the fallow season, which then acted as an electron accepter and inhibited CH4 production in the subsequent rice-growing season. In contrast, the continuous reductive conditions in the non-drained field (even in the fallow season) prevented most of the ferrous iron from being oxidized. Therefore, installing a subsurface drainage system greatly reduced CH4 emissions by improving aerobic conditions and reducing CH4 production potential. Methane emissions with a large inter-annual variation in the rice-growing season from the non-drained field were positively correlated with soil moisture in the plowed layer before submergence, which, in turn, greatly affected CH4 emission in the following rice-growing season.
INTRODUCTION
Methane (CH4) is the second most important greenhouse gas after carbon dioxide (CO2; CitationIntergovernmental Panel on Climate Change 2001). The third scientific report of the Intergovernmental Panel on Climate Change has estimated that approximately 60% of CH4 emissions are of anthropogenic origin and concluded that a 10–15% reduction in CH4 emissions from individual sources would stabilize its atmospheric concentration (CitationIntergovernmental Panel on Climate Change 2001). Paddy fields are one of the dominant anthropogenic sources of CH4 in the atmosphere. Therefore, many studies conducted since the 1980s have sought to determine the major factors controlling CH4 emissions from paddy fields, and how such emissions could be reduced. These studies have been reviewed by CitationKimura et al. (2004) and CitationYagi (2002).
Water management is one option to reduce CH4 emissions from paddy fields. Mid-summer drainage temporally keeps soil conditions oxidative and, thus, enhances root activity. Under controlled conditions, appropriately applied water management has been shown to significantly decrease CH4 emissions from paddy fields and experimental pots (CitationInubushi et al. 1992; CitationKimura et al. 1991; CitationSass et al. 1992; CitationYagi et al. 1996). In paddy fields, even those with Strong Gley soils, CH4 emissions have been suppressed by mid-summer drainage or intermittent drainage (CitationUoki and Noda 2001).
Another option to reduce CH4 emissions from paddy fields under single-crop summer cultivation is the amendment of organic matter inputs by managing the application form (e.g. compost vs fresh rice straw or green manure; CitationTsutsuki and Ponnamperuma [1987] and CitationYagi and Minami [1990]) or the timing of rice straw incorporation (e.g. in the autumn after harvest vs early spring before submergence; CitationWatanabe et al. [1993] and CitationInubushi et al. [1994]). In cooler temperate regions, CH4 emissions during the rice-growing season were reduced by incorporating the previous rice crop's straw into the soil in the fall, and by applying decomposition accelerators, such as microbial material, together with nitrogen fertilizer (CitationGoto et al. 2004).
In general, paddy soil fluctuates seasonally between oxidative and reductive conditions depending on water management, such as submergence or drainage. In poorly drained paddy fields, high groundwater levels decrease the further bearing capacity of soils and enhance reductive conditions. When such reductive soil conditions persist in the field, a gley soil layer forms below the groundwater level, causing injury to the roots of the rice plants.
Since 1963, farmland consolidation projects with governmental support carried out in Japan's paddy fields have sought to establish infrastructure to improve farming efficiency and increase rice productivity (CitationHasegawa and Tabuchi 1995). This was achieved by expanding and readjusting the scale of cultivated plots from 0.1–0.3 to 0.3–1.0 ha, improving irrigation efficiency by connecting each plot to an irrigation ditch or pipeline, and improving the drainage of poorly drained fields through subsurface drainage (CitationYamaji et al. 1999). A further improvement was for the irrigation and drainage systems (canals, ditches, pipes) to be fully independent of one another. As a result, more than 60% of all the paddy fields in Japan had improved by 2002 (CitationRural Development Bureau, Ministry of Agriculture, Forestry and Fisheries of Japan 2003). In Niigata Prefecture, where most presently cultivated paddy fields were wetlands or poorly drained fields prior to their conversion to this system, approximately 80% of the improved paddy fields have subsurface drainage systems (CitationNiigata Prefecture 2004). Subsurface drainage systems with draining pipes were constructed in poorly drained paddy fields because the fields need to dry as quickly as possible after the final drainage, approximately 2 weeks before harvest, so that there will be sufficient soil bearing capacity for effective machinery operations (CitationInoue and Tokunaga 1995).
Outside the flooded periods of rice cultivation, the new drainage systems have shifted the previously reduced conditions of fallow soils to oxidative conditions. As methanogens need extreme reductive conditions for CH4 production, such changes would be expected to suppress CH4 emissions, even during the rice-growing season. Indeed, maintaining oxidizing conditions during the rice-growing season in the plowed layer of paddy fields has been shown to suppress methanogenic activity (CitationGarcia et al. 2000; CitationWoese et al. 1990; CitationYagi and Minami 1990). CitationIshibashi et al. (1997) found that under the same conventional farm management practices CH4 emissions from a Thapto-Aeric Lowland paddy soil (7–14 g m−2 per season) were lower than those from a Mottled Gley Lowland soil (24–36 g m−2 per season). These results were based strictly on differences in paddy soil types, with no land improvements, such as subsurface drainage systems, on either site.
To clarify the effects of subsurface drainage on CH4 emissions, an intensive 3-year field study (1999–2001) comparing a poorly drained paddy field, with no subsurface drainage system, to a well-drained paddy field, equipped with a subsurface drainage system, was implemented in Niigata Prefecture, Japan. A further aim of this study was to determine the major factors controlling inter-annual variations in CH4 emissions from such paddy fields. Therefore, we also investigated soil moisture and groundwater levels during the fallow seasons and related them to CH4 emissions in the subsequent rice-growing seasons.
MATERIALS AND METHODS
Experimental site
The field experiments were conducted in rice paddy fields located in Nagaoka, Niigata Prefecture, Japan (37°27′Ν, 138°53′Ε), in 1999–2001. The Niigata Prefecture is located in northwestern Japan, in the central part of the coastal zone facing the Sea of Japan. Mean air temperature and precipitation during these three rice-growing seasons (20 April–15 September) were 21.4°C and 709.3 mm, respectively, while off-season values were 6.9°C and 1,757.5 mm, respectively. Meteorological data measured at the Niigata Agricultural Research Institute, located 3 km from the experiment site, confirm these conditions to be typical of this region. As the Nagaoka region receives up to 1.0 m of snow in winter, rice can only be grown as a single summer crop.
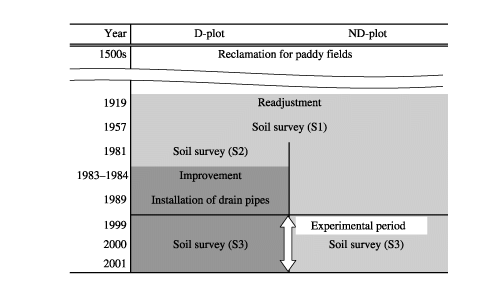
Figure 1 Chronology of land improvements on an experimental subsurface drained paddy field (D-plot) and an experimental non-drained paddy field (ND-plot) located in Niigata Prefecture, Japan.
History of the improvement of the experimental paddy fields
Two paddy fields located within 500 m of each other and situated on flat land in the same river basin were selected for this experiment. Until their reclamation for paddy fields in the 1500s, the entire neighborhood originally consisted of wetlands. The fields were further adjusted by land leveling in 1919 and small disorderly lots were combined to form orderly field lots of approximately 0.1 ha (20 m × 50 m) each (readjustment in ; CitationNiigata Prefecture 1982). The most significant difference between the two paddy fields was the presence or absence of pipe drainage under the plowed layer to improve the poorly drained conditions. The non-drained paddy field (ND-plot) only had a dual-purpose canal for irrigation and surface drainage installed in 1919 (readjustment in ). The other paddy field was further improved by land leveling in 1983–1984 to convert from 0.1 ha to 0.3 ha lots (30 m × 100 m; improvement in ; CitationNiigata Prefecture 1983, Citation1984), and irrigation and drainage canals were also independently constructed at this time. Under-drain pipes were then installed in this field in 1989 (CitationNiigata Prefecture 1989). In the drained paddy field (D-plot), four ditches were cut to a depth of 0.6–0.8 m below the soil surface, to bury four unglazed pottery pipes for drainage at intervals of 7.5 m, parallel to the long axis of the field, with a slope of 1:500. The pipe trenches were then back-filled with rice husks as filter material up to 0.2 m depth below the soil surface. The lower ends of the pipes were equipped with control valves to control water drainage and the drained water was discharged to a drainage canal located between 1.0 and 1.2 m below the soil surface.
Survey of soil profiles of paddy fields
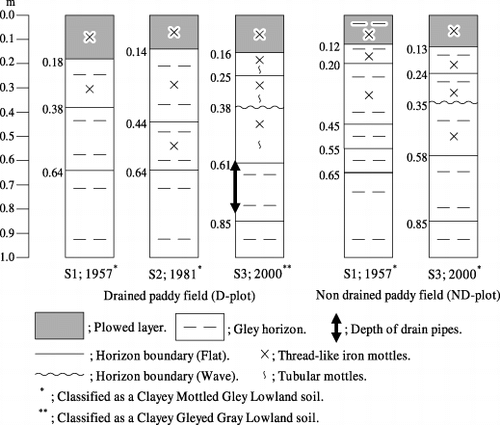
A first, governmental-supported, soil survey (S1 in ) was made in 1957 within the context of a fertilizer application improvement program (CitationNiigata Agricultural Research Institute 1957). These vertical soil profiles (one per every 12.5 ha; sampling grid size 353.5 m × 353.5 m) included soil profiles for the two sites now designated D-plot and ND-plot. A second soil survey (S2 in ), limited to the vicinity of the current D-plot, was conducted in 1981 (CitationNiigata Prefecture 1982), and was used in the design for the farmland improvements made in 1983–1984 (CitationNiigata Prefecture 1983, Citation1984). The ND-plot was not examined in this second soil survey. A third soil survey (S3 in ) was carried out in October 2000, in the second year of our study, on both the D- and the ND-plot paddy fields: 1 m × 1 m observation pits were dug and the soil horizons were described according to the classification of cultivated soils in Japan (CitationClassification Committee of Cultivated Soils 1996).
Rice cultivation and field management
The experimental paddy fields belonged to two local farmers, whose management of their respective fields followed very similar conventional practices. Rice seedlings (Oryza sativa L., cv. Koshihikari) were transplanted to the paddy fields according to conventional methods. In each cropping season, the fields received 50 kg ha−1 each of N, P2O5 and K2O, the former as ammonium sulfate split 60:40 between a basal dressing before tillage and submergence, and a topdressing at the booting stage, and the latter two in a single basal dressing before tillage and submergence. In both the D-plot and the ND-plot, a single rice crop was grown in each year of the experiment. During the mid-summer drainage period, seeking to suppress rice plant growth to avoid over luxuriant growth, local area farmers usually make shallow ditches in the topsoil to dry up the plowed layer until little cracks are formed. Mid-summer drainage began 10 days before the maximum tilling stage and the fields were re-flooded with intermittent irrigation 20 days before the heading stage and topdressing. After the heading stage, intermittent drainage was carried out for 25 days. The unhulled rice crop was harvested approximately 40 days after the heading stage using a head-feeding combine. The rice straw was automatically cut into roughly 0.1 m lengths, scattered across the surface of the fields (approximately 7 t ha−1), and, in late September to early October, incorporated into the topsoil (from the soil surface to 0.05–0.10 m) using a rotary tiller.
Operation of the subsurface drainage system
Following the farmers’ conventional farming operations, the drainage system's valves in the D-plot were held open in early spring from the start of snowmelt to submergence, during the mid-summer drainage, and between the final pre-harvest drainage and the first snows. Valves were closed during the snowy season to save the filter material from decay and, thus, maintain its functionality. For example, valves were closed from 23 November 2000 to 26 March 2001, and then opened from 27 March to 22 April 2001, 28 June to 9 July 2001 and 11 August to 25 November 2001.
Methane flux measurements
During the rice-growing season, the CH4 flux from the standing water/soil surface to the atmosphere was measured in each paddy field, in duplicate, once per week at approximately 10:00 am. Measurements were made using the closed chamber method of CitationMinami and Yagi (1988). Duplicate polycarbonate chambers (0.6 m × 0.6 m base, 0.5 or 1.0 m height) were placed in the paddy fields, enclosing eight rice plants each, and the air in each chamber was collected in polyvinyl fluoride sampling bags at 0, 15 and 30 min after chamber placement. The CH4 concentration in the bags was quantified using a gas chromatograph (GC-14A; Shimadzu Corporation, Kyoto, Japan) equipped with a gas sampler (MGS-5; Shimadzu Corporation) and a flame ionization detector (FID). The air sample (5 mL) was injected and separated on a Molecular Sieve 5A column (2.6 mm internal diameter × 2.0 m; Shinwa Chemical Industries, Kyoto, Japan). Standard gas mixes of 9.96 and 99.3 p.p.m.v CH4 in N2 (Nihon Sanso Co., Ltd., Tokyo, Japan) were used to calibrate the gas chromatograph at each analysis.
Soil redox potential
Soil redox potential (Eh) in each paddy field was monitored weekly over the rice-growing season. In both the D-plot and the ND-plot, six replicate platinum-tipped electrodes were inserted into the soil to a depth of 0.05 m after transplanting and remained there throughout the cultivation period. The soil Eh was determined using a portable ORP meter (D-52 pH-ORP meter, Horiba Ltd., Kyoto, Japan).
Soil chemical analysis
For both paddy fields, soil samples were collected from the plowed layer (0–0.15 m) in April 2000 and 2001 before basal fertilization and submergence, and in October 2000 after harvest and before rice straw incorporation.
Fresh soil samples were air-dried, ground and passed through a 2 mm sieve. Total carbon and total nitrogen contents were determined using an automated combustion system (Perkin Elmer 2400 Elemental CHN analyzer, Perkin Elmer Inc., Waltham, MA, USA). Hot water extractable carbon (HWEC) content was measured using a modified method from CitationTirol-Padre et al. (2005); 50 mL deionized–distilled water was added to 1 g air-dried soil and the mixture was boiled at 121C for 1 h in an autoclave. The mixture was centrifuged at 10,000 g for 10 min to obtain a clear HWEC-bearing supernatant, which was then analyzed for HWEC content using the Anthron-H2SO4 method (CitationMatsumoto et al. 2002).
Free ferric iron (Fe2O3) content in the soils was determined using the Na2S2O4–ethylenediamine-tetraacetic acid (EDTA) method (CitationAsami and Kumada 1959); 100 mL of 0.02 mol L−1 EDTA, 2 g air-dried soil and 3 g sodium hydrosulfite were mixed and boiled at 70C for 15 min in a water bath. The mixture was filtered (Paper filter type 5B, Advantec Toyo, Kaisha, Ltd., Tokyo, Japan) to obtain a clear extract in which the concentration of free ferric iron was determined using spectrophotometric analysis.
In 1999 and 2000, fresh soil cores (one per plot) were collected in polyethylene cylinders (75 mm diameter, 150 mm height) 3–6 days before submergence and twice during the period of submergence from the plowed layer of each paddy field. An additional pre-submergence sample was taken in April 2001. Immediately after sampling, the tops and bottoms of the cylinders were sealed with polypropylene covers, and the cylinders were placed in a water bath to avoid oxidation by air during transportation to the laboratory. In the laboratory, the soil samples were passed through a 2 mm sieve and a fresh 5 g soil sample was immediately extracted using 50 mL of sodium acetic acid buffer (pH 3.0, 1 mol L−1; CitationKumada and Asami 1958). The ferrous iron (Fe2+) concentration in the extract was determined using the 2,2,-bipyridyl spectrophotometric method.
Soil moisture contents were determined after drying at 105C for 24 h from the same fresh soil samples collected for iron analysis 3–6 days before the first submergence in each paddy field.
Soil physical analysis
In April 2000, prior to basal fertilization and submergence, soil core samples of 100 cm3 in volume were collected in triplicate from each of the 0.10–0.15, 0.25–0.30 and 0.45–0.50 m soil horizons at one sampling site in each plot using a soil sampler (DIK-1630, Daiki Rika Kogyo Co. Ltd., Kounosu, Japan). The three phase distributions, saturated hydraulic conductivities and bulk densities were determined using the standard methods of the CitationJapanese Society of Soil Science and Plant Nutrition (1997). Solid and liquid phases of soil samples were measured using a volumenometer (DIK-1120, Daiki Rika Kogyo Co. Ltd.). Then, after the soil core samples were saturated with distilled water under –26.6 kPa of vacuum for 24 h, saturated hydraulic conductivities were measured using a falling-head permeameter (DIK-4050, Daiki Rika Kogyo Co. Ltd.), the raw data were subsequently adjusted to a reference temperature of 15C. The soil core samples were then placed on a ceramic pressure plate (DIK-3421, Daiki Rika Kogyo Co. Ltd.) and submitted to 3.1 kPa of pressure for 12 h. The weights of the samples were then measured and the three phase distributions
Figure 2 Changes in soil profiles of a drained paddy field (D-plot) relative to a non-drained paddy field (ND-plot) as a result of the implementation of a subsurface drainage system in a paddy field located in Niigata Prefecture, Japan. S1, S2 and S3 refer to soil surveys conducted in 1957, 1981 and 2000, respectively.
Groundwater level
Groundwater level was continuously monitored in the two rice paddy fields from October 2000 to September 2001. A pressure-type groundwater level gauge was inserted into the soil to a depth of 1.5 m and the data were automatically recorded using a data logger (WW4437 and Field µ, Yokogawa Denshikiki Co. Ltd., Tokyo, Japan).
Statistical analysis
Statistical analysis was carried out using SPSS for Windows version 10J software (SPSS 2000). A one-way anova was used to test CH4 emission and the proportion of ferrous iron across two effects (presence or absence of subsurface drainage pipes and experimental period). When a significant difference (P ≤ 0.05) was found, the mean values were compared using a Student's t-test (P ≤ 0.05 or 0.01).
RESULTS
Soil profiles of paddy fields in the presence or absence of pipe drainage systems
In a 1957 soil survey (S1 in ), the gley soil layers of the current D-plot and ND-plot were found to be in or just below the surface plowed layer (). The soil in both paddy fields’ soils was classified as Clayey Mottled Gley Lowland soil. Both profiles bore thread-like iron mottles extending from the soil surface to between 0.38 and 0.45 m in depth. In 1981, prior to its improvement and the installation of a subsurface drainage system (S2 in ), the soil in the present D-plot was surveyed (). Still classified as a Clayey Mottled Gley Lowland soil, with its gley soil layer located at a minimum depth of 0.14 m, just below the surface plowed layer, it bore thread-like iron mottles extending from the soil surface to approximately 0.64 m depth. Finally, in 2000, when both plots were surveyed (S3 in ), the top of the gley soil layer in the ND-plot and the D-plot occurred at depths of 0.13 m and 0.61 m, respectively (), highlighting the downward shift of the upper limit of the gley soil layer to the subsoil in the D-plot, subsequent to its improvement and drainage. The D-plot's tubular mottles now extended from 0.25 to 0.61 m below the soil surface, with its soil now classified as a Clayey Gleyed Gray Lowland soil (). In contrast, the soil classification and profile of the ND-plot remained unchanged from 1957 to 2000.
Soil chemical and physical properties
Averaged across the sampling dates of April 2000, October 2000 and April 2001, total carbon, total nitrogen, hot water extractable carbon and free iron oxide were significantly greater (P ≤ 0.01, t-test) in the ND-plot soil than in the D-plot soil (). In both the
Table 1 Soil chemical and physical properties of a subsurface drained paddy field (D-plot) and a non-drained paddy field (ND-plot) located in Niigata Prefecture, Japan
Methane fluxes in rice-growing seasons
The CH4 flux from the ND-plot was almost always higher than that from the D-plot during each of the rice-growing seasons (). In 1999 and 2000, the CH4 flux from the ND-plot began to increase rapidly even at the early growth stages, but in 2001 both plots had CH4 fluxes of similar magnitude in the early growth stage. However, in 2001 mid-summer drainage started in the middle of June in both plots, which was 2 weeks earlier than in the previous 2 years because of fast rice
Figure 3 Rice-growing season CH4 emission rate (1999–2001) from a subsurface drained paddy field (D-plot, dotted line) and a non-drained paddy field (ND-plot, solid line) located in Niigata Prefecture, Japan. Bars indicate the range of the measured values. Arrows indicate the time of agricultural management operations. D, drainage; H, harvest; II, intermittent irrigation; MD, mid-summer drainage; TP, transplanting.
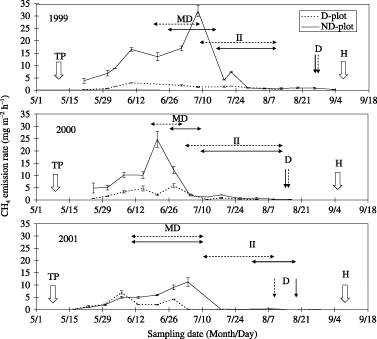
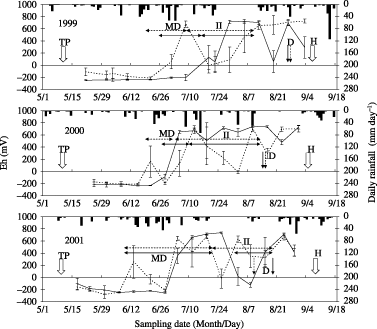
Figure 4 Soil redox potential (Eh) and daily rainfall in 1999–2001 for a subsurface drained paddy field (D-plot, dotted line) and a non-drained paddy field (ND-plot, solid line) located in Niigata Prefecture, Japan. Bars indicate standard deviation (n = 6). Arrows indicate the time of agricultural management operations. D, drainage; H, harvest; II, intermittent irrigation; MD, mid-summer drainage; TP, transplanting.
Soil redox potential
In the early rice-growing season, soil Eh was slightly higher in the D-plot than in the ND-plot in 1999, but in 2000 and 2001 soil Eh was similar in both plots at this time (). In 1999, 2000 and 2001, the number of days from the start of mid-summer drainage, when soil Eh was roughly –200 mV in both plots after a long period of submergence, to when it reached 0 mV was 15, 4 and 3 days, respectively, in the D-plot, and 22, 6 and 24 days in the ND-plot (). In 2000, because of higher air temperatures and less precipitation, the rise in the ND-plot's soil Eh after the mid-summer drainage was greater than that recorded in either 1999 or 2001. As a result, the decrease in CH4 flux after its initial post-drainage peak occurred sooner in 2000 than in 1999 and 2001 (). After the mid-summer drainage soil Eh was mostly positive and much higher than before the mid-summer drainage.
Inter-annual variation in total methane emissions
The total CH4 emissions from the D-plot during the rice-growing season were significantly lower than the
Table 2 Total CH4 emissions during rice-growing seasons from a subsurface drained paddy field (D-plot) and a non-drained paddy field (ND-plot) located in Niigata Prefecture, Japan
Ferrous iron concentration in soils
Ferrous iron concentrations in the wet soil of the plowed layer, collected 3–6 days before submergence and on two dates during submergence (i.e. before the mid-summer drainage) in 1999 and 2000, were much higher in the ND-plot than in the D-plot (). However, in 2001, the Fe2+ concentration in soil collected 6 days before submergence was similar for both plots. The Fe2+ concentrations were converted to concentrations of iron oxide (Fe2O3), and the ratios of ferrous iron (as iron oxide) to free iron oxide concentration in dried soil (: 11.39 and 13.00 g kg−1 dry weight for the D-plot and ND-plot, respectively) were calculated. In 1999 and 2000, 3–6 days before submergence, the ratios for the D-plot were only 0.4 and 3.4%, respectively, but under submergence the ratios gradually increased to 25.2 and 38.4%, respectively. In contrast, in the ND-plot the 1999 and 2000 ratios were 52.3 and 50.6%, respectively, 3–6 days before submergence, and showed little or no rise during the submergence period. However, in 2001, the pre-submergence ratios in the D-plot and ND-plot were almost equal at 7.3 and 9.7%, respectively ().
Table 3 Dry weight basis ferrous iron (Fe2+) concentration and ratio of ferrous iron (as iron oxide) to free iron oxide in the wet plowed layer of a subsurface drained paddy field (D-plot) and a non-drained paddy field (ND-plot) located in Niigata Prefecture, Japan
Table 4 Soil moisture content 3–6 days before submergence and precipitation-related climatic parameters for the period from snow thaw to submergence for a subsurface drained paddy field (D-plot) and a non-drained paddy field (ND-plot) located in Niigata Prefecture, Japan
Soil moisture, groundwater level and rainy days
Soil moisture contents of soils collected 3–6 days before the first submergence in early spring in the D-plot ranged from 323 to 370 g kg−1 over the 3 years, much lower than the values recorded in the ND-plot (455–643 g kg−1; ). The number of rainy days and the soil moisture content in the period between snow thaw and submergence decreased from 1999 to 2001 for both plots.
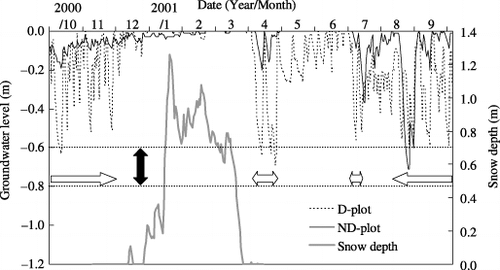
In the fallow seasons (October–May), both plots were covered by snow in winter and flooded with snowmelt water in early spring. Groundwater level in the D-plot was dependant on when the valves of the drainage pipes were open or closed. Frequently dropping to more than 0.5 m below the soil surface when the valves were open (harvest–23 November 2000, 27 March–23 April 2001, 28 June–10 July and 11 August–first snowfall), the groundwater level of the D-plot was lower than that of the ND-plot (). However, the groundwater level during the closed-valve period (23 November 2000–27 March 2001) was only 0.05 m below the soil surface and very similar to that in the ND-plot.
Tiller numbers and grain yield of rice plants
The heights of rice plants over the same growth periods were very similar in both plots. Over the 3 years of the present study, tiller numbers at the maximum tiller stage averaged 557 m−2 in the D-plot and 423 m−2 in the ND-plot. Consequently, panicle numbers at harvest were greater in the D-plot than in the ND-plot. Grain yields of brown rice from 1999 to 2001 were 5.7, 5.5 and 5.0 t ha−1 in the D-plot, and 4.6, 5.2 and 5.4 t ha−1 in the ND-plot, which represented typical grain yields for this area. No significant differences in grain yields were found between the D-plot and the ND-plot in these experiments.
Figure 5 Snow depth (bold line) and groundwater level for a subsurface drained paddy field (D-plot, dotted line) and a non-drained paddy field (ND-plot, solid line) located in Niigata Prefecture, Japan, from October 2000 to September 2001. White arrows indicate the period when the valves of the drainage pipes in the D-plot were open. The black arrow and straight dotted lines indicate the depth of the drainage pipes.
DISCUSSION
Methane emissions during the rice-growing season
Although water management during the rice-growing season and organic matter application were similar for both plots, the CH4 emissions during the rice-growing season from the ND-plot were almost always greater than those from the D-plot. This strongly suggests that there must be some other important factors controlling CH4 emissions from rice paddy fields throughout the year.
Several investigators have reported that CH4 emissions from paddy fields were decreased by the application of maturated organic material rather than fresh rice straw (CitationGoto et al. 2004; CitationInubushi et al. 1994). Other studies have achieved similar decreases in emissions through water management, such as mid-summer drainage and intermittent irrigation, rather than continuous flooding over the rice-growing season (CitationIshibashi et al. 1997; CitationKumagai et al. 2000; CitationYagi et. al. 1996). However, in the present experiment, similar amounts of fresh rice straw were incorporated into both plots after the previous autumn harvest. In addition, water management in both plots was very similar, such as mid-summer drainage and intermittent irrigation. Furthermore, CH4 emissions during the rice-growing seasons in both plots were concentrated in the periods from submergence to the end of mid-summer drainage. These results strongly suggest that the differences in CH4 emissions in both plots were attributed to changes in soil conditions as a result of the installation of the subsurface drainage system in the D-plot. In the following sections, the contributions of changes in soil conditions to the CH4 emissions are discussed in detail.
Long-term effects of a subsurface drainage system on soil profile in rice paddy fields
Based on , it is reasonable to assume that in 1957 there was no major difference in the physical/chemical conditions between D-plot and ND-plot soils (S1 in ,). At that time, both plots were classified as clayey mottled gley lowland soils. Similarly, in the 1981 soil survey of the D-plot, prior to the improvements in 1983–1984 and subsequent installation of a subsurface drainage system in 1989, the plot's profile was still classified as a Clayey Mottled Gley Lowland soil. However, according to the third soil survey in 2000, the D-plot was now classified as a Clayey Gleyed Gray Lowland soil, while that of the ND-plot remained a Clayey Mottled Gley Lowland soil. The gley soil layer in the ND-plot was shown to be just under the plowed soil (below 0.13 m depth), which was the same as in 1957. However, in the D-plot, the gley soil layer only appeared below 0.6 m depth, where the drainage pipe system was located. These surveys clearly indicate that the D-plot soil profiles changed as a result of the installation of a subsurface drainage system.
In addition, tubular mottles were only observed in the subsoil layer of the D-plot in 2000. Tubular mottles are formed under alternate reducing and oxidizing conditions caused by fluctuations in groundwater levels (CitationClassification Committee of Cultivated Soils 1996). In contrast, thread-like mottles were observed in all the soil profiles, not only in the plowed layer but also in the subsoil layer of both plots. These thread-like mottles are formed by leaching of irrigated water in which iron and manganese are reduced under flooding conditions in rice paddy fields (CitationJapanese Society of Pedology 1997). This indicates that the formation of thread-like mottles was independent of the subsurface drainage system. These findings also strongly suggest that as a result of the installation of pipe drainage in 1989, the groundwater level in the D-plot sank to the level of the drainage pipes, and that the soil above the drainage pipes shifted from a reductive to an oxidative state when pipe drainage valves were open. In the ND-plot, however, the groundwater level had not changed since 1957 and the soil below the plowed layer remained under reductive conditions until the start of this experiment. These observations demonstrate that the installation of drainage pipes in the D-plot improved soil drainage conditions from poorly drained to well-drained or moderately drained soil conditions.
Long-term effects of a subsurface drainage system on soil properties and methane emissions
The quantity of total soil carbon in the ND-plot was greater than that in the D-plot (). In general, the transformation of poorly drained paddy fields into well-drained fields causes soil organic matter to decompose faster under the newly imposed aerobic conditions (CitationInubushi and Anzai 2001). Therefore, the installation of a subsurface drainage system in the D-plot would have led to a decrease in pre-existing soil organic carbon and inhibited the accumulation of soil organic carbon, even after the application of fresh organic matter, such as rice straw.
In contrast, reducible iron (iron oxide) in the D-plot would have been leached out in the drained water as ferrous iron, resulting in less free iron oxide in that plot (). Water management practices, such as mid-summer drainage or intermittent irrigation, and subsurface drainage systems can accelerate the leaching of reducible iron (CitationKimura et al. 1992; CitationTakai et al. 1974). Leaching out of the electron acceptor, particularly the reducible iron, not only decreases its suppressing effect on CH4 production in paddy fields but also results in the degradation of paddy fields (CitationYanagisawa 1978). Application of iron materials, such as iron slag, to low-iron paddy fields is a possible countermeasure to replenish leached iron and increase the oxidation capacity in the soil (CitationFurukawa and Inubushi 2004). However, in this study, notwithstanding that the dry basis amount of free iron oxide in the ND-plot was greater than that in the D-plot, CH4 emissions were much higher in the ND-plot. This suggests that in the ND-plot the free iron oxide, measured on a dry basis, was not effective in suppressing CH4 production and that in the case of poorly drained paddy fields free iron oxide alone cannot serve as the sole indicator of the potential to suppress CH4 production, as has previously been proposed (CitationFurukawa and Inubushi 2004; CitationYanagisawa 1978). The contribution of the free iron oxide to the CH4 emissions/production will be discussed in detail in the following section.
The saturated hydraulic conductivity of the D-plot's subsoil layers (0.25–0.30 m and 0.45–0.50 m depth) greatly exceeded that recorded in the ND-plot, as well as that in the D-plot's plowed layer. In contrast, the saturated hydraulic conductivity in the ND-plot was very low in both the subsoil layers and plowed layer, indicating that the installation of a subsurface drainage system greatly enhanced soil permeability in a previously poorly drained paddy field. CitationInubushi et al. (1992) reported that CH4 emissions from flooded paddy soils were suppressed by high percolation rates. This suggests that high soil permeability during mid-mummer drainage (a period when the drainage valves were open) suppressed CH4 emissions from the D-plot more than from the ND-plot.
Short-term effects of a subsurface drainage system on methane emissions
Easily decomposable organic carbon, derived from fresh rice straw incorporated in the previous autumn, is usually the major substrate for the CH4 produced in the following rice-growing season. During the fallow season, the plowed layer in the D-plot would have been in a more highly oxidized condition than that of the ND-plot. In addition, the concentration of hot water extractable carbon was much lower in the D-plot (), suggesting that during the fallow season the rate of aerobic decomposition of easily decomposable organic carbon was greater in the D-plot than in the ND-plot.
In the D-plot, the soil immediately above the level of the drainage pipes was oxidized when the valves of the pipes were open from the final pre-harvest drainage to the first snow fall, and again from snow thaw to the first submergence for paddling. In these periods of the fallow season, the groundwater level in the D-plot fell to the drainage pipe level (0.6 m deep), while that in the ND-plot did not fall below the level of the subsoil (). In the D-plot, the concentration of ferrous iron was very low 3–6 days before submergence, and gradually increased during submergence. This might have been because of the quick oxidation during the fallow season of part of the free iron oxide and most of the Fe2+ produced during the rice-growing season to ferric iron (Fe3+). In contrast, in the ND-plot, possibly because the constantly reductive conditions in the fallow season would prevent most of the ferrous iron from being oxidized, a large amount of ferrous iron already existed just prior to submergence in 1999 and 2000. Furthermore, after submergence, the amount of ferrous iron in the ND-plot barely increased, with ratios of free iron oxide ranging from 52.3 to 66.7% in 1999, and from 50.6 to 60.1% in 2000 (,). This suggests that approximately 60% of the free iron oxide in the ND-plot soil might be bio-available iron, and that most of the oxidizing function of the bio-available iron in the ND-plot was likely to be already inactivated before submergence. In 2001, the pre-submergence quantity of ferrous iron in both plots was very similar. The much lower quantity of ferrous iron in the ND-plot in 2001 compared with the previous 2 years was matched by similarly lower CH4 emissions. In general, ferric iron is the most important electron accepter in paddy soils. Under initial submergence conditions organic carbon in paddy soil is decomposed to CO2 with the reduction of ferric iron to ferrous iron. After most of the ferric iron has been reduced or leached, soil organic carbon is then decomposed to produce CH4 under absolute reductive conditions (CitationInubushi et al. 1984; CitationTakai 1980). This strongly supports the idea that the ratio of ferrous iron to free iron oxide is an important factor that should be studied when assessing CH4 production and emissions from poorly drained paddy fields.
In all 3 years (1999–2001), the number of days it took from the start of mid-summer drainage for soil Eh to reach 0 mV was less for the D-plot than the ND-plot (), indicating that soil in the D-plot was more quickly oxidized than soil in the ND-plot. Saturated hydraulic conductivities of the subsoil layers, volumetric solid contents and bulk densities were greater in the D-plot than in the ND-plot (). In addition, the concentrations of ferrous iron in the soils of the ND-plot before mid-summer drainage were greater than those in the D-plot (). Accordingly, much more oxidative potential was required to oxidize ferrous iron to ferric iron and to raise the soil Eh in the ND-plot compared with the D-plot. This explains why, after mid-summer drainage began, CH4 flux peaks in the ND-plot were greater than in the D-plot ().
Consequently, in our study, the potential decomposition rate of fresh soil organic matter during the fallow season was much greater in the D-plot than in the ND-plot, due largely to the oxidized conditions generated by the D-plot's subsurface drainage system. After submergence and subsequent mid-summer drainage, the potential decomposition rate, which was coupled to the reduction of ferric iron, was much higher in the D-plot than in the ND-plot. After mid-summer drainage, the soil in the D-plot could, therefore, be more quickly oxidized than soil in the ND-plot. In the rice-growing season, the CH4 emissions from the ND-plot were, therefore, larger than those from the D-plot, even though the same amount of rice straw was applied and incorporated to both plots after the pervious year's harvest.
Effects of soil moisture in early spring before submergence on inter-annual variation in methane emissions
Soil moisture in the plowed layer in April, before submergence, was positively correlated with CH4 emissions from paddy fields during the following rice-growing seasons (r2 = 0.946; ). During a fallow season between rice straw incorporation in the previous autumn and first submergence, the groundwater level in the D-plot frequently fell to the drainage pipe depth when
Figure 6 Relationship between soil moisture content 3–6 days before submergence (19 April, 20 April and 12 April for 1999, 2000 and 2001, respectively) and CH4 emissions during the subsequent rice-growing season for a subsurface drained paddy field (D-plot, ○) and a non-drained paddy field (ND-plot, •) located in Niigata Prefecture, Japan. **P ≤ 0.01.
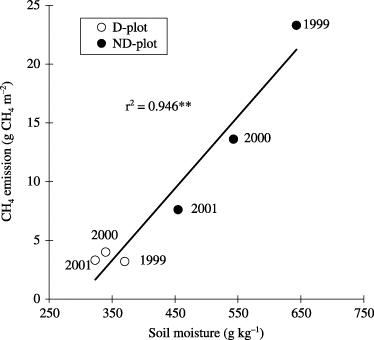
As a result of its poor drainage, the soil moisture in the ND-plot was positively correlated with the number of rainy days in early spring (). Thus, in the ND-plot, soil moisture in the plowed layer prior to submergence could have affected the CH4 emission rate in the following rice-growing season. In the D-plot, however, soil moisture remained very low during the 3 years because of the quick removal of snowmelt and rain water through the drainage pipes, resulting in almost no relationship existing between soil moisture and the number of rainy days. Compared to the D-plot, aerobic decomposition in the ND-plot would have been inhibited because of its high soil moisture content. In 2000, the number of rainy days in the period from snow thaw to submergence was 14 (), similar to the 30-year average for Nagaoka (1971–2000). However, in the same period in 2001, there were only seven rainy days with a total rainfall of 29 mm, which was much lower than the 30-year average. Therefore, in 2001 the soil was unusually dry during this period, which could have strongly affected its reduction–oxidation potential and the concentration of ferrous iron in the soils before submergence ().
Methane emissions from potted rice paddy soil maintained at a WHC of 50% were reduced by 50–86% by incorporating rice straw 1–2 months versus immediately before submergence (CitationInubushi et al. 1994). Methane emissions from rice straw-amended potted soil collected from the surface of the paddy field in February (5 months after harvesting) were 15% less than the emissions from similarly amended soil collected in September (immediately after harvest; CitationWatanabe et al. 1993). According to a pot experiment, increases in soil moisture during the fallow season also increase CH4 emission, production and oxidation within the subsequent rice-growing season (CitationXu et al. 2003). The present experiment also showed that the previous soil water content was positively correlated with soil organic carbon content before rice transplantation, and the mean CH4 flux and its production rate in the rice-growing season were positively correlated. Poorly drained rice fields in Chongqing, China, which were permanently flooded during the fallow season, emitted much more CH4 in the following rice-growing season than did rice fields where standing water was drained in the fallow season or where a winter crop was planted (CitationCai et al. 2003). These reports indicate that easily decomposable soil organic carbon and materials incorporated into the drained rice paddy field could be aerobically decomposed before submergence, and a large amount of ferrous iron could be oxidized under low soil moisture conditions in the fallow season, resulting in a decrease in CH4 emission during the following rice-growing season.
Conclusion
The CH4 emissions from the drained field were much lower than from the non-drained field despite similar field and crop management practices. The reasons for these differences in emissions were:
| 1. | Installation of a subsurface drainage system into the previously non-drained field lowered the gley soil layer to the level of the drainage pipe and enhanced the permeability of the subsoil layer, allowing aerobic conditions to prevail, whereas in the non-drained field, the gley soil horizon remained just below the plowed layer. | ||||
| 2. | Accordingly, the long-term effects of subsurface drainage on substrates of CH4 would include a gradual decrease in the magnitude of the original pre-drainage soil organic carbon pool and an inhibition of subsequent accumulation of soil organic carbon, compared to what occurred throughout the year under the continuously reductive conditions of the non-drained field. | ||||
| 3. | The short-term effect of a subsurface drainage system could be attributed to the much lower content of hot water extractable carbon as a result of the fast decomposition of fresh rice straw incorporated into the plowed layer after harvest under the more oxidized conditions prevailing in the drained field compared with the non-drained field. | ||||
| 4. | Furthermore, the aerobic conditions in the drained field compared with the non-drained field meant that, prior to submergence, most free iron oxide in the drained field existed as ferric ions, which were reduced after flooding and acted as an electron accepter, helping to suppress CH4 production. In contrast, the ratio of ferrous iron to free iron oxide in the plowed soils in the non-drained field was still approximately 60% before submergence, and scarcely increased after submergence. This large fraction of ferrous iron in the non-drained field soil could represent bio-available iron, of which the oxidizing function was possibly already inactivated before the first submergence. This strongly suggests that the ratio of ferrous iron to free iron oxide may be a better indicator of the likely CH4 emission/production than the amount of free iron oxide. | ||||
In the currently reported 3-year field experiment, only the non-drained field showed a large inter-annual variation in CH4 emissions, which was positively correlated to soil moisture content in the plowed layer before submergence in early spring. In contrast, in every year the drained field showed much lower soil moisture content prior to submergence because of the effective drainage of precipitation/snowmelt by the subsurface drainage system, contributing to the much lower CH4 emission in the subsequent rice-growing season.
ACKNOWLEDGMENTS
The Rural Development Bureau of the Ministry of Agriculture, Forestry and Fisheries of Japan funded this work from 1999 to 2001 through the project “Basic field study on mitigation options for greenhouse gas emissions from rice paddy fields”. We heartily thank Noboru Kaji, a research investigator associated with the Japanese Soil Association for his arrangement of field experiments and participation in committee meetings. We are also grateful to Dr I. P. McTaggart, Department of Global Agricultural Sciences, The University of Tokyo, for his helpful comments on this paper.
Notes
Present addresses: Crop and Environmental Sciences Division, International Rice Research Institute, Philippines.
Center for Climate System Research, The University of Tokyo, Kashiwa, Chiba 277-8568, Japan.
Related Research Data
References
- Asami , T and Kumada , K . 1959 . Comparison of several methods for determining free iron in soils . Soil Plant Food , 5 : 179 – 183 .
- Cai , Z , Tsuruta , H , Gao , M , Xu , H and Wei , C . 2003 . Options for mitigating methane emission from a permanently flooded rice field . Global Change Biol , 9 : 37 – 45 .
- Classification Committee of Cultivated Soils . 1996 . Classification of Cultivated Soils in Japan Third approximation , Tsukuba : National Institute of Agro-environmental Sciences .
- Furukawa , Y and Inubushi , K . 2004 . Evaluation of slag application to decrease methane emission from paddy soil and fate of iron . Soil Sci. Plant Nutr , 50 : 1029 – 1036 .
- Garcia , JL , Patel , BKC and Ollivier , O . 2000 . Taxonomic, phylogenetic, and ecological diversity of methanogenic archaea . Anaerobe , 6 : 205 – 226 .
- Goto , E , Miyamori , Y , Hasegawa , S and Inatsu , O . 2004 . Reduction effects of accelerating rice straw decomposition and water management on methane emission from paddy fields in a cold district . Jpn. J. Soil Sci, Plant Nutr , 75 : 191 – 201 . (in Japanese with English summary)
- Hasegawa , S and Tabuchi , T . 1995 . “ Well facilitated paddy fields in Japan ” . In Paddy Fields in the World , Edited by: Hasegawa , S and Tabuchi , T . 103 – 124 . Tokyo : The Japan Society of Irrigation, Drainage and Reclamation Engineering .
- Inoue , H and Tokunaga , K . 1995 . “ Soil and water management ” . In Paddy Fields in the World , Edited by: Hasegawa , S and Tabuchi , T . 303 – 325 . Tokyo : The Japan Society of Irrigation, Drainage and Reclamation Engineering .
- Intergovernmental Panel on Climate Change . 2001 . Climate Change 2001: The Scientific Basis. Contribution of Working Group I to the Third Assessment Report of the Intergovernmental Panel on Climate Change , Edited by: Houghton , JT , Ding , Y Griggs , DJ . Cambridge : Cambridge University Press .
- Inubushi , K and Anzai , T . 2001 . “ Characteristics and improvements of the poor paddy soils. Paddy fields soils ” . In Introduction to Soil Science , Edited by: Inubushi , K and Anzai , T . 141 – 142 . Tokyo : Asakura-shyoten . (in Japanese)
- Inubushi , K , Muramatsu , Y and Umebayashi , M . 1992 . Influence of percolation on methane emission from paddy soil . Jpn. J. Soil Sci, Plant Nutr , 63 : 184 – 189 . (in Japanese with English summary)
- Inubushi , K , Muramatsu , Y and Umebayashi , M . 1994 . Effect of incorporation-timing of rice straw on methane emission from paddy soil . Jpn. J. Soil Sci, Plant Nutr , 65 : 22 – 26 . (in Japanese with English summary)
- Inubushi , K , Wada , H and Takai , Y . 1984 . Easily decomposable organic matter in paddy soil IV. Relationship between reduction process and organic matter decomposition . Soil Sci. Plant Nutr , 30 : 189 – 198 .
- Ishibashi , E , Akai , N , Itoshima , Y , Kawanaka , K and Yanai , M . 1997 . Effect of soil type and water management on methane emission from paddy fields in Okayama prefecture . Jpn. J. Soil Sci. Plant Nutr , 68 : 417 – 422 . (in Japanese with English summary)
- Japanese Society of Pedology . 1997 . “ Mottling and concretion ” . In Soil Survey Hand Book , Revised Edition , Edited by: Japanese Society of Pedology . 63 – 69 . Tokyo : Hakuyu-sha . (in Japanese)
- Japanese Society of Soil Science and Plant Nutrition . 1997 . “ Soil Physical Analyses ” . In Soil Environmental Analyses , Edited by: Editorial Committee of Soil Environmental Analyses, Japanese Society of Soil Science and Plant Nutrition . 21 – 92 . Tokyo : Hakuyu-sha . (in Japanese)
- Kimura , M , Miura , Y , Watanabe , A , Katoh , T and Haraguchi , H . 1991 . Methane emission from paddy field (Part 1). Effect of fertilization, growth stage and mid-summer drainage: Pot experiment . Environ. Sci , 4 : 265 – 271 .
- Kimura , M , Miura , Y , Watanabe , A , Murase , J and Kuwatsuka , S . 1992 . Methane production and its fate in paddy fields I Effects of rice straw application and percolation rate on the leaching of methane and other soil components into the subsoil . Soil Sci. Plant Nutr , 38 : 665 – 672 .
- Kimura , M , Murase , J and Yahai , L . 2004 . Carbon cycling in rice field ecosystems in the context of input, decomposition and translocation of organic materials and the fates of their end products (CO2and CH4 . Soil Biol. Biochem , 36 : 1399 – 1416 .
- Kubota , M . 1992 . Reasonable application of rice straw to wet and semiwet paddy fields with heavy clay soil in Niigata . J. Niigata. Agric. Exp. Stn , 39 : 1 – 90 . (in Japanese with English summary)
- Kumada , K and Asami , T . 1958 . A new method for determining ferrous iron in paddy soils . Soil Plant Food , 3 : 187 – 193 .
- Kumagai , K , Konno , Y and Togashi , M . 2000 . Effects of water management attend to rice growth on methane emission . Jpn. J. Soil Sci. Plant Nutr , 71 : 643 – 650 . (in Japanese with English summary)
- Matsumoto , J , Minamiyama , Y , Akahori , S and Takahashi , K . 2002 . Suppression of methane emission from paddy field supplemented with organic matter . Jpn. J. Soil Sci. Plant Nutr , 73 : 315 – 318 . (in Japanese with English Summary)
- Minami , K and Yagi , K . 1988 . Method of measuring methane flux from rice paddies . Jpn. J. Soil Sci. Plant Nutr , 59 : 458 – 463 . (in Japanese with English Summary)
- Niigata Agricultural Research Institute . 1957 . Research Report on the Fertilizer Application Improvement Program.] The Nagaoka Area on the Shinano River Basin , Niigata : Niigata Agricultural Research Institute . (in Japanese)
- Niigata Prefecture . 1982 . Prefectural Land Improvement Project of the Second Yamakita Area , Nagaoka : Niigata Prefecture . (in Japanese)
- Niigata Prefecture . 1983 . Prefectural Land Improvement Project. The Second Yamakita Area. The First Work Block The first work , Nagaoka : Niigata Prefecture . (in Japanese)
- Niigata Prefecture . 1984 . Prefectural Land Improvement Project. The Second Yamakita Area. The First Work Block The seventh work , Nagaoka : Niigata Prefecture . (in Japanese)
- Niigata Prefecture . 1989 . Prefectural Land Improvement Project. The Second Yamakita Area. The Subsurface Drainage The first work , Nagaoka : Niigata Prefecture . (in Japanese)
- Niigata Prefecture . 2004 . 2004 – A Long-range Agriculture and Rural Development Plan in Niigata Prefecture , Niigata : Niigata Prefecture . (in Japanese)
- Rural Development Bureau, the Ministry of Agriculture, Forestry and Fisheries of Japan . 2003 . The Business Statistics of Agricultural Field Construction , Tokyo : Rural Development Bureau, the Ministry of Agriculture, Forestry and Fisheries of Japan . (in Japanese)
- Sass , RL , Fisher , FM , Wang , YB , Turner , FT and Jund , MF . 1992 . Methane emission from rice fields: The effect of floodwater management . Global Biochem. Cycles , 6 : 249 – 262 .
- Takai , Y . 1980 . Microbiological studies on dynamics in paddy soils 1 . Fertil. Sci , 3 : 17 – 55 . (in Japanese)
- Takai , Y , Wada , H , Kagawa , H and Kobo , K . 1974 . Microbial mechanism of effects of water percolation on Eh, iron, and nitrogen transformation in the submerged paddy soils . Soil Sci. Plant Nutr , 20 : 33 – 45 .
- Tirol-Padre , A , Tsuchiya , K , Inubushi , K and Ladha , JK . 2005 . Enhancing soil quality through residue management in a rice–wheat system in Fukuoka, Japan . Soil Sci. Plant Nutr , 51 : 849 – 860 .
- Tsutsuki , K and Ponnamperuma , FN . 1987 . Behavior of anaerobic decomposition products in submerged soils. Effects of organic material amendment, soil properties, and temperature . Soil Sci. Plant Nutr , 33 : 13 – 34 .
- Uoki , Y and Noda , S . 2001 . Suppression of methane emission from Strong-Gley soils paddy field by water managements . Jpn. J. Soil Sci. Plant Nutr , 72 : 449 – 452 . (in Japanese)
- Watanabe , A , Katoh , K and Kimura , M . 1993 . Effect of rice straw application on CH4emission from paddy fields I Effect of weathering of rice straw in the field during off-crop season . Soil Sci. Plant Nutr , 39 : 701 – 706 .
- Woese , CR , Kandler , O and Wheelis , ML . 1990 . Towards a natural system of organisms: proposal for the domains archaea, bacteria, and eucarya . Proc. Natl Acad. Sci. USA , 87 : 4576 – 4579 .
- Xu , H , Cai , Z and Jia , Z . 2003 . Effect of soil water contents in the non-rice growth season on CH4emission during the following rice-growth season . Nutr. Cycl. Agroecosys , 64 : 101 – 110 .
- Yagi , K . 2002 . “ Mitigation options for methane emissions in rice ” . In Encyclopedia of Soil Science , Edited by: Lal , R . 814 – 818 . New York : Marcel Dekker .
- Yagi , K and Minami , K . 1990 . Effect of organic matter application on methane emission from some Japanese paddy fields . Soil Sci. Plant Nutr , 36 : 599 – 610 .
- Yagi , K , Tsuruta , H , Kanda , K and Minami , K . 1996 . Effect of water management on methane emission from a Japanese rice paddy field: Automated methane monitoring . Global Biogeochem. Cycles , 10 : 255 – 267 .
- Yamaji , E , Kimura , K and Hirota , J . 1999 . “ Land consolidation and field layout ” . In Advanced Paddy Field Engineering , Edited by: Editorial Committee of Advanced Paddy Field Engineering . 175 – 210 . Tokyo : Shinan-sha Sci.& Tech. Publishing .
- Yanagisawa , M . 1978 . “ Degraded paddy soil ” . In Paddy Soil Science , Edited by: Kawaguchi , K . 425 – 431 . Tokyo : Kodan-sha . (in Japanese)
- Present addresses: Crop and Environmental Sciences Division, International Rice Research Institute, Philippines.
- Center for Climate System Research, The University of Tokyo, Kashiwa, Chiba 277-8568, Japan.