Abstract
Relationships between the elution characteristics and the spectrophotometric properties of water-soluble organic matter (WSOM) were investigated to understand the processes that leach dissolved organic matter (DOM) from the O horizon of a Haplorthod under an evergreen coniferous forest. In the present study undisturbed mor-type O horizon samples (900-cm2 basal area) were collected to exclude the additional yields of WSOM caused by physical disturbance. The WSOM was sequentially eluted from the samples by dripping ultra-pure water with a novel elution device to obtain sufficient amounts of WSOM powder for spectrophotometric characterization. The drip rate of the ultra-pure water and the elution time were kept constant at 150 mL min−1 and 1 h, respectively, and this elution of WSOM was repeated five times every hour. Based on the present methods, following elution the characteristics and spectrophotometric properties of WSOM demonstrated that: (1) the yields of WSOM obtained during five elution times were proportional to the carbon mass of the O horizon calculated on a unit area basis, (2) the presence of two different fractions in WSOM with different spectrophotmetric properties was clearly indicated by the elution characteristics where the fraction with low aromaticity, rich in carboxyl groups, was eluted faster than the fraction with relatively higher aromaticity, (3) the relative contribution of the Oi subhorizon to the intact O horizon in terms of the amount of eluted WSOM was small compared to the Oe and Oa subhorizons, (4) the Oa subhorizon appeared to be an important source of WSOM with relatively higher aromaticity than the Oe subhorizon.
INTRODUCTION
Water-soluble organic matter (WSOM) is operationally defined as the fraction of soil organic matter extracted with water or dilute salt solutions that passes through a 0.45-µm filter (CitationHerbert and Bertsch 1995; CitationKalbitz et al. 2000). Part of WSOM is generally considered to be the precursor to dissolved organic matter (DOM) present in a soil solution (CitationChantigny 2003; CitationKalbitz et al. 2000), most of which comes from the O horizon accumulated on the forest floor. Although WSOM and DOM account for only small portions of the total soil organic matter, they are now increasingly recognized as important for numerous biogeochemical processes in forest soils, such as soil biological activities, the transport of nutrients and metals, mineral weathering and podzolization (e.g. CitationFlessa et al. 2000; CitationRaulund-Rasmussen et al. 1998; CitationRömkens and Dolfing 1998; CitationVanHees and Lundström 2000).
Batch extraction and column leaching methods have been conventionally used in laboratories for the determination of WSOM. The amounts of WSOM extracted using these methods are largely dependent on the solution chemistry of the extractant (CitationHerbert and Bertsch 1995), including the ionic strength (CitationTipping and Hurley 1988), the presence of polyvalent cations and trace metals (CitationBaham and Sposito 1994; CitationGuggenberger et al. 1994) and the flow rate (CitationReemtsma et al. 1999). In addition, the elution curve of WSOM from mineral soils using the column leaching method showed a rapid elution rate in the initial phase and a slower rate in the subsequent phase (CitationMünch et al. 2002; CitationReemtsma et al. 1999). Likewise, CitationCao et al. (1999) showed that the elution kinetics of WSOM were different from the first-order process where the elution curve of WSOM can not be expressed with a typical negative exponential equation and appeared to have at least three additional terms. These findings indicate that WSOM consists of various organic molecules with different elution rates.
However, studies on the relationship between the elution characteristics and spectrophotometric properties of WSOM from the O horizon of forest soils are rare, mainly because of the following reasons. There are still problems with the conventional procedures that are used to obtain WSOM from soils. The WSOM obtained from soil samples using the batch extraction method is likely to contain additional components, such as derivatives from the lysis of living cells and organic matter desorbed from mineral surfaces because of the extensive disruption of soil aggregates during extraction (CitationChantigny 2003). For example, batch extraction of WSOM from a disturbed O horizon included more hydrophilic organic matter than DOM obtained using the lysimetric method, even though the original substrate was identical (CitationFröberg et al. 2003). CitationNambu et al. (2005) also showed that chopped roots release more organic carbon and low molecular weight organic acids. Moreover, it is often difficult to investigate the elution characteristics of DOM in the field using the lysimeter method because great variations in water flow and soil moisture contents of soils frequently occur depending on the actual precipitation patterns and the volume of the sample solution collected. Hence, the mass of DOM is not always sufficient for the detailed characterization of DOM (CitationBarbee and Brown 1986; CitationLitaor 1988; CitationWeihermüller et al. 2005). Furthermore, aging of the soil solution in the sample container under field conditions changes the chemical composition of DOM (CitationRoss and Barlett 1990).
The present study was undertaken to overcome the problems in WSOM studies described above. First, we collected an undisturbed sample (900-cm2 basal area: 30 cm × 30 cm) from a mor-type O horizon under a coniferous forest. The mor-type O horizon has been used in many studies of WSOM and DOM, and shows apparent differentiation in Oi, Oe and Oa subhorizons. In addition, a novel elution device for the collection of an undisturbed sample was introduced for the sequential elution of WSOM to investigate the elution characteristics of WSOM in the laboratory. Through the introduction of this methodology it was possible to obtain samples of sufficient WSOM powder for chemical and spectrophotometric analyses, and to estimate the amount of WSOM in the O horizon. The results of this study on the relationships between the elution characteristics and spectrophotometric properties of WSOM provide a better understanding of the processes for leaching of DOM from the O horizon of forest soils.
MATERIALS AND METHODS
Description of the study site for collecting mor-type O horizon samples
Soil samples were collected from Jumonji Mountain Pass, Saitama prefecture, Kanto district, Japan (35°56′15″N, 130°44′30″E, 2,000 m a.s.l.). The mean annual temperature and annual precipitation of the relevant area are approximately 3.2°C and 1,400 mm, respectively. The climatic conditions of the sampling site are of the subalpine zone, and the vegetation is composed of mainly evergreen coniferous trees, such as Tsuga diversifolia, Abies veitchii and Abies mariesii. In addition, Oxalis acetosella and Bryophytes grow densely on the forest floor. The soil is classified as Haplorthods (CitationSoil Survey Staff 1999), and the parent material is graywacke of Mesozoic geological formation. The thickness of the O horizon in the representative soil profiles was approximately 15 cm, and consisted of Oi, Oe and Oa subhorizons with thicknesses of 3, 7 and 5 cm, respectively. At the study site the thickness of the O horizon varied greatly because of differences in the microrelief of the sampling points.
Procedures for collecting undisturbed O horizon samples and sample treatment
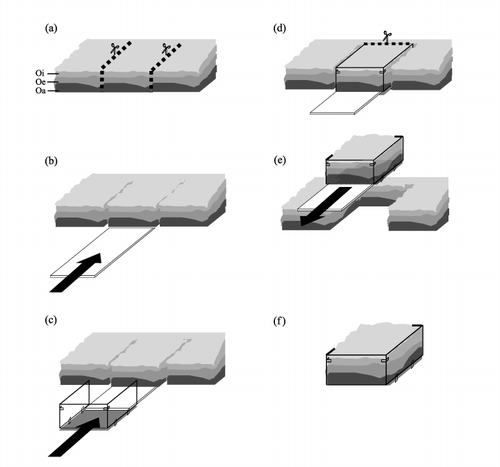
The procedures for collecting the undisturbed O horizon samples were developed in this study as shown in . In this method, an acrylic plastic board (30 cm wide, 100 cm long and 0.5 cm thick) fitted with an acrylic plastic container (900-cm2 basal area, 30 cm × 30 cm, height 17 cm, with stainless steel mesh attached at the bottom) was used, and undisturbed samples were collected using the following procedures. After cutting the O horizon into 30-cm wide strips (), the acrylic board was inserted between the boundary of the O horizon and the upper part of the E horizon while removing gravel and plant roots (). Then the acrylic container was connected to the acrylic board (), and the O horizon sample was incorporated into the container while adjusting the size to prevent sample compaction (). Finally the acrylic board was carefully removed from the intact O horizon (). Undisturbed samples were collected in July (one sample) and September (five samples) 2002 based on these procedures. The collected samples were stored at 4°C and used for the sequential elution of WSOM within 1 week after collection. Variation in the properties of the O horizon samples, including dry weight, chemical properties and WSOM yield were statistically analyzed using three replicate intact samples collected in September.
Figure 1 Procedure for sampling the undisturbed O horizon: (a) Cut O horizon into a 30-cm wide section; (b) insert acrylic board into the boundary of the Oa and E horizons; (c) and (d) move the O horizon sample into the sampling container; (e) remove acrylic board from the container; (f) transport the sample in the container to the laboratory and set in the elution device.
Moreover, an Oa subhorizon sample was prepared by removal of the Oi and Oe subhorizons and a Oe + Oa subhorizon sample was prespared by removal of the Oi subhorizon. Samples are denoted as September Oa and September Oe + Oa in the figures and the tables. The relative contribution of each subhorizon to the intact O horizon was estimated with regard to the elution characteristics and spectrophotometric properties of WSOM using these two subhorizon samples.
Sequential elution of WSOM
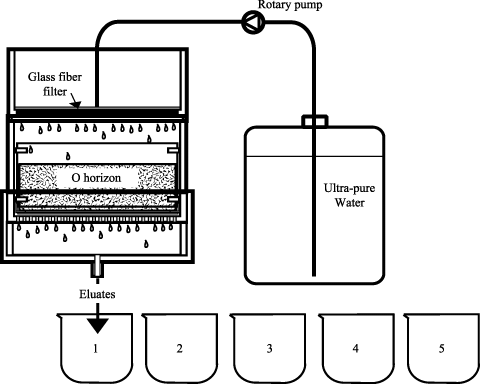
shows the sequential elution device used in this study. The device consisted of three-layered square boxes made of acrylic resin with an internal size of 30 cm. The O horizon samples shown in were placed in the middle and ultra-pure water was uniformly dripped from the upper part, and the eluate was collected in the lower part of the box. The flow rate of ultra-pure water was adjusted to 150 mL min−1, the minimum flow rate in the present sequential elution device that maintains uniform water dripping, to determine the elution characteristics of WSOM. The dripping of ultra-pure water continued for 1 h in an air-conditioned room at approximately 20°C, and was repeated five times for intervals of 1 h. During each hour 9 L of eluate was obtained and a total of 45 L of eluate was collected. Although the experimental conditions of the elution could not simulate the actual precipitation pattern at the study site it allowed us to obtain sufficient WSOM for chemical and spectrophotometric analyses and to estimate the amount of WSOM in the O horizon. The eluate was filtered through 0.45-µm cellulose acetate membrane filters (Advantec Toyo Kaisha, Tokyo, Japan) and stored at 4°C prior to the following analyses.
Figure 2 Schematic diagram of the sequential elution device where the elution of water-soluble organic matter (WSOM) for 1 h was repeated five times with intervals of 1 h.
Spectrophotometric and chemical analyses of the eluates and WSOM
Total organic carbon (TOC) concentration, absorbance at 254 nm and metal concentration in the eluates were measured using the following methods. The TOC concentration was determined with a Shimadzu TOC-500 (Simadzu, Kyoto, Japan) with the inorganic carbon subtracted from the total carbon. The absorbance at 254 nm was measured in a 1-cm quartz cell with an ultraviolet–visible spectrophotometer (UV-3210; Hitachi, Tokyo, Japan). The metal concentration was determined with an inductively coupled plasma-optical emission spectrometer (ICP-OES) (Vista-Pro, Seiko Instruments, Chiba, Japan and Varian Instruments, Palo Alto, CA, USA). The Fourier transform infrared (FT-IR) spectrum of the WSOM powder sample, directly prepared from the eluate using the freeze–dry method, was obtained with a FT-IR spectrophotometer (FT/IR-300; Jasco, Tokyo, Japan) using the KBr pellet method with 1 mg of sample mixed with 100 mg of KBr. Removal of coexisting salts before freeze-drying of the eluate was omitted because the metal concentration and the atomic ratio of total metal to TOC was very low.
The dry weights of the O horizon subsamples used for the sequential elution experiment were obtained after oven drying at 70°C for approximately 48 h (CitationCleverland et al. 2004). After measurement of dry weight the samples were pulverized to less than 200 µm and subjected to CHN elemental analysis using the dry combustion method (CHN Elemental Analyzer 2400; Perkin Elmer, Norwalk, CT, USA).
RESULTS AND DISCUSSION
Dry weight and chemical properties of the undisturbed O horizon samples and WSOM yields during sequential elution
shows the dry weights and chemical properties of the O horizon samples. Dry weights ranged from 5.02 to 14.9 kg m−2. Average value and relative standard deviation (RSD) for the intact O horizon subsamples of September (n = 3) were 6.58 kg m−2 and 32.8%, respectively. Dry weights of the Oe + Oa and Oa samples were comparable. The relative proportions of the dry weights of Oi, Oe and Oa subhorizons to the intact O horizon samples of September were approximately 7, 43 and 50%, respectively. The intact sample from July showed the highest dry weight in this study. Although seasonal changes may affect the differences in the dry weights between the intact samples of July and September, the differences largely result from spatial variation caused by differences in the microrelief of the steep slopes and the localized deposition of twig fragments and bundles of needle leaves. As shown in the carbon mass of the O horizon samples ranged from 1.86 to 6.66 kg C m−2, and tended to be higher in proportion to the dry weight, except for the Oa subhorizon sample that had a high ash content. As little difference was found in the atomic ratios of H/C and O/C and in the C/N ratios among the intact and Oe + Oa samples, the chemical properties were also analogous except for variations in dry weights. However, the Oa sample showed values different from the intact and Oe + Oa samples with higher atomic ratios of H/C and O/C and lower C/N ratios. This was probably because of the presence of relatively more degraded and humified organic materials in the Oa subhorizon.
Table 1 Dry weights and chemical properties of the O horizon samples and water-soluble organic matter yields during sequential elution
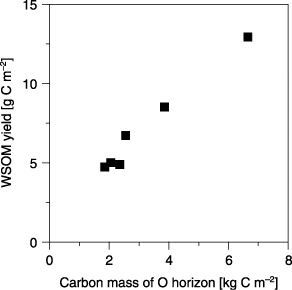
The WSOM yields determined as carbon (WSOC) during the five sequential elutions are also shown in . The WSOM yields from the intact samples were 12.9 g C m−2 for July and ranged from 4.85 to 8.48 g C m−2 for September, showing a variability of 33.8% among the samples. However, when the WSOM yields were calculated based on the carbon mass of the O horizon, the variability among intact subsamples became much smaller (8.05%), and the values were 1.94 g C kg C−1and 2.06–2.41 g C kg C−1 (an average of 2.22 g C kg C−1) for the samples from July and September, respectively. The Oe + Oa and Oa samples showed slightly higher values than the intact O horizon samples, indicating relatively less contribution of the Oi subhorizon to WSOM elution. Moreover, small differences in the WSOM yields between the Oe + Oa and Oa subsamples suggests that the contribution of the Oa horizon is an important source of WSOM. As shown in a strong linear correlation (r = 0.988; P < 0.001, t-test) was found between the WSOM yield and the carbon mass of the O horizon, suggesting that the carbon mass of the O horizon is a key factor for determining the yield of WSOM, and probably controls the DOM concentrations and flux observed in the field.
Figure 3 Relationship between the carbon mass of the O horizon and the water-soluble organic matter (WSOM) yield during five sequential elutions.
Changes in the amount of WSOM during the five elutions
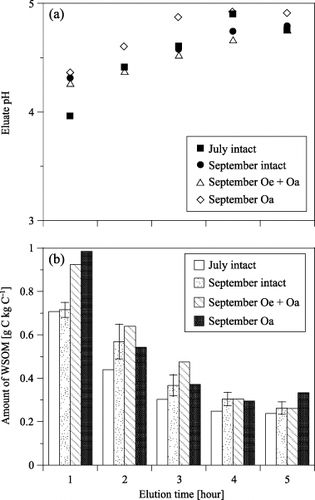
shows the changes in the pH of the eluates during the five elutions. The pH ranged from 3.9 to 4.9 and tended to rise with increasing elution time. The differences in the pH values among the samples at each elution time were less than 0.5. shows the changes in the amounts of WSOM on the basis of carbon mass for the O horizon during the five elutions. Standard deviation (SD) for the September samples (n = 3) is denoted with error bars. The amounts of WSOM at each elution time ranged from 0.707 to 0.239 g C kg C−1 for the intact sample of July, and from 0.715 to 0.263 g C kg C−1 for the September samples (average of three replicates). The amounts of WSOM eluted from the Oe + Oa and Oa samples of September at each elution time ranged from 0.924 to 0.261 g C kg C−1 and from 0.985 to 0.334 g C kg C−1, respectively. The WSOM in the first eluate was highest in all samples, and decreased non-linearly with elution time. Although we dripped 9 L of ultra-pure water at each elution step during the five sequential elutions, the total of 45 L is equivalent to approximately 30% of the annual precipitation. However, small amounts of WSOM continued to be eluted even after the third elution and WSOM elution was not zero after the fifth elution. Moreover, differences in the decreases in WSOM elution were observed among the samples. As for the intact sample of July and the Oa sample of September the amounts of WSOM in the third eluate decreased to approximately 43 and 38% of those in the first eluate, respectively. While for the intact and Oe + Oa samples of September the amounts of WSOM in the third eluate decreased to only half of the first eluate. These differences indicate a fluctuation in the elution rate of WSOM, probably from changes in the chemical properties of WSOM in each subhorizon and season.
Figure 4 Changes in (a) the pH and (b) the amounts of water-soluble organic matter (WSOM) during the five elutions.
The relationship between the amounts of eluted WSOM and the elution time observed in our experiment is similar to the results of column studies by other researchers (CitationCao et al. 1999; CitationMünch et al. 2002; CitationReemtsma et al. 1999), where WSOM elution is rapid at the initial stage of the elution and decreases non-linearly with time. The results shown in may be interpreted in terms of the elution kinetics of WSOM from the undisturbed O horizon under our experimental conditions. CitationCao et al. (1999) discussed the kinetics of leaching of WSOM from mineral soils, and showed that the process involved was different from the first-order process because a plot of –ln[WSOM] versus leaching time did not give a straight line. Likewise our results did not fit the first-order process and deviated from the linearity of the plot. Therefore, the elution kinetics of WSOM from the undisturbed mor-type O horizon are clearly different from the first-order process.
Changes in the spectrophotometric properties of WSOM during the elution process
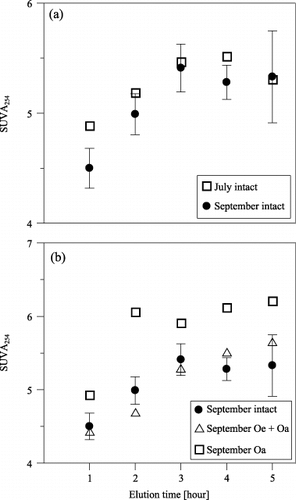
shows the changes in the values of SUVA254 during the elution of WSOM. SUVA254 is defined as the absorbance at 254 nm measured in inverse meters (m−1) divided by the DOC concentration (mg C L−1). SUVA254 is an “average absorptivity” for all the molecules that comprise the DOC in the water sample, and has been used as a surrogate measurement for DOC “aromaticity” (CitationBloom and Leenheer 1989; CitationWeishaar et al. 2003). Adjustment of the pH of the eluates was omitted in the measuring of ultraviolet absorbance because the pH of all eluates ranged within the weak-acid region (3.9–4.9).
As shown in , the SUVA254 of intact samples were in almost the same range from 4.88 to 5.51 and 4.50 to 5.41 for the samples from July and September, respectively. shows the comparison between the intact, Oe + Oa and Oa samples of September. There were no meaningful differences between the intact and Oe + Oa samples. However, the Oa sample showed the highest values, ranging from 4.92 to 6.11, with a distinct rise at the second elution followed by nearly constant higher values in the subsequent elutions. The amount of the eluates from the Oa sample with a SUVA254 of more than 5.3 was calculated as 1.55 g C kg C−1 and accounted for 61.1% of the total carbon mass. The comparable figures were much lower for the intact and Oe + Oa samples, ranging from 0.792 to 1.04 g C kg C−1 and accounting for 40.0 to 43.3% of the WSOM yield. Therefore, the Oa subhorizon appears to be the main source of WSOM with a high aromaticity, especially during the later elution phase of WSOM. Furthermore, the contribution of the Oe subhorizon as a source of low aromaticity of WSOM cannot be overlooked because the presence of the Oe subhorizon clearly reduced the values for SUVA254.
Figure 5 Changes in SUVA254 during the five elutions. (a) Intact samples from July and September and (b) intact and subhorizon samples from September. SUVA254, absorbance at 254 nm measured in inverse meters (m−1) divided by the dissolved organic carbon concentration (mg C L−1).
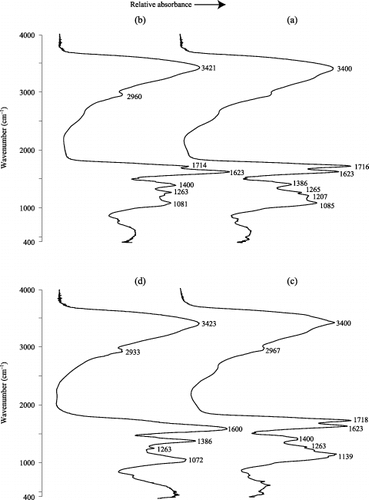
The FT-IR spectra of eluted WSOM from intact samples are shown in . The spectra of and those of show the first and the fifth eluates of the samples collected in July and September, respectively. The spectral characteristics of WSOM were similar in all samples regardless of a difference in the season of sample collection. The identification of the dominant absorption bands observed in spectra followed CitationStevenson (1982) and CitationSilverstein and Webster (1998). The main absorption bands in the spectra of WSOM were as follows: intense and broad absorption bands in the region of 3,450–3,300 cm−1 because of O-H stretching vibrations included in alcohols, phenols and water molecules; absorption in the region of 2,970–2,930 cm−1 attributed to asymmetric and symmetric vibration of aliphatic C-H bonds of methyl and methylene groups; strong peak or shoulder at 1,725–1,710 cm−1 ascribed to the stretching of C = O bonds in COOH groups, aldehydes and ketones; strong peaks at approximately 1,623 cm−1 ascribed to the stretching of C = O in esters, ketones and amides; absorption at 1600 cm−1 generally ascribed to the stretching of aromatic C = C; a peak at 1,400–1,380 cm−1 mainly assigned to O-H deformation and C-O stretching of phenolic OH; a shoulder at 1,260–1,200 cm−1 resulting from C-O stretching and O-H deformation of COOH groups and C-O stretching of aryl ethers and phenols; weak peak at 1,139 cm−1 ascribed to C-O stretching vibration of acetals and aliphatic ethers; and absorption in the region of 1,085–1,072 cm−1 attributed O-H deformation and C-O stretching of polysaccharides, phenolic and alcholic groups.
Compared to the first eluate, the absorption spectra of WSOM in the fifth eluate showed a decrease in the relative intensity of the absorption bands of 1,725–1,720 cm−1 and 1,260–1,200 cm−1 in both the July and September samples, but it was more marked in the September sample. The shift in these absorption bands indicates a decrease in carboxyl groups in WSOM. Furthermore, a shift in the intense peak from 1,623 cm−1 to 1,600 cm−1 was observed in the September sample, indicating an increase in the aromatic structures of WSOM in accordance with the rise in the values of SUVA254 with elution time. Moreover, as shown in , the concentrations of coexisting metals and the atomic ratios of total metals to C atoms of WSOM both in the first and fifth eluates of the intact samples were distinctly low, indicating that metal complexation caused little effect on the FT-IR spectra in WSOM. Therefore, the shifts in absorption bands observed for WSOM in the first and the fifth eluates can be attributed to changes in functional group composition of WSOM. Based on the foregoing discussion, it is clear that the spectrophotometric properties of WSOM in the elution process under the present experimental conditions were not always constant. Moreover, the elution process of WSOM from mor-type O horizon showed at least two additive phases where the fraction with higher carboxyl content and lower aromaticity tended to be preferentially eluted.
Figure 6 Fourier transform infrared spectra of water-soluble organic matter (WSOM). (a,b) Spectra of the first and fifth eluates of the intact sample from July and (c,d) spectra for the first and fifth eluates of the intact samples from September.
In summary, new information on WSOM in the O horizon includes: (1) spatial variation in WSOM yields can be attributed to differences in carbon mass of the O horizon in the unit area, (2) there were at least two different elution phases of WSOM where aromaticity was presumed to be important for the elution of WSOM, (3) the Oa subhorizon is a dominant source of WSOM with relatively higher aromaticity, while the Oe subhorizon is an important source of WSOM with relatively low aromaticity.
Table 2 Amounts of eluted metals and the atomic ratios to total carbon of water-soluble organic matter
REFERENCES
- Baham , J and Sposito , G . 1994 . Adsorption of dissolved organic carbon extracted from sewage sludge on montmorillonite and kaolinite in the presence of metal ions . J. Environ. Qual , 23 : 147 – 153 .
- Barbee , GC and Brown , KW . 1986 . Comparison between suction and free-draining soil solution samplers . Soil Sci , 141 : 149 – 154 .
- Bloom , PR and Leenheer , JA . 1989 . “ Vibrational, electronic, and high-energy spectroscopic methods for characterizing humic substances ” . In Humic Substances II. InSearch of Structure , Edited by: Hayes , MHB , MacCarthy , P , Malcolm , RL and Swift , RS . 409 – 446 . Chichester : John Wiley & Sons .
- Cao , J , Tao , S and Li , BG . 1999 . Leaching kinetics of water soluble organic carbon (WSOC) from upland soil . Chemosphere , 39 : 1771 – 1780 .
- Chantigny , MH . 2003 . Dissolved and water-extractable organic matter in soils: a review on the influence of land use and management practices . Geoderma , 113 : 357 – 380 .
- Cleverland , CC , Neff , JC , Townsend , AR and Hood , E . 2004 . Composition, dynamics, and fate of leached dissolved organic matter in terrestrial ecosystems: results from a decomposition experiment . Ecosystems , 7 : 275 – 285 .
- Flessa , H , Ludwig , B , Heil , B and Merbach , W . 2000 . The origin of soil organic C, dissolved organic C and respiration in a long-term maize experiment in Halle, Germany, determined by 13C natural abundance . J. Plant Nutr. Soil Sci , 163 : 157 – 163 .
- Fröberg , M , Berggren , D , Bergkvist , B , Bryant , C and Knicker , H . 2003 . Contributions of Oi, Oe and Oa horizons to dissolved organic matter in forest floor leachates . Geoderma , 113 : 311 – 322 .
- Guggenberger , G , Glaser , B and Zech , W . 1994 . Heavy metal binding by hydrophobic and hydrophilic dissolved organic carbon fractions in a spodsol A and B horizon . Water Air Soil Pollut , 72 : 111 – 127 .
- Herbert , BE and Bertsch , PM . 1995 . “ Characterization of dissolved and colloidal organic matter in soil solution: a review ” . In Carbon Forms and Functions in Forest Soils , Edited by: Kelly , JM and McFee , WW . 63 – 88 . Madison : Soil Science Society of America .
- Kalbitz , K , Solinger , S , Park , J-H , Michalzik , B and Matzner , E . 2000 . Controls on the dynamics of dissolved organic matter in soils: a review . Soil Sci , 165 : 277 – 304 .
- Litaor , MI . 1988 . Review of soil solution samplers . Water Resour. Res , 24 : 727 – 733 .
- Münch , JM , Totsche , KU and Kaiser , K . 2002 . Physicochemical factors controlling the release of dissolved organic carbon from columns of forest subsoils . Eur. J. Soil Sci , 53 : 311 – 320 .
- Nambu , K , VanHees , PAW , Essén , SA and Lundström , US . 2005 . Assessing centrifugation technique for obtaining soil solution with respect to leaching of low molecular mass organic acids from pine roots . Geoderma , 127 : 263 – 269 .
- Raulund-Rasmussen , K , Borrggaard , OK , Hansen , HCB and Olsson , M . 1998 . Effect of natural soil solutes on weathering rates of soil minerals . Eur. J. Soil Sci , 49 : 397 – 406 .
- Reemtsma , T , Bredow , A and Gehring , M . 1999 . The nature and kinetics of organic matter release from soil by salt solutions . Eur. J. Soil Sci , 50 : 53 – 64 .
- Ross , DS and Barlett , RJ . 1990 . Effects of extraction methods and sample storage on properties of solutions obtained from forested spodsols . J. Environ. Qual , 19 : 108 – 113 .
- Römkens , PFAM and Dolfing , J . 1998 . Effect of Ca on solubility and molecular size distribution of DOC and Cu binding in soils solution samples . Environ. Sci. Technol , 32 : 363 – 369 .
- Silverstein , RM and Webster , FX . 1998 . Spectrometric Identification Organic Compounds , New York : John Wiley & Sons .
- Soil Survey Staff . 1999 . Soil Taxonomy: A Basic System of Soil Classification for Making and Interpreting Soil Surveys , 2nd edn , Washington : US Department of Agriculture Soil Conservation Service .
- Stevenson , FJ . 1982 . Humus Chemistry, Genesis, Composition, Reactions , New York : John Wiley & Sons .
- Tipping , E and Hurley , MA . 1988 . A model of solid–solution interactions in acid organic soils, based on the complexation properties of humic substances . J. Soil Sci , 39 : 505 – 519 .
- VanHees , PAW and Lundström , US . 2000 . Equilibrium models of aluminium and iron complexation with different organic acids in soil solution . Geoderma , 94 : 201 – 221 .
- Weihermüller , L , Kasteel , R , Vanderborght , J , Pütz , T and Vereecken , H . 2005 . Soil water extraction with a suction cup: results of numerical simulations . Vadose Zone J , 4 : 899 – 907 .
- Weishaar , JL , Aiken , GR , Bergamaschi , BA , Fram , MS , Fujii , R and Mopper , K . 2003 . Evaluation of specific ultraviolet absorbance as an indicator of the chemical composition and reactivity of dissolved organic carbon . Environ. Sci. Technol , 34 : 4702 – 4708 .