Abstract
Acid sulfate soil has an extremely low pH and revegetation of the soil is difficult because of the high concentration of toxic elements, such as aluminum, and poor nutrient availability. Community compositions of arbuscular mycorrhizal (AM) fungi that associate with Miscanthus sinensis, a pioneer grass species that occurs in acid sulfate soil, were investigated to clarify the environmental factors that regulate the community structure. The rhizosphere soils of M. sinensis growing in acid sulfate soils were collected from three sites distributed in subarctic, temperate and subtropical zones. Rhizosphere soils of plants growing in a sandy soil site in a subarctic zone were also collected. Miscanthus sinensis seedlings were grown on these soils in a greenhouse for 2 months and a large subunit ribosomal RNA gene of the fungi was amplified from DNA extracted from the roots. Based on the nucleotide sequences of the gene, 20 phylotypes across six genera were detected from the four sites. The similarity indices of AM fungal communities among the sites did not correlate with geographical distance. Ordination analysis (principal component analysis) on the communities suggested that the first principal component reflected edaphic factors, particularly soil pH. Plotting of soil pH data at which respective phylotypes occurred and subsequent statistical analysis revealed that the ranges of preferential pH were significantly different among the phylotypes. The distribution of AM fungal phylotypes along pH gradients was further recognized by plotting the first principal component scores of the phylotypes against their preferential pH. The phylotypes that showed higher scores along the second principal component were detected from three or more sites and occurred over a wide range of pH values. These observations suggest that the preference and range of substrate pH to which the fungi can adapt are different among the phylotypes and soil pH might be a likely driving force for structuring AM fungal communities in acid sulfate soils.
INTRODUCTION
Acid sulfate soil is widely distributed in coastal and volcanic areas throughout the world and is generated by chemical and microbial oxidation of sulfide-rich materials, mainly pyrite originating from marine sediment, estuarine depositions or volcanic depositions that are exposed by large-scale land development and reclamation (CitationPrasittikhet and Gambrell 1989). The environmental impacts of acid sulfate soil have become a major concern. Drainage from acid sulfate soil, which has an extremely low pH and high levels of iron, threatens terrestrial and marine ecosystems (CitationAppleyard et al. 2004; CitationPowell and Martens 2005). Thus, there is an urgent need for the development of restoration strategies for acid sulfate soil.
Pioneer plants that consist of primary vegetation in disturbed areas may have developed diverse strategies to adapt to severe environments. It has been suggested that phosphorus (P) deficiency is one of the primary factors that limits the growth of plants in acidic soil, as well as high levels of phytotoxic elements (reviewed by CitationKochian et al. 2004). Associating with symbiotic microorganisms that improve P nutrition is likely to be one strategy that pioneer plants use to confer acidic soil stresses. Arbuscular mycorrhizal (AM) fungi associate with up to 80% of terrestrial plants and supply P to the host through extensive hyphal networks constructed in the soil (CitationSmith and Read 1997). Many herbaceous pioneers in early primary succession after volcanic eruption form AM associations (CitationOba et al. 2004; CitationWu et al. 2007), suggesting that AM fungi play significant roles in the establishment of pioneer vegetation. On the contrary, CitationAllen (1991) claims that non-mycotrophic or at least facultative mycotrophic plants dominate the early stages of primary succession. Given the fact that P deficiency is crucial for plant survival and growth in acidic soil, however, it is likely that P acquisition via AM associations is an important strategy for pioneer plants that colonize acidic soil. Little is known, however, about the physiology and ecology of AM fungi in acidic soil.
Recovering vegetation by using native pioneer plants could be one way to restore acid sulfate soil, and it is expected that the application of AM fungi to the restoration program may contribute to the establishment of vegetation. Miscanthus sinensis Andresson is a major pioneer grass species in acid sulfate soils in Eastern Asia and has a high potential for photosynthesis as a C4 plant and distributes roots deeply in the soil for the efficient uptake of water and nutrients (CitationOhtsuka et al. 1993). M. sinensis plants release citrate to protect the root tips from aluminum toxicity under acidic conditions and, thus, this species is highly acid tolerant (CitationKayama 2001). M. sinensis grown in a semi-natural grassland has been shown to harbor a variety of AM fungi (CitationSaito et al. 2004) and has shown a greater dependency on mycorrhiza than other grasses (CitationMurakoshi et al. 1998).
The objectives of this study were to clarify AM fungal community compositions in acid sulfate soil and to explore the driving forces structuring the community in such an extreme environment. We focused on: (1) whether climate and/or geographical isolation are the critical factors determining the community compositions, (2) how soil acidity affects the communities. To answer these questions, three fields in which acid sulfate soil has been found were chosen from subarctic, temperate and subtropical zones in Japan, in addition to a non-acid sulfate soil site from a subarctic zone. We focused on AM fungi associated with M. sinensis, which was commonly found in all of the fields. The soil trap culture technique was used for the analysis of the communities (CitationBever et al. 1996; CitationBrundrett et al. 1999a). The community compositions were determined based on the nucleotide sequences of the D1/D2 domains of a large subunit ribosomal RNA gene (LSU rDNA) directly amplified from DNA extracted from M. sinensis roots. Recently, this method has been successfully applied to AM fungal community analyses in various ecosystems (e.g. CitationGollotte et al. 2004; CitationPivato et al. 2007; CitationTurnau et al. 2001).
MATERIALS AND METHODS
Sampling sites
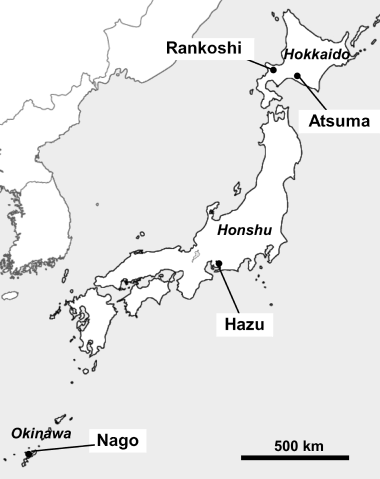
The sampling sites were located in Rankoshi, Hokkaido (30–50 m a.s.l., 42°42′N, 140°21′Ε, subarchtic zone), Hazu, Achi, Honshu (100–200 m a.s.l., 34°47′N, 137°07′E, temperate zone) and Nago, Okinawa (40–50 m a.s.l., 26°35′N, 127°58′E, subtropical zone) and Atsuma, Hokkaido (30 m a.s.l., 42°43′N, 141°52′E, subarctic zone) in Japan (). The former three were the sites for acid sulfate soil, and the latter was a control site for non-acid sulfate soil. The climate and surrounding vegetation at these sites are summarized in .
Acid sulfate soil in Rankoshi originated from pyroclastic sediment and was exposed by quarrying. The site consists of a steep slope (30–40° angle, 50 m in height) with several terraces (20–30 × 3–4 m, W/D) and has not been severely disturbed since 1980. The ground of the site was not fully covered with vegetation, but patchy distributions of M. sinensis, Petasites japonicus (Sieb. et Zucc.) Maxim var. giganteus (Fr. Schm) Kitam., Polygonum sachalinense Fr. Schm. and young seedlings of Betula platyphylla var. japonica and Salix sachalinensis Fr. Schm. were observed. Acid sulfate soil in Hazu originated from marine sediment and was exposed by quarrying. This site had been quarried for a long time so that the bottom ground of the field (approximately 10 ha) is 20–100 m below the top of the surrounding hills and is flat except for two ponds (30–50 m in diameter, 2–4 m in depth). Quarrying had ceased in 1999 and the field has not been severely disturbed since then. Alnus firma Sieb. et Zucc. (0.1–3 m height) was observed around the two ponds and along the border between the quarry and surrounding forest. The rest of the area was not fully covered with vegetation, but patchy distributions of herbaceous plants, Artemisia princeps L., M. sinensis and Solidago altissima L., and the shrub Lespedeza cyrtobotrya L. were observed. The Nago site is located at the Nago branch of the Okinawa Prefectural Agricultural Research Center. Acid sulfate soils in the site originated from marine sediment and were exposed on the steep slopes created by the reclamation of sugarcane field. The slopes (50–60° angle, 4–5 m in height) surround the north (80 m) and west (50 m) sides of the sugarcane field. The ground of the slopes was not fully covered with vegetation, but scattered distributions of M. sinensis, Sasa kurilensis, S. veitchii and Melastoma spp. were observed. The Atsuma site is located on a terrace along the Abira River. After clear-cutting for the construction of a high-voltage power line tower in 1980, M. sinensis grassland (50 m × 30 m) has been established on sandy soil originating from volcanic pumice and ash, and a thick (7–8 cm) organic layer has been developed on the top soil.
Table 1 Climates and surrounding vegetation of the experimental sites
Soil sampling and trap culture
Two to three kilograms of rhizosphere soil (top 5–10 cm in depth, 30–40 cm in diameter) of M. sinensis was collected from 12 randomly chosen plants growing in Rankoshi (May 2005), Hazu (June 2005) and Nago (April 2006). From the Atsuma site, rhizosphere soil samples were collected from 12 intersections of 10 m × 5 m interval grid lines drawn on the grassland after removing the litter layer (3–4 cm) in October 2006. Each soil sample was sieved through a 4.5-mm stainless mesh and stored at room temperature.
Seeds of M. sinensis (Kaiseisha, Otofuke, Hokkaido) were sown onto each of the soil samples in 9-cm plastic pots (with a volume of 350 mL). Four pots were prepared for each soil sample: one was for DNA extraction and the other three pots were for the assessment of AM colonization. After sowing, the soil surface was covered with a thin layer of autoclaved river sand to avoid soil cluster formation on the surface. The seedlings were grown only with tap water in a temperature/light-controlled (26°C/14-h day length) greenhouse with steel flooring and the seedlings were thinned to 10 plants per pot 2 weeks after sowing. The cultivation periods of Rankoshi and Hazu samples overlapped for 1 month, but they were cultured in different rooms in the facility to avoid cross contamination. The roots were harvested after 2 months from each pot separately, washed with tap water and blotted on a paper towel. The samples for DNA extraction were frozen in liquid nitrogen immediately, freeze-dried for 2 days and stored at –30°C, whereas the samples for the assessment of AM colonization were cut into approximately 1-cm segments and stored at –30°C.
The levels of AM colonization were assessed after clearing with 10% KOH and staining with Trypan blue using the gridline intersection method (CitationGiovannetti and Mosse 1980).
Soil chemical properties
The soil samples were air-dried, crushed and passed through a 2-mm sieve. Soil pH (H2O) was measured at a 1:2.5 soil : water ratio (w/v) using an electrode after shaking for 1 h at 160 rpm. Soil pH (H2O2) was measured after overnight oxidation with 30% H2O2 at a 1:5 soil : H2O2 ratio (w/v). Total carbon (C) and nitrogen (N) were analyzed using the Vario MAX CNS (Elementar, Tokyo, Japan). Available phosphate (Truog-P) was measured using the vanado-molybdate method after extraction with 0.001 mol L−1 H2SO4 at a ratio of 1:200 (w/v) (CitationTruog 1930).
Molecular identification
The dried root sample was first cut into small segments (less than 1 cm) and mixed well in a plastic bag, and then 10–20 mg of the sample was transferred to a 2-mL tube with an O-ring sealed cap (Yasui Kikai, Osaka, Japan) and ground using the Multi-Beads Shocker (Yasui Kikai) with a metal cone at 2,500 rpm for 2 × 60 s at room temperature. DNA was extracted from each sample using the DNeasy Plant Mini Kit (Qiagen, Tokyo, Japan) according to the manufacturer's instructions and stored at –30°C. A part of the large subunit ribosomal RNA gene (LSU rDNA) was amplified in a 25 µL reaction mixture using the Expand High-Fidelity PLUS PCR System (Roche Diagnostics, Tokyo, Japan) containing 0.5 µmol L−1 primers and 1 µL of the template DNA. The LSU rDNA-universal forward primer LR1 (Citationvan Tuinen et al. 1998) and fungal LSU rDNA-specific reverse primer FLR2 (CitationTrouvelot et al. 1999) were used for the amplification of 700–760 bp of the fungal gene. The PTC-225 DNA Engine Tetrad thermal cycler (MJ Research, Tokyo, Japan) was used, and the program was as follows: initial denaturation at 94°C for 2 min, followed by 30 cycles of denaturation at 94°C for 15 s, annealing at 50°C for 40 s and polymerization at 72°C for 80 s, and final elongation at 72°C for 10 min. In cases where the fungal LSU rDNA could not be directly amplified from the DNA extract, nested polymerase chain reaction (PCR) was used. The first reaction was carried out with the primer pair of LR1 and NDL22 (Citationvan Tuinen et al. 1998) with the same program. The second reaction was carried out with the LR1 and FLR2 using 2.5 µL of a 1:100 dilution of the first PCR product.
The PCR products were cloned into the pT7Blue T-vector (Novagen/Merch, Tokyo, Japan) according to the manufacturer's instructions. As a first step, 16 clones were randomly chosen from each sample, and the nucleotide sequences were determined using the dideoxy-sequencing method with the BigDye Terminator v3.0 or v3.1 Cycle Sequencing Kit with the ABI PRISM 3100 Genetic Analyzer (Applied Biosystems, Tokyo, Japan). The DNA sequences were aligned with published data using the ClustalX program, and those showing high similarity to organisms outside Glomeromycota were excluded from subsequent analyses. The neighbor-joining tree was displayed using NJplot software. The confidence limits of each branch in the phylogeny were assessed by 1,000 bootstrap replications and expressed as percentage values. The AM fungal phylotypes were defined based on sequence similarity to known species, tree topology and a bootstrap value of more than 70%. Potential phylotype richness was estimated using the EstimateS 7.5 software for each sample based on rarefaction curves with 95% confidence intervals (CI) (CitationColwell et al. 2004). In this computation, each clone was regarded as one sample in which the phylotype of the clone was scored “1” and the other phylotypes were scored “0”. For samples in which the 95% CIs of phylotype richness were more than 2, an additional 16 clones were randomly chosen and sequenced.
Statistical analysis
Rarefaction curves and Chao's Sørensen incidence-based similarity indices were computed using EstimateS 7.5. Principal component analysis (PCA) was carried out using SPSS statistical software ver. 10.0 (SPSS, Chicago, IL, USA). In these analyses, the presence or absence of each phylotype was scored as “1” or “0”, respectively, in each root sample, and these data were pooled within the respective sites. Root samples in which the PCR product of AM fungi could not be obtained were excluded from the analyses. Prior to PCA, Hellinger transformation (CitationLegendre and Gallagher 2001) was applied to datasets that contained many zeros and rare phylotypes. This transformation was expected to make the dataset more suitable for community analysis by giving less weight to rare phylotypes (CitationLegendre and Gallagher 2001; CitationRamette 2007). All pH values were transformed to real numbers before statistical treatments. In the analysis of the pH preference of AM fungal phylotypes, anovas and Tukey–Kramer post-hoc tests were carried out using SPSS. In this analysis, the transformed pH values (real number) were to be retransformed to logarithmic values for normalization, and only the datasets that showed no significant difference in the variance were subjected to anova. Simple correlation analysis was carried out using SPSS.
RESULTS
Soil chemical properties
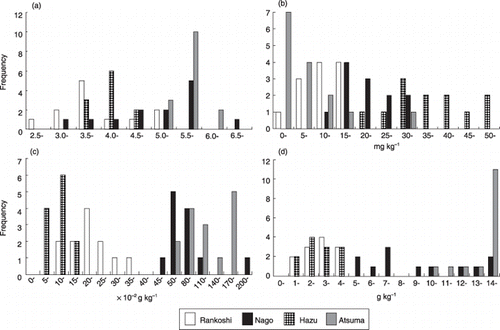
The soil pH of M. sinensis rhizosphere soils from Rankoshi ranged from 2.7 to 5.4, but values ranging between 3.5 and 3.9 were observed most frequently (). The pH values of the soils from Hazu ranged from 3.7 to 6.8, with the highest frequency recorded between 4.0 and 4.4. The pH values of the soils from Nago and Atsuma were higher than those from the other sites and ranged from 3.5 to 5.7, with the highest frequency recorded between 5.5 and 5.9 in Nago, and from 5.4 to 6.1, with the highest frequency recorded between 5.5 and 5.9 in Atsuma. As the pH values observed in the Nago samples were higher than expected, the pH (H2O2) of the soils that showed pH values higher than 5.5 was measured. Oxidation of the soils by H2O2 dramatically decreased the pH values to less than 2.5, implying that the soils in Nago were “potential” acid sulfate soils (data not shown). The levels of available P were lower in Rankoshi and Atsuma soils, followed by those in Nago and Hazu soils (). Total N contents in the Hazu soils were lowest, followed by those in the Rankoshi and Nago soils, and Atsuma soils had the highest N content (). Total C contents in both Rankoshi and Hazu samples were within a range of 1.4–4.9 g kg−1 and lower than the other samples (). The C levels in Nago soils were highly variable among the samples and ranged from 5.4 to 57.7 g kg−1, with the highest frequency between 7.0 and 7.9 g kg−1. Total C contents in the Atsuma samples were considerably higher than those at the other sites, ranging from more than 10.0 g kg−1 up to 26.0 g kg−1.
All of these parameters were combined irrespective of the sites and subjected to simple linear correlation analysis, and significant correlations were observed among pH, total N and C. The correlation coefficients (r) were: 0.682 between pH and total N, 0.699 between pH and total C and 0.975 between total N and C (P < 0.01). None of the parameters showed a significant correlation with Truog-P levels.
Arbuscular mycorrhizal fungal phylotypes
The levels of AM fungal colonization on M. sinensis seedlings in the trap cultures were: 0–63.1% at Rankoshi; 16.8–53.5% at Hazu; 22.9–55.7% at Nago; and 1.9–15.6% at Atsuma. Fungal LSU rDNA were successfully amplified from seven root samples using one-step PCR and from one sample using nested PCR out of the 12 root samples from Rankoshi. The PCR products were also obtained from one-step PCR from eight, nine and nine samples from Hazu, Nago and Atsuma, respectively. The root samples from which PCR product could not be obtained were those with zero or lower levels of colonization in general. After cloning of the PCR products, 16–32 clones from each sample were sequenced and, in total, 134, 139, 128 and 107 clones from the Rankoshi, Hazu, Nago and Atsuma samples, respectively, were found to be of AM fungal origin. Overall, 20 different phylotypes (including three subgroups) across six genera were detected based on phylogenetic analysis. shows a phylogenetic tree constructed with the representative sequences from each root sample. The numbers of phylotypes (phylotype richness) detected from the Rankoshi, Hazu, Nago and Atsuma sites were 6, 8, 11 and 12, respectively. ARC1 and PAR1 were related to Archaeospora gerdemannii and Paraglomus occultum, respectively, and were found at all of the four sites. PAR1 was, however, further separated into two subgroups, group-I and group-II, with a bootstrap value of 100%. Group-I consisted of the clones detected from Rankoshi, Hazu and Nago, the acid sulfate soil sites, while group-II consisted of clones only from Atsuma, the sandy soil site. ARC1 was detected from eight out of the nine root samples grown on the Nago soils; thus, ARC1 was one of the dominant types at this site. PAR1 group-II, an Atsuma-specific phylotype that was detected in six out of the nine samples, was dominant at the site. GLO5 showed no similarity to known species but was related to uncultured Glomus sp. hr11. This type was also detected from all four sites. GLO1 was related to Glomus intraradices and detected at the Rankoshi, Hazu and Atsuma sites. This phylotype was further separated into two subgroups, group-I and group-II, with a high bootstrap value, and group-II consisted of clones only from Rankoshi, while group-I consisted of clones from Rankoshi, Hazu and Atsuma. GLO1 (group-I and group-II) was the most abundant type at the Rankoshi site. GLO3 showed high-sequence similarity to Glomus sp. HR1 and Glomus manihotis and was found in more than half of the Hazu, Nago and Atsuma samples. ACA1 was related to Acaulospora mellea and was detected at the Hazu, Nago and Atsuma sites. However, this phylotype was further separated into two subgroups, group-I and group-II, with a bootstrap value of 100%. Group-I consisted of clones from Nago and Atsuma, whereas group-II consisted of clones only from Hazu and was the most abundant type at the site. GLO6 showed no similarity to known species but was related to uncultured Glomus sp. rp2 and was detected at the Rankoshi and Atsuma sites. GIG1 was related to Gigaspora margarita and was found both at Hazu and Atsuma. GLO2 and ACA2 were related to Glomus clarum and Acaulospora longula, respectively, and were found at both Nago and Atsuma. In Atsuma, ACA2 was found from five out of the nine samples and was one of the dominants at the site. UNC2 showed sequence similarity to uncultured glomeromycete 6.8 and was detected only from Hazu. ACA3, SCT1, GIG2 and GLO7 showed similarity to uncultured Acaulospora sp. S175, Scutellospora sp. hr83, Gigaspora gigantea and Glomus claroideum, respectively, and were found only at Nago. UNC1 and GLO4 showed similarity to uncultured glomeromycete Cp193 and Glomus mosseae, respectively, and were found only at Atsuma. The rarefaction curves evaluating the sampling efficiencies on the recovery of AM fungal phylotypes from the four sites appeared to reach a plateau (data not shown).
Community analysis
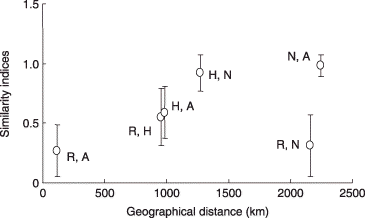
Similarity in the AM fungal communities between every combination of two out of the four sites was first assessed with respect to geographical distance between the sites (). The highest similarity index was observed between Nago and Atsuma, the most distant sites, and the lowest value was observed between Rankoshi and Atsuma, the nearest sites. Thus, there was no significant correlation between the indices and geographical distance.
To explore the environmental factors that affect AM fungal communities, PCA was used (). The communities at the Rankoshi and Hazu sites were closely located on the site plot and showed positive scores along the first principal component (PC1) axis, which accounted for 40.2% of the total variance (). In contrast, the communities at the Nago and Atsuma sites were closely located and showed negative scores with the PC1. All communities showed positive scores along the PC2, which accounted for 27.1% of the total variance. The PC1 and PC2 score plots of the phylotypes obtained by the PCA are shown in . GLO1 group-I and group-II, PAR1 group-I, GLO5 and ACA1 group-II showed relatively higher positive scores with the PC1, whereas ARC1, GLO3, ACA1 group-I, ACA2, PAR1 group-II and GLO2 showed relatively higher negative scores. Along the PC2 axis, ARC1, GLO3, GLO1 group-I, PAR1 group-I, GLO5, ACA1 group-I and ACA2 showed positive scores, and the rest of the phylotypes showed scores close to zero or negative scores.
Figure 3 Phylogenetic analysis based on the sequences of a 700–760 bp fragment of arbuscular mycorrhizal (AM) fungal LSU rDNA obtained by the Miscanthus sinensis trap culture using rhizosphere soils collected from Rankoshi (purple), Hazu (blue), Nago (green) and Atsuma (orange). The neighbor-joining tree has been drawn using NJplot. Bootstrap values more than 70% are indicated. Representative sequences from each root sample are incorporated. Clone names are followed by their GenBank accession numbers for the sequences obtained in this study. The accession numbers of the reference sequences are: Glomus intraradices 107, AY639221; Glomus clarum, AJ510243; Glomus manihotis, AM158947; Glomus sp. hr11, AM040407; Glomus sp. rp2, AM040435; Glomus caledonium, AM040317; Glomus mosseae, DQ469129; Glomus etunicatum, AF145749; Scutellospora pellucida, AY639326; Scutellospora sp. hr83, AM040378; Gigaspora margarita, AF396783; Gigaspora gigantea, AY900504; Acaulospora mellea, AY900513; Acaulosporaceae sp. S175, AB206249; Acaulospora longula, AM040293; uncultured glomeromycete 6.8, AY639357; uncultured glomeromycete Cp193, AB206207; Archaeospora gerdemannii, AJ510234; Palaglomus occultum, AJ271713; Neurospora crassa, AF286411.
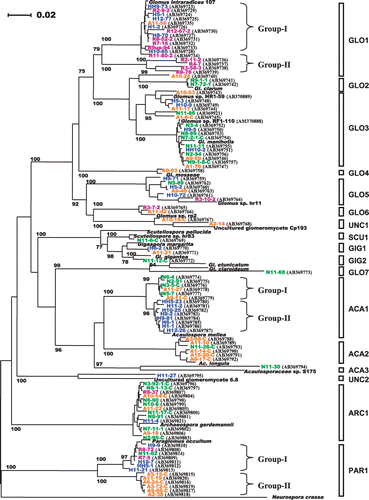
Figure 4 Scatter plot of Chao's Sørensen similarity indices of arbuscular mycorrhizal fungal communities against geographical distance between two sampling sites. R, Rankoshi; H, Hazu; N, Nago; A, Atsuma. No significant correlation between the two parameters was found (P < 0.05). Vertical bars indicate standard deviation.
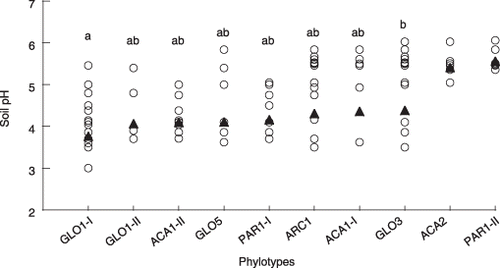
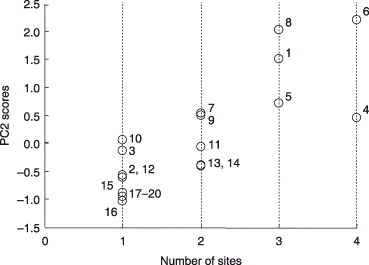
Based on the PCA, it was assumed that PC1 might reflect soil chemical parameters, in particular, pH, total C and N because these values in the soils from Rankoshi and Hazu were relatively low compared with the values from Nago and Atsuma. As these parameters were correlated with each other, soil pH was used as a representative for subsequent analyses. The pH values of the soils in which the respective phylotypes occurred were combined irrespective of the sites and plotted (). Only phylotypes that occurred in four or more soil samples were included in this analysis. Although most of the phylotypes were distributed over a broad range of pH values, GLO1 group-I occurred preferentially in a more acidic range (average pH 3.8) than GLO3 (average pH 4.4) (P < 0.01). It should be noted that variances in the pH values of ACA2 and PAR1 group-II, which occurred in soils with average pH values of 5.4 and 5.6, respectively, were significantly smaller than those of the other phylotypes (P < 0.05) (data not shown) and, thus, they were excluded from the analysis. The distribution of the phylotypes along pH gradients was more clearly recognized by plotting the PC1 scores of these phylotypes against the average pH values of the soils in which they occurred (). GLO1 group-I, GLO1 group-II, ACA1 group-II, GLO5 and PAR1 group-I, which had positive scores, occurred preferentially in soils with a pH value between pH 3.8 and 4.2, whereas those with negative scores were separated into two groups: one group (ARC1, ACA1 group-I and GLO3) occurred in less acidic soil (pH 4.3–4.4) than those with the positive scores and the other group (ACA2 and PAR1 group-II) occurred in soils with a pH greater than 5. The phylotypes that were detected from three or more sites, for example, GLO1 group-I, PAR1 group-I, ARC1 and GLO3, showed higher PC2 scores (). It is noteworthy that these phylotypes are the ones that occurred over a wide pH range ().
Figure 5 Principal component analysis on arbuscular mycorrhizal (AM) fungal communities at Rankoshi, Hazu, Nago and Atsum. (a) Component plot of experimental sites. The first (PC1) and second (PC2) principal components explained 40.2% and 27.1% of the total variation, respectively. (b) Scatter plot of the PC1 and PC2 scores of the AM fungal phylotypes.
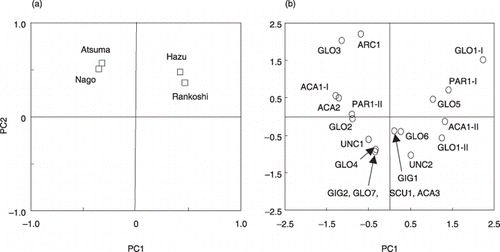
Figure 6 Differences in the pH range of soils in which arbuscular mycorrhizal (AM) fungal phylotypes occur. The pH values of rhizosphere soils from which each AM fungal phylotype was detected were plotted (○). Only phylotypes that occurred in four or more soil samples (across the all sites) were included in this analysis. Equality of variance tests showed that the datasets of ACA2 and PAR1 group-II had significantly smaller variances than those of the other phylotypes; thus, these two phylotypes were excluded from the subsequent anova. Different letters indicate significant differences in pH distribution (Tukey–Kramer test, P < 0.05). The pH values were transformed to real numbers for the calculation of mean value (▴), but were retransformed to logarithmic values for anova for normalization.
DISCUSSION
Soil pH as a driving force for structuring AM fungal communities
To our knowledge, the present study provides the first information about AM fungal communities in pioneer vegetation of acid sulfate soil with respect to different climatic zones and soil pH gradients. We found that the influences of climate and/or geographical isolation on AM fungal communities were minimal. Instead, it is most likely that soil chemical properties, probably soil pH, are the major driving force for structuring the community compositions in acid sulfate soil based on the observations that soil pH was correlated with the community compositions and that AM fungal phylotypes distributed along pH gradients. Edaphic factors are known to be of importance in regulating the species composition of AM fungal communities (CitationAbbott and Robson 1991; CitationJohnson et al. 1992). Although the influences of soil fertility, for example, soil C and N (CitationJohnson 1993) and organic/conventional farming systems (CitationHijri et al. 2006; CitationOehl et al. 2005) on AM communities have been studied extensively, information on the influence of soil acidity (pH) is scarce (CitationAbbott and Robson 1991). Although soil pH, total C and N were well correlated with each other in this study, we consider that soil acidity is a likely primary factor that structures the communities in extremely acidic soils (or disturbed areas) because of the following reasons. First, the levels of C and N in the soils may be a reflection of the vegetation history in, i.e., the growth of pioneer plants is much slower and poorer in more acidic soils, resulting in reduced C and N accumulation in more acidic soil. Second, it is unlikely that soil C status affects AM fungal colonization or community composition directly because of the nature of the fungi as an obligate biotroph. Third, the effects of soil C and N on AM fungal community compositions in arable soils shown by CitationJohnson (1993), the only report that has claimed that soil C and N affect AM fungal communities, were not unequivocal, and the change in the community could not be attributed solely to soil C and N levels because available P levels were also different between the treatments. However, the possibility that C and N levels regulate, directly or indirectly, AM fungal community composition in acid sulfate soil could not be excluded by the results obtained in the present study. Therefore, the hypothesis that soil pH is the primary factor for structuring the community in acidic soils should be further examined experimentally.
Figure 7 Scatter plot of the first principal component (PC1) scores of arbuscular mycorrhizal (AM) fungal phylotypes against the average pH values of the soils in which they occurred. Only phylotypes detected from four or more soil samples (across the all sites) were included in this analysis. The phylotypes are identified by numbers as follows: 1, GLO1 group-I; 2, GLO1 group-II; 3, ACA1 group-II; 4, GLO5; 5, PAR1 group-I; 6, ARC1; 7, ACA1 group-I; 8, GLO3; 9, ACA2; 10, PAR1 group-II.
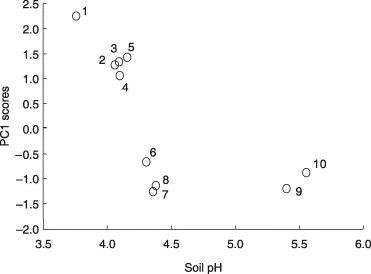
Figure 8 Scatter plot of the second principal component (PC2) scores of the phylotypes against the number of sites at which they were detected. All phylotypes were included in this analysis. The phylotypes are identified by numbers as follows: 1, GLO1 group-I; 2, GLO1 group-II; 3, ACA1 group-II; 4, GLO5; 5, PAR1 group-I; 6, ARC1; 7, ACA1 group-I; 8, GLO3; 9, ACA2; 10, PAR1 group-II; 11, GLO2; 12, UNC1; 13, GLO6; 14, GIG1; 15, GLO4; 16, UNC2; 17, GLO7; 18, SCU1; 19, GIG2; 20, ACA3.
The fact that all of the AM fungal communities at the four sites showed similar scores along the PC2 axis may imply that the community compositions are fundamentally similar to each other. It was initially expected that the effects of surrounding vegetation, which is largely defined by climatic factors, on AM fungal community composition could be substantial because the top soils of the surrounding forests would be the most likely inoculum source of AM fungi for these disturbed areas. In particular, it was surprising that the fungal community compositions were strikingly similar between Nago and Atsuma sites at which climate and plant species compositions in the surrounding vegetation were quite different. It is well known that plant species composition is a major regulatory factor of AM fungal community composition (e.g. CitationJohnson et al. 1992, Citation2004; CitationPivato et al. 2007; CitationVandenkoornhuyse et al. 2002), and this may result from the fact that every phase in the life history of AM fungi is dependent on the host plants (CitationBever et al. 1996; CitationEom et al. 2000). Therefore, there was no doubt that the forests surrounding the four sites might harbor different AM fungi and that AM fungal communities of M. sinensis grown within the sites (disturbed areas) could reflect this difference. The most likely and simplest explanation for our results is that particular AM fungal genotypes with which M. sinensis associates may have been preferentially selected. Most individual M. sinensis plants growing at the three acid sulfate sites were isolated each other because of poor vegetation coverage, and this might provide less opportunity to associate with other plant species for the fungi. If this is true, the surrounding forests may retain extremely high AM fungal diversity that enables M. sinensis to select similar communities irrespective of the plant species composition of the forest. The AM fungal diversity in the surrounding forests needs to be assessed to examine this assumption.
There is a possibility that high-similarity among the communities may be due to the bias of soil trap culture. It has been shown that different analytical methods, for example, field-collected samples and trap culture-based analyses give different results (CitationBever et al. 1996; CitationBrundrett et al. 1999a,Citationb), and a diversity of approaches is needed for more complete descriptions of AM fungal community compositions (CitationBever et al. 1996). In soil trap culture, the main components of AM fungal propagules may be spores and mycorrhizal root fragments, suggesting that AM fungi that are capable of regenerating more rapidly, that is, more competitive fungi (CitationBrundrett et al. 1999a), will be detected compared with an analysis of field-collected root samples that are grown in the existing mycelial networks of the fungi (CitationFitter et al. 2000). In contrast, seasonal variation in AM fungal communities in host plant roots was reported using a PCR-based method targeting fungal SSU rDNA (CitationHeinemeyer et al. 2004), implying that plants with different growth phases harbor different AM fungi. In the present study, field samples were to be collected from the four experimental sites belonging to subarctic to subtropical zones, but it seemed quite difficult to collect field-grown root samples from plants with the same growth phase in different climatic zones. The soil trap culture, in contrast, was expected to minimize the sampling biases caused by differences in the host growth phase and was used in the present study. The fact that the AM fungal phylotype richness detected in the present study was comparable to that in pioneer vegetation of the volcanic desert of Mt Fuji (CitationWu et al. 2007) and was more than double that of the Lahar area of Mt Pinatubo (CitationOba et al. 2004) may validate our approach.
Differences in the pH preference of AM fungi
The present study demonstrated that the ranges of substrate pH to which the fungi were capable of adapting were quite different. The significantly smaller variances of the soil pH values of ACA2 and PAR1 group-II that occurred with pH values greater than 5 may imply that these phylotypes can adapt to only a narrow range of pH values. In contrast, it was surprising that several phylotypes, ARC1, GLO3, GLO1 group-I, GLO5 and PAR1 group-I, occurred in many of the geographically isolated sites that showed a large variation in soil pH. These fungi could be categorized as “generalists”, although slight difference in preferential pH among the generalists was observed. The physiological/genetic backgrounds of the generalists are of interest not only from the viewpoint of basic biology, but also from that of applied science/technology for environmental restoration. It has been shown that Glomus intraradices, which is closely related to one of the generalist GLO1 in this study, has enormous intraspecific functional (genetic) diversity, for example, large variations in hyphal growth rates and spore productivity were found among isolates in a single experimental field (CitationKoch et al. 2004). It is considered that the generalists may have greater intraspecific functional/genetic diversity as observed in Gl. intraradices, thus they could adapt to a wide range of pH values and could dominate even in a severe environment.
Conclusions
In contrast to our results, CitationÖpik et al. (2006) suggested that the region/location effect on AM fungal communities might be significant through a meta-analysis of 26 publications that reported AM community compositions in different regions of the world. They also pointed out, however, that there were too few studies on fungal communities of the same plant species at different sites. Further surveys of AM fungal communities of primary vegetation in acid sulfate soil that occurs in diverse regions and climatic/vegetation zones may contribute to understanding the significance of the region/location effects on the community as well as that of edaphic factors.
Our study may also contribute to the future application of AM fungi to restoration of acid sulfate soil. Our finding that “generalists” can colonize host plants over a range of pH values is novel, and it is expected that these fungi may have a great potential as “universal fungi” for environmental restoration if they can be isolated successfully.
ACKNOWLEDGMENTS
The authors would like to thank W. Shimojima, Aichi Public Enterprise Bureau and Soil and Environment Section, Okinawa Prefectural Agricultural Research Center, for allowing us access to the fields and Kaiseisha for providing the M. sinensis seeds.
References
- Abbott , LK and Robson , AD . 1991 . "Factors influencing the occurrence of vesicular-arbuscular mycorrhizas . Agr. Ecosyst. Environ. , 35 : 121 – 150 .
- Allen , MF . 1991 . The Ecology of Mycorrhizae , Cambridge : Cambridge University Press .
- Appleyard , S , Wong , S , Willis-Jones , B , Angeloni , J and Watkins , R . 2004 . "Groundwater acidification caused by urban development in Perth, Western Australia: source, distribution, and implications for management . Aust. J. Soil Res. , 42 : 579 – 585 .
- Bever , JD , Morton , JB , Antonovics , J and Schultz , PA . 1996 . "Host-dependent sporulation and species diversity of arbuscular mycorrhizal fungi in a mown grassland . J. Ecol. , 84 : 71 – 82 .
- Brundrett , MC , Abbott , LK and Jasper , DA . 1999a . "Glomalean mycorrhizal fungi from tropical Australia I. Comparison of the effectiveness and specificity of different isolation procedures . Mycorrhiza , 8 : 305 – 314 .
- Brundrett , MC , Jasper , DA and Ashwath , N . 1999b . "Glomalean mycorrhizal fungi from tropical Australia II. The effect of nutrient levels and host species on the isolation of fungi . Mycorrhiza , 8 : 315 – 321 .
- Colwell , RK , Mao , CX and Chang , J . 2004 . "Interpolating, extrapolating, and comparing incidence-based species accumulation curves . Ecology , 85 : 2717 – 2727 .
- Eom , AH , Hartnett , DC and Wilson , GWT . 2000 . "Host plant species effects on arbuscular mycorrhizal fungal communities in tallgrass prairie . Oecologia , 122 : 435 – 444 .
- Fitter , AH , Heinemeyer , A and Staddon , PL . 2000 . "The impact of elevated CO2 and global climate change on arbuscular mycorrhizas: a mycocentric approach . New Phytol. , 147 : 179 – 187 .
- Giovannetti , M and Mosse , B . 1980 . "An evaluation of techniques for measuring vesicular-arbuscular mycorrhizal infection in roots . New Phytol. , 84 : 489 – 500 .
- Gollotte , A , van Tuinen , D and Atkinson , D . 2004 . "Diversity of arbuscular mycorrhizal fungi colonising roots of the grass species Agrostis capillaris and Lolium perenne in a field experiment . Mycorrhiza , 14 : 111 – 117 .
- Heinemeyer , A , Ridgway , KP , Edwards , EJ , Benham , DG , Young , JPW and Fitter , AH . 2004 . "Impact of soil warming and shading on colonization and community structure of arbuscular mycorrhizal fungi in roots of a native grassland community . Global Change Biol. , 10 : 52 – 64 .
- Hijri , I , Sýkorová , Z Oehl , F . 2006 . "Communities of arbuscular mycorrhizal fungi in arable soils are not necessarily low in diversity . Mol. Ecol. , 15 : 2277 – 2289 .
- Johnson , D , Vandenkoornhuyse , PJ Leake , JR . 2004 . "Plant communities affect arbuscular mycorrhizal fungal diversity and community composition in grassland microcosms . New Phytol. , 161 : 503 – 515 .
- Johnson , NC . 1993 . "Can fertilization of soil select less mutualistic mycorrhizae . Ecol. Application , 3 : 749 – 757 .
- Johnson , NC , Tilman , D and Wedin , D . 1992 . "Plant and soil controls on mycorrhizal fungal communities . Ecology , 73 : 2034 – 2042 .
- Kayama , M . 2001 . "Comparison of the aluminum tolerance of Miscanthus sinensis Anderss. and Miscanthus sacchariflorus Bentham in hydroculture . Int. J. Plant Sci. , 162 : 1025 – 1031 .
- Koch , AM , Kuhn , G , Fontanillas , P , Fumagalli , L , Goudet , J and Sanders , IR . 2004 . "High genetic variability and low local diversity in a population of arbuscular mycorrhizal fungi . Proc. Natl Acad. Sci. USA , 101 : 2369 – 2374 .
- Kochian , LV , Hoekenga , OA and Piñeros , MA . 2004 . "How do crop plants tolerate acid soils? Mechanisms of aluminum tolerance and phosphorous efficiency . Ann. Rev. Plant Biol. , 55 : 459 – 493 .
- Legendre , P and Gallagher , E . 2001 . "Ecologically meaningful transformations for ordination of species data . Oecologia , 129 : 271 – 280 .
- Murakoshi , T , Tojo , M , Walker , C and Saito , M . 1998 . "Arbuscular mycorrhizal fungi on adjacent semi-natural grasslands with different vegetation in Japan . Mycoscience , 39 : 455 – 462 .
- Oba , H , Shinozaki , N Oyaizu , H . 2004 . "Arbuscular mycorrhizal fungal communities associated with some pioneer plants in the Lahar area of Mt. Pinatubo, Philippines . Soil Sci. Plant Nutr. , 50 : 1195 – 1203 .
- Oehl , F , Sieverding , E , Ineichen , K , Ris , E-A , Boller , T and Wiemken , A . 2005 . "Community structure of arbuscular mycorrhizal fungi at different soil depths in extensively and intensively managed agroecosystems . New Phytol. , 165 : 273 – 283 .
- Ohtsuka , T , Sakura , T and Ohsawa , M . 1993 . "Early herbaceous succession along a topographical gradient on forest clear-felling sites in mountainous terrain, Central Japan . Ecol. Res. , 8 : 329 – 340 .
- Öpik , M , Moora , M , Liira , J and Zobel , M . 2006 . "Composition of root-colonizing arbuscular mycorrhizal fungal communities in different ecosystems around the globe . J. Ecol. , 94 : 778 – 790 .
- Pivato , B , Mazurier , S Lemanceau , P . 2007 . "Medicago species affect the community composition of arbuscular mycorrhizal fungi associated with roots . New Phytol. , 176 : 197 – 210 .
- Powell , B and Martens , M . 2005 . "A review of acid sulfate soil impacts, actions and policies that impact on water quality in Great Barrier Reef catchments, including a case study on remediation at East Trinity . Marine Pol. Bull. , 51 : 149 – 164 .
- Prasittikhet , J and Gambrell , R . 1989 . "Acidic sulfate soils ” . In Acidic Precipitation. Volume 4: Soils, Aquatic Processes, and Lake Acidification. Advances in Environmental Science , Edited by: Norton , S , Lindberg , S and Page , A . Volume 4 , 35 – 62 . New York : Springer-Verlag .
- Ramette , A . 2007 . "Multivariate analyses in microbial ecology . FEMS Microbiol. Ecol. , 62 : 142 – 160 .
- Saito , K , Suyama , Y , Sato , S and Sugawara , K . 2004 . "Defoliation effects on the community structure of arbuscular mycorrhizal fungi based on 18S rDNA sequences . Mycorrhiza , 14 : 363 – 373 .
- Smith , SE and Read , DJ . 1997 . Mycorrhizal Symbiosis , San Diego : Academic Press .
- Trouvelot , S , van Tuinen , D , Hijri , M and Gianinazzi-Pearson , V . 1999 . "Visualization of ribosomal DNA loci in spore interphasic nuclei of glomalean fungi by fluorescence in situ hyhridization . Mycorrhiza , 8 : 203 – 206 .
- Truog , E . 1930 . "The determination of the readily available phosphorus of soils . J. Am. Soc. Agron. , 22 : 874 – 882 .
- van Tuinen , D , Jacquot , E , Zhao , B , Gollotte , A and Gianinazzi-Pearson , V . 1998 . "Characterization of root colonization profiles by a microcosm community of arbuscular mycorrhizal fungi using 25S rDNA-targeted nested PCR . Mol. Ecol. , 7 : 879 – 887 .
- Turnau , K , Ryszka , P , Gianinazzi-Pearson , V and van Tuinen , D . 2001 . "Identification of arbuscular mycorrhizal fungi in soils and roots of plants colonizing zinc wastes in southern Poland . Mycorrhiza , 10 : 169 – 174 .
- Vandenkoornhuyse , P , Husband , R Daniell , TJ . 2002 . "Arbuscular mycorrhizal community composition associated with two plant species in a grassland ecosystem . Mol. Ecol. , 11 : 1555 – 1564 .
- Wu , B , Hogetsu , T , Isobe , K and Ishii , R . 2007 . "Community structure of arbuscular mycorrhizal fungi in a primary successional volcanic desert on the southeast slope of Mount Fuji . Mycorrhiza , 17 : 495 – 506 .
