Abstract
Organic amendment is a traditional practice for rehabilitating saline patches in north-east Thailand, but organic matter is known to enhance methane emission. However, a high degree of salinity might mitigate methane emission. The objective of the present study was to quantify the effects of salinity and organic amendments on methane emission from rain-fed paddy fields exposed to increasing salinity. A paddy field on a salt-affected Typic Natraqualfs was selected. Eighteen experimental plots were located in two randomized complete block designs placed inside and outside a saline patch. Each design of nine plots presented three replicates of two different organic amendments and a control treatment without organic amendment. During the rainy season the soil electrical conductivity, measured with an electromagnetic conductivity meter (ECEM), was greater than 300 mS m−1 inside the saline patch, whereas outside the saline patch the values were lower than 200 mS m−1. Rice straw (6.25 t ha−1) and cow manure (8.99 t ha−1), representing similar amounts of carbon, were incorporated. Methane emission from the soil, EC1:5 and soil redox potential (Eh) were monitored during the rice-growing season. High methane emission was mostly associated with low Eh, 48% of the Eh measurements were between −100 mV and −200 mV. In the saline patch, the average methane emission ranged from 251 to 334 mg CH4 m−2 day−1; outside the saline patch the values had a wider range from 209 to 544 mg CH4 m−2 day−1. The addition of rice straw or cow manure significantly enhanced methane emission by an approximate factor of 2.5 outside the saline patch, but did not significantly increase methane emission inside the saline patch. The attenuating effect of salinity on methane emission was particularly strong at the beginning of flooding during the first 20 days after transplanting and at the end of flooding (from 54 days after transplanting). When applied to saline patches, organic amendment did not significantly enhance methane emission in the first year.
INTRODUCTION
During the 20th century a considerable increase in atmospheric methane (CH4) is believed to be responsible for climate changes (CitationIntergovernmental Panel on Climate Change 2001). In this context, the scientific community promoted the control of greenhouse gas emissions via the Kyoto Protocol. Natural sources of methane emission are mainly wetlands (CitationLi et al. 2004), peat soils (CitationInubushi et al. 2005) and floodplains (CitationWassmann and Martius 1997). Because of the flooding conditions required for their cultivation, paddy fields are known to be one of the main anthropogenic sources of CH4 gas (CitationDubey 2005). Various studies of different rice ecosystems have found that methane emissions from paddy soil are influenced by soil texture, soil type, moisture regime, cultivation methods, different rice varieties and the submergence period (CitationDubey 2005).
In north-east Thailand, most farmers grow glutinous rice for self-consumption in lowland paddy fields, and have faced an escalating salinity problem as a result of disturbance to the hydrological cycle generated by deforestation in the past and the presence of underground layers of evaporites in the two main river basin areas of the region (CitationArunin 1984). In 2005, the total rice cultivation area in north-east Thailand encompassed 6.074 million ha, of which approximately 2.848 million ha were considered to be potentially affected by salinity hazards. The most severely affected areas (37, 655 ha) are located in the lowlands.
Organic matter incorporation is a traditional practice for rehabilitating saline patches (CitationArunin 1984; CitationPatcharapreecha et al. 1990). North-eastern farmers apply cow manure (CitationSaenjan and Sributta 2002) or rice straw (CitationMotomura et al. 1976) at rates of 5.2–5.7 t ha−1 to improve rice yields in saline paddy fields. Organic amendment is known to enhance methane emission in rice fields (CitationDenier van der Gon and Neue 1995a). For instance, the application of rice straw at rates of 6–9 t ha−1 in Japan increased paddy field methane emission rates by factors of 1.8–3.5 (CitationYagi and Minami 1990). A number of authors have examined methane emissions in rain-fed rice in north-east Thailand (CitationChairoj et al. 1997; CitationSaenjan and Sributta 2002) and the influence of diverse organic amendments (CitationJermsawatdipong et al. 1994; CitationNaser et al. 2007; CitationWatanabe and Kimura 1998; CitationWatanabe et al. 1993, Citation1998). Traditional techniques for saline patch rehabilitation can increase methane emission; however, high soil salinity is known to diminish methane emission. CitationDenier van der Gon and Neue (1995b) showed that an increase in the salt content of pore water to an electrical conductivity of 4 dS m−1 led to a 25% reduction in the methane emission rate compared with a control plot. In laboratory incubations, the addition of salt progressively decreased methane emission in relation with low microbial activities and populations as reflected by decreased microbial biomass C and low soil microbial populations, including methanogens (CitationPattnaik et al. 2000). CitationMishra et al. (2003) suggested that different processes might be involved in the inhibition of methane emissions resulting from sulfate or chloride salts, and stated that salt amendment does not adversely affect soil microbial activity in terms of soil redox potential and pH. Incubation studies with salt-added paddy soils have shown that high salinities can attenuate CH4 emission (CitationLawongsa and Wada 1988; CitationSaenjan and Wada 1990). CitationSaenjan and Sributta (2002) carried out a field study to quantify the influence of cow manure amendment on methane emissions in two rain-fed saline paddy fields and a non-saline field. However, the fields had different owners and different salinity levels, which hampered the comparisons of methane emission in relation to the salinity levels. Accordingly, little is known about the quantitative effects of salinity and organic amendments on methane emissions in paddy-field areas.
The objective of the present study was to quantify the effects of salinity and organic amendments on the rate of methane emission in rain-fed paddy fields exposed to increasing salinity levels.
MATERIALS AND METHODS
Study site
The study site was located in north-east Thailand in Ban Daeng village (24°85′E, 18°11′N). Hourly recorded temperatures at the study site during the experiment averaged 27.8°C, with a minimum of 21.6°C and a maximum of 35.8°C. Precipitation during the experiment was 496.8 mm from June to November; 250.7 mm was recorded from transplanting to harvest. The soil was classified as coarse-loamy, mixed, active, isohyperthermic, Typic Natraqualfs (CitationUS Department of Agriculture 1999) and as “Kula Ronghai” in the Thai soil series (CitationSujinai 1999). The site reflected a typical salt-affected soil with saline patches. A saline patch was defined as a continuous area of cultivated paddy field where the soil salinity was sufficient to decrease rice yields and where saline crusts were present during the dry season. Selection of the experimental site was based on previous surveys and monitoring of soil and pore water salinity (CitationGrünberger et al. 2005; CitationQuantin et al. 2008). A survey of the electrical conductivity (ECEM) of the soil was carried out with an electromagnetic conductivity meter (EM38; Geonics, Mississauga, Ontario, Canada) in the rainy season of 2004. The ECEM values exceeded 300 mS m−1 inside the saline patch, whereas outside the saline patch the ECEM values were less than 200 mS m−1. These areas were also monitored for electrical conductivity in soil pore water (ECW) during the rice cycles of 2003 and 2004. The ECW ranged from 24.7 dS m−1 in the saline patch to 3.49 dS m−1 outside the saline patch (CitationGrünberger et al. 2005). In the dry season of March 2005, prior to the experiment, soil depths (0–15 cm) within and outside the saline patch were measured for Na (3,650 mg kg−1 and 1,150 mg kg−1, respectively) and the electrical conductivity of saturated paste (ECE) (14.2 dS m−1 and 4.7 dS m−1, respectively).
Preparation of the study plots
In the present experiment, the experimental block consisted of small plots submitted to two different levels of salinity, inside a saline patch and outside a saline patch, using two different organic amendments and a control treatment with no organic amendment. First, all remaining rice straw was removed from the surface and then hand plowing was carried out on 23 June 2005 to a depth of 20 cm. Incorporation was carried out on 5 July with careful mixing. Transplanting of the rice variety RD6 took place on 21 August with a hill spacing of 25 cm. No chemicals were used during the cycle according to the general practice of north-eastern Thai rice farmers in salt-affected areas. Experimental square plots of 2.25 m2 were delineated using plastic-coated canvas strips. Plastic material was preferred to metal or wood because it prevents contamination by rusting or decomposition. Canvas was hung on wooden sticks placed at the corners of the plot to reduce the exchange of solutes and microorganisms between the plots. The partially buried strips isolated the first 20 cm of the topsoil and the surface water to a depth of 30 cm.
Monitoring of the water depth indicated that all plots were continuously flooded from transplanting until 1 October. Maximum water depth was reached on 28 September with an average depth of 11.2 cm. No surface water was observed from 26 October to the time of harvesting.
The experimental plots were arranged in a randomized complete block design (RCBD) with three replicates. There were 18 plots located in the same field. Each plot was identified with a code: SP indicated plots inside the saline patch and OSP corresponded to plots outside the saline patch. The two organic matter amendments tested (rice straw and cow manure) were selected as the most realistic local farmers’ practices for small land owners in the salt-affected areas (CitationSaenjan and Sributta 2002). The straw remaining from the last harvest was removed and weighed to assure the same starting status of carbon for all plots. Rice straw (6.25 t ha−1) and cow manure (8.99 t ha−1) were applied in accordance with Land Development Department guidelines for field cultivation in north-east Thailand. The two organic amendments had the same amounts of carbon (2.96 t C ha−1).
Measurement of methane emission
Methane emission was measured by a “gas trap” consisting of a closed chamber (inner diameter 22 cm, height 65 cm) made of polyvinyl chloride and equipped with a battery-powered fan surmounted by a thermometer. For each measurement, the gas chamber was settled on a circular base that was implanted permanently into the soil, just after flooding. The base consisted of a ring with the same diameter as the chamber. The lower part was driven to a depth of 5 cm inside the soil and the upper part consisted of a slot (1-cm depth) into which the lower part of the gas chamber was inserted. If no surface water was present at the time of measurement, the slot was kept full of water to ensure good sealing from the atmosphere. The gas trap was placed in the center of the plot on a rice hill. Sampling was carried out between 09.00 and 11.00 hours (CitationWang et al. 1999). Syringe sampling was carried out every 5 min over 20 min and the methane contents were measured. Measurements were carried out every week from the first day of transplanting until harvest. The methane concentrations were analyzed using a gas chromatograph equipped with a flame ionization detector. The methane emission rate was computed from the increase in CH4 concentration in the air with time using the volume of the chamber. Detailed measurements of daily methane emission rates were used to study the dynamics of methane emission, whereas averages along the rice cycle were used to give a concise idea of the effect of the treatment. The daily methane emission rates obtained from the replicate plots were used to compute the mean emission rate. The relationship between the daily methane emission rates was plotted over the growth period with the error bars representing the 95% confidence interval.
After land preparation, a redox potential (Eh) electrode was buried to a depth of 10 cm near the gas trap. Only one replicate of each treatment was monitored. Manual measurements were carried out every 5–6 days.
Soil samples for the determination of electrical conductivity (EC1:5) were collected from 0–15 cm depths. Soil samples were conducted every 2 weeks and before and after harvesting.
To evaluate the effect of the treatments on the average methane emission rate during the rice cycle, on EC1:5 and on the agronomic data, significant differences between treatments were assessed by anova and post-hoc Tukey's honestly significant difference (HSD) multiple range tests. Computation was carried out using the Statistix 8 software package (Statistix, Tallahassee, FL, USA).
RESULTS
Agronomic measurements
As shown in , plots located inside the saline patch had significantly lower grain yields (480–597 kg ha−1) than plots located outside the saline patch (2,493–2,991 kg ha−1). No significant difference in grain yield between the control and the amended treatments was observed either inside or outside the saline patch. Average dry straw weights followed the same trend observed for grain yield, with higher weights outside the saline patch than inside the saline patch.
Although the EC1:5 averages were always higher in the saline patch, no systematic significant differences were observed between locations or between treatments for the same location because of large variation in the EC1:5 values. The cow-manure treatment had a significantly higher EC1:5 average inside the saline patch; the rice-straw treatment outside the saline patch had a significantly lower average value. The other average values were statistically homogenous.
Average methane emissions
Within the saline patch, the average methane emission rates during the rice cycle ranged from 251 to 334 mg CH4 m−2 day−1, whereas outside the saline patch the values ranged from 209 to 544 mg CH4 m−2 day−1 ().
Table 1 Average methane emission, salinity and agronomic data
In the control treatment, average CH4 emissions in the saline patch (251 mg CH4 m−2 day−1) and outside the saline patch (209 mg CH4 m−2 day−1) were not significantly different. Inside the saline patch, methane emission in the control treatment (251 mg CH4 m−2 day−1) was not significantly different from the average methane emission in the treatment with organic matter (334 mg CH4 m−2 day−1 for rice straw and 300 mg CH4 m−2 day−1 for cow manure) (). Conversely, outside the saline patch the average methane emission in the control treatment (209 mg CH4 m−2 day−1) was significantly different from the treatments with organic matter (544 mg CH4 m−2 day−1 for rice straw and 529 mg CH4 m−2 day−1 for cow manure). No significant difference was found between the emission rates of the rice straw and cow manure treatments inside the saline patch (334 mg CH4 m−2 day−1 for rice straw and 300 mg CH4 m−2 day−1 for cow manure) and outside the saline patch (544 mg CH4 m−2 day−1 for rice straw and 529 mg CH4 m−2 day−1 for cow manure). A significant difference was found between the average emissions outside and inside the saline patch for the rice straw and cow manure treatments; emission rates decreased by 38% and 43%, respectively.
Effect of salinity on methane emission rates
Methane emission in the control treatment outside the saline patch was initiated after transplanting and reached a maximum of 755.2 mg CH4 m−2 day−1 at 26 days after transplanting (DAT) (), whereas inside the saline patch the CH4 emission of the control treatment was initiated more slowly after transplanting and reached a maximum of 783.3 mg CH4 m−2 day−1 at 45 DAT ().
In the control treatment, CH4 emission rates outside the saline patch from 32 to 66 DAT (129.8–337.6 mg CH4 m−2 day−1) () were lower than the values recorded inside the saline patch (162.9–783.3 mg CH4 m−2 day−1) (). This difference in emission could be attributable to the quicker exhausstion of soil organic substrate stock outside the saline patch caused by the quicker initiation of methane emission in this location.
Figure 1 Methane emission rates outside the saline patch. The vertical bar represents the confidence interval of the mean at 95%. OSP, plots outside the saline patch; C, control treatments with no amendments; RS, rice-straw amendment treatments; CM, cow-manure amendment treatments.
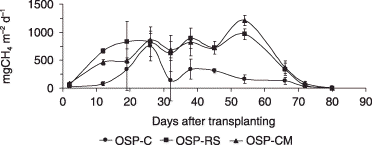
Figure 2 Methane emission rates inside the saline patch. The vertical bar represents the confidence interval of the mean at 95%. SP, plots inside the saline patch; C, control treatments with no amendments; RS, rice-straw amendment treatments; CM, cow-manure amendment treatments.
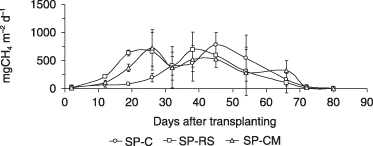
In the organic amendment treatments, at 12 and 54 DAT, daily emission rates were significantly depleted inside the saline patch compared with outside the saline patch (, ). Nevertheless, during the other days, methane emission in the saline patch was more depleted than outside the saline patch, although the confidence intervals overlapped. A decrease in the emission rates was observed in almost all situations after 66 DAT because natural dry and aerobic conditions prevailed in the soil from 32 days before harvest.
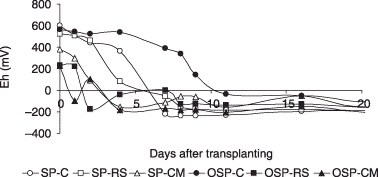
Soil redox potential and methane emission rates
The Eh evolution of the buried probes during the first 20 DAT () illustrates the dynamics of the establishment of reduced conditions that could be related to the evolution of methane emission. Decreasing Eh values with time differed between treatments; Eh values decreased quicker in the amended treatments outside the saline patch than inside the patch.
Effect of organic matter on methane emission rates
The overall results indicated that CH4 emission rates in organic amendment treatments (rice straw and cow manure) were higher, although not always significantly higher, than the control treatments in both locations (). Throughout the rice cycle (), daily CH4 emission rates from outside the saline patch followed the order of treatments: rice straw > cow manure > no amendment, with overlapping error bars. This order of emission rates between treatments was observed very clearly before 20 DAT. Hence, different methane emission rates between the amendment treatments and locations were found at the beginning of flooding, with a sequence that reflected the same order in the treatments. The high salinity level () did not change the relative order between treatments, but did delay the establishment of methane emission for a 12 days. No significant difference was observed after 26 DAT inside the saline patch, whereas outside the saline patch the organic amendments maintained methane emission rates significantly higher than in the control treatment between 38 and 72 DAT ().
Figure 3 Redox potential (Eh) measurements with buried probes during the first 20 days after transplanting. OSP, plots outside the saline patch; SP, plots inside the saline patch; C, control treatments with no amendments; RS, rice-straw amendment treatments; CM, cow-manure amendment treatments.
DISCUSSION
In the present experiment, the grain yield 2493–2991 kg ha−1 was within the range of the yields recorded for rain-fed paddy fields in north-east Thailand in similar studies (CitationJermsawatdipong et al. 1994; CitationSaenjan and Sributta 2002). These grain yields and the corresponding straw weights were higher outside the saline patch than inside the patch, and were significantly correlated (R 2 = 0.69, P = 0.04, n = 6). The average EC1:5 was positively related to the weight of the empty grains (R 2 = 0.51, P = 0.1, n = 6), indicating that the main effect of salinity was to impair the filling of the grains at the end of the rice cycle.
Over the whole experiment, the average methane emission rates 209–544 mg CH4 m−2 day−1 corresponded to a range of total emission during the rice cycle (80 days) of between 16.7 and 43.5 g CH4 m−2. The range observed in our study was similar to previous studies conducted in the saline paddy fields of north-east Thailand by CitationSaenjan and Sributta (2002). Under continuous flooding with the application of 5.2–5.7 t ha−1 of cow manure, the total methane emission ranged from 19.3 to 30.4 g CH4 m−2, whereas from saline paddy fields without cow manure the emissions ranged from 18.1 to 25.0 g CH4 m−2 (CitationSaenjan and Sributta 2002). Applying rice straw or cow manure had no distinct effect on the average CH4 emissions, probably because a similar amount of carbon content was applied in both salinity conditions. Nevertheless, outside the saline patch, the effect of the application of organic matter was very strong. Adding rice straw or cow manure outside the saline patch multiplied the methane emission rates by a factor of approximately 2.5, corresponding to an increase of 153–161% compared to the emission in the control treatment. These differences are in accordance with the results from another field experiment conducted in Japan where the application of rice straw at a rate of 6–9 t ha−1 increased CH4 emission rates in paddy fields in a low-salinity context by factors ranging from 1.8 to 3.5 (CitationYagi and Minami 1990).
Depletion of the acetotrophic methanogenic population with increasing NaCl contents was found by CitationMishra et al. (2003) in a laboratory experiment carried out on samples of alluvial soil with an ECW equal to 8 dS m−1. In our experiment, the mean ECW values for outside and inside the saline patch were 4.74 and 9.33 dS m−1, respectively, and approximated the experimental conditions of CitationMishra et al. (2003). Thus, in the presence of sufficient organic substrates, higher salinity can inhibit CH4 emission.
Grain yield, the weights of the empty grains and the maximum height of the plants could not be related linearly to average methane emissions. Moreover, there was no significant correlation between rice straw weight and average emission (R 2 = 0.04, P = 0.7, n = 6); hence, in the present experiment, mitigation of methane emission by salinity might not be related to poor rice plant growth, which would have impaired the transport of CH4 through the plants (CitationWassmann et al. 1996).
In the control treatments, quicker initiation of methane emission outside the saline patch resulted in a lower methane emission in the middle of the rice season, which could be attributed to the quicker exhaustion of soil organic substrate stock outside the saline patch. In the amendment treatments, the initial stage of methane formation was susceptible to the saline conditions (, ); thus, at 12 DAT, methane formation was slower in the saline patch than outside the saline patch. At 54 DAT, the naturally dry and aerobic conditions prevailing in the soil, 32 days before harvest, led to oxidative soil conditions and a decrease in emission rates at all salinities (, ). During these two periods, soil pore water electrical conductivity (ECW), which was lower than 4 dS m−1 (data not presented), was related to methane emissions greater than 460 mg CH4 m−2 day−1, whereas ECW values greater than 4 dS m−1 had methane emission rates lower than 460 mg CH4 m−2 day−1.
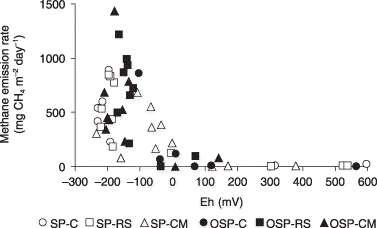
High methane emission was mostly associated with low Eh in all plots equipped with Eh probes () consistent with the requirement of reduced conditions for the methanogens to develop (CitationWang et al. 1992). The relationships between methane emission rate and Eh value () showed that the large group of low Eh values ranging from −100 to −250 mV corresponding to a large variation in methane emission rates 100–1,400 mg CH4 m−2 day−1. Higher Eh values from −100 to 0 mV were found and were consistent with the lower methane emission rates of 0–500 mg CH4 m−2 day−1 found mostly in the saline patch plots with cow manure. Redox potential values greater than 0 mV corresponded to low methane emission rates of less than 100 mg CH4 m−2 day−1. A clear explanation of the relationship between Eh and methane emission rates as a result of the effect of in situ soil salinity is not known (). Methane emissions associated with Eh values in this range have previously been reported and discussed by CitationYagi and Minami (1990) and more recently by CitationSetyanto et al. (2004).
Figure 4 Relationships between methane emission rate and redox potential (Eh). OSP, plots outside the saline patch; SP, plots inside the saline patch; C, control treatments with no amendments; RS, rice-straw amendment treatments; CM, cow-manure amendment treatments. Figure was drawn after discarding some ambiguous implicative values (11 out of 66 data points).
Conclusions
A significant drop in methane emission rates inside the saline patch compared with outside the saline patch was only observed in organic-matter-amended plots. The decrease in average methane emission rates as a result of high salinity (salt patch) was 38% for the rice-straw treatments and 43% for the cow-manure treatments. Moreover, in all of the amended treatments, the average methane emission rates were negatively correlated with the average EC1:5 of the soil extract. Analysis of the different parts of the rice cycle highlighted that, for each amended treatment, drops in methane emissions at high salinity levels occurred mainly in the first 20 DAT and after 54 DAT. The distinct behaviors in the different treatments could be clearly separated into the first 20 DAT; methanogenesis inside the saline patch was obviously delayed compared with that outside the saline patch. During this period, the sequence of the relative order between treatments rates was rice straw > cow manure > control. Finally, inside the saline patch, the organic-amendment treatments were not significantly different from the control treatment; consequently, traditional salinity remediation techniques can be applied in high-salinity spots in north-eastern Thailand with no major incidences for the methane budget of rain-fed paddy fields.
ACKNOWLEDGMENTS
This research was realized under the umbrella of the Thailand International Cooperation Agency project “Improving the management of salt-affected soils. Case of saline patches in rain-fed paddy fields in northeast Thailand”. The authors want to express their gratitude for the financial support provided by the French Ministry of Research through the ECCO/PNBC project: “Evaluation of the role of environmental parameters and bacterial activities in the dynamics of iron and manganese in the plants rhizosphere application to paddy fields soils”. The French Embassy in Thailand and Khon Kaen University also supported this study via the Franco–Thai consortium.
Related Research Data
REFERENCES
- Arunin , S . 1984 . “ Characteristics and management of salt-affected soils in the northeast of Thailand ” . In Ecology and Management of Problem Soils in Asia , Edited by: Bay-Petersen , J. 336 – 351 . Taiwan : Food and Fertilizer Technology Center for the Asian and Pacific Region .
- Chairoj , P , Cholitkul , W , Katoh , K , Tsuruta , H , Yagi , K and Minami , K . 1997 . Methane emission from paddy fields . Thai J. Soils Fertil , 19 : 85 – 94 . (English abstract)
- Denier van der Gon , HAC and Neue , HU . 1995a . Influence of organic matter incorporation on the methane emission from a wetland rice field . Global Biogeochem. Cycles , 9 : 11 – 22 .
- Denier van der Gon , HAC and Neue , HU . 1995b . Methane emission from a wetland rice field as affected by salinity . Plant Soil , 170 : 307 – 313 .
- Dubey , SK . 2005 . Microbial ecology of methane emission in a rice agroecosystem . Appl. Ecol. Environ. Res , 3 : 1 – 27 .
- Grünberger , O , Maeght , JL , Montoroi , JP , Rattana-Anupap , S , Wiengwongnam , J and Hammecker , C . Assessment of salinity hazard by time domain reflectometry in flooded sandy paddy soils . Proc. of the Management of Tropical Sandy Soils for Sustainable Agriculture (Session 3) . 27 2005 . pp. 112 – 117 . Thailand : Khon Kaen .
- Inubushi , K , Otake , S Furukawa , Y . 2005 . Factors influencing methane emission from peat soils: comparison of tropical and temperate wetlands . Nutr. Cycling Agroecosyst , 71 : 93 – 99 .
- Intergovernmental Panel on Climate Change . 2001 . “ Climate Change 2001 ” . In The Scientific Basis , Edited by: Houghton , JT , Ding , Y , Nogua , M , Griggs , D , Vander Linden , P and Maskel , K . 239 – 288 . Cambridge : Cambridge University Press .
- Jermsawatdipong , P , Murase , J Prabuddham , P . 1994 . Methane emission from plots with differences in fertilizer application in Thai paddy fields . Soil Sci. Plant. Nutr , 40 : 63 – 71 .
- Lawongsa , P and Wada , H . Effects of salts on microbial metabolism in submerged soils . Proc. of the First International Symposium on Paddy Soil Fertility (Part II) . December 6–13 1988 . pp. 601 – 613 . Thailand : Chiang Mai .
- Li , C , Cui , J , Sun , G and Trettin , C . 2004 . Modeling impacts of management on carbon sequestration and trace gas emissions in forested wetland ecosystems . Environ. Manage , 33 ( Suppl. 1 ) : S176 – S186 .
- Mishra , SR , Pattnaik , P , Stehunathan , N and Adhya , TK . 2003 . Anion mediated salinity affecting methane production in a flooded alluvial soil . Geomicrobiol. J , 20 : 579 – 586 .
- Motomura , S , Seirayosakol , A and Cholitkul , W . 1976 . “ The changes in some physical and chemical properties of paddy soils under water management ” . Tropical Agriculture Research Series No. 9 Edited by: Hayashi , K , Konno , S , Takahashi , T , Iwata , F , Miyake , M and Wada , G . 101 – 115 . Ibaraki : Tropical Agriculture Research Center, Ministry of Agriculture, Forestry and Fisheries .
- Naser , HM , Nagata , O , Tamura , S and Hatano , R . 2007 . Methane emissions from five paddy fields with different amounts of rice straw application in central Hokkaido, Japan . Soil Sci. Plant Nutr , 53 : 95 – 101 .
- Patcharapreecha , P , Topark-ngarm , B , Goto , I and Kimura , M . 1990 . Studies on saline soils in Khon Kaen region, Northeast Thailand. (III. Effects of amelioration treatments on physical and chemical properties of the saline soil) . Soil Sci. Plant Nutr , 36 : 363 – 374 .
- Pattnaik , P , Mishra , SR , Bharati , K , Mohanty , SR , Settunathan , N and Adhya , TK . 2000 . Influence of salinity on methanogenesis and associated microflora in tropical rice soils . Microbiol. Res , 155 : 215 – 220 .
- Quantin , C , Grünberger , O , Suvannang , N and Bourdon , E . 2008 . Land management effects on biogeochemical functioning of salt-affected paddy soils . Pedosphere , 18 : 183 – 194 .
- Saenjan , P and Sributta , A . 2002 . Methane emission from on-farm saline paddy fields in Khon Kaen . J. Soils Fertil , 24 : 127 – 141 . (English abstract)
- Saenjan , P and Wada , H . Effects of salts on methane formation and sulfate reduction in submerged soil . Transactions of the 14th International Congress of Soil Science . August 12–18 , Kyoto, Japan. Volume 2 , pp. 244 – 248 . Commission 2
- Setyanto , P , Rosenani , AB , Boer , R , Fauziah , CI and Khanif , MJ . 2004 . The effect of rice cultivars on methane emission from irrigated rice field . Indones. J. Agric. Sci , 5 : 20 – 31 .
- Sujinai , A . 1999 . Study of Soil Resources and Land Potential in Khon Kaen , Bangkok : Soil Survey Division, Land Development Department . ISBN 974-7723-10-7 (in Thai)
- US Department of Agriculture . 1999 . Keys to Soil Taxonomy , 8th edn , Virginia : Pocahontas Press .
- Wang , B , Neue , HU and Samonte , HP . 1999 . Factors controlling diel patterns of methane emission via rice . Nutr. Cycling Agroecosyst , 53 : 229 – 235 .
- Wang , ZP , Lindau , CW , Delaune , RD and Patrick , WH Jr . 1992 . Methane production from anaerobic soil amended with rice straw and nitrogen fertilizers . Fertil. Res , 33 : 115 – 121 .
- Wassmann , R and Martius , CS . 1997 . “ Methane emission from the Amazon flood plain ” . In The Central Amazon FloodplainEcological Studies , Edited by: Junk , WJ . Vol. 126 , 137 – 143 . Berlin : Springer Verlag .
- Wassmann , R , Neue , HU Alberto , MCR . 1996 . Fluxes and pools of methane in wetland rice soils with varying organic inputs . Environ. Monitoring Assess , 42 : 163 – 173 .
- Watanabe , A , Katoh , K and Kimura , M . 1993 . Effect of rice straw application on CH4emission from paddy fields. (II. Contribution of organic constituents in rice straw.) . Soil Sci. Plant Nutr , 39 : 707 – 712 .
- Watanabe , A and Kimura , M . 1998 . Effect of rice straw application on CH4emission from paddy fields. (IV. Influence of rice straw incorporated during the previous cropping period.) . Soil Sci. Plant Nutr , 44 : 507 – 512 .
- Watanabe , A , Yoshida , M and Kimura , M . 1998 . Contribution of rice straw carbon to CH4emission from rice paddies using 13C-enriched rice straw . J Geophys Res , 103 : 8237 – 8242 .
- Yagi , K and Minami , K . 1990 . Effect of organic matter application on methane emission from some Japanese paddy fields . Soil Sci. Plant Nutr , 36 : 599 – 610 .