Abstract
Peatlands can export large amounts of carbon in various forms, including surface gas emissions and the discharge of dissolved carbon under aerobic/anaerobic soil degradation. Therefore, an apparent imbalance can be expected between gaseous CO2 production and O2 consumption in unsaturated peat layers. The present study monitored profiles of soil CO2 and O2 in Bibai mire, Hokkaido, Japan, with the aim of examining the apparent imbalance between the two gases. The CO2 abundance to the atmospheric level did not exceed the O2 deficit because the CO2 concentrations were 0.21, 0.75 and 2.92%, whereas the O2 concentrations were 19.71, 18.05 and 9.51% at depths of 10, 20 and 30 cm, respectively. This shortage of CO2 abundance implied that a remarkable amount of CO2 dissolved into the liquid phase. The dissolved CO2 mass on the basis of Henry's law ranged from 1.72 to 159.3 mmol m−2 (10 cm)−1, and was 1.59–5.25-fold greater than the gaseous CO2 mass. The mass balance analyses showed that the CO2 production rate in the gaseous phase at a depth of 20 cm ranged from 6.52 to 23.11 mmol m−2 (10 cm)−1 day−1, equivalent to 43% on average of the O2 consumption rate. This CO2 production rate contributed to less than 10% of the gaseous CO2 produced in the unsaturated peat layer, which had a maximum thickness of 40 cm, implying the existence of a large CO2 source in the peat layer, including in the saturated zone. The mass balance analyses also showed that the residence time of CO2 in the gaseous phase alone was 0.351 day, whereas that in the whole peat soil matrix was 0.919 day at a depth of approximately 20 cm, suggesting that high water content serves as a tentative storage for gaseous CO2 in peatlands.
INTRODUCTION
Peatlands in the northern hemisphere contain up to 455 Gt carbon, which is equivalent to 20–30% of the world's soil carbon pool (CitationGorham 1991) or 60% of the atmospheric carbon (CitationOechel et al. 1993). These water-rich terrestrial ecosystems are seemingly so fragile for climatic and hydrological changes that a rise in atmospheric temperature of only a few degrees can double the rate of peat soil decomposition (CitationChapman and Thurlow 1998), and possibly promote the release of soil carbon.
Soil gaseous CO2 concentration and its surface gas flux are believed to reflect the respiration of soil microbes in the unsaturated zone of a peatland because aerobic microbes mainly produce CO2. The CO2 fluxes from peatland surfaces have been measured intensively and the values observed have varied widely from tens to over 1000 mg CO2 m−2 h−1 (CitationChapman and Thurlow 1996; CitationIkkonen et al. 2001; CitationLangeveld et al. 1997; CitationMaljanen et al. 2001). Larger values of CO2 surface gas flux tend to be observed when the groundwater table is lowered in the form of seasonal fluctuation or drainage in a wetland. CitationHaraguchi et al. (2003) reported that the O2 consumption rate at peatland surfaces was significantly negatively correlated with the highest groundwater table, and positively correlated with the range of groundwater table fluctuations. Occasional extreme lowering of the groundwater table can also enhance peat soil decomposition. CitationGlatzel et al. (2006) observed surface gas CO2 fluxes of 23.4 ± 3.0 g CO2 m−2 day−1 in a drought summer and reported that the lowering of groundwater table to a depth of more than 40 cm caused temporal, rapid decomposition of the surface peat. Contrary to lowering of the groundwater table, rewetting of the peat layers might decrease the mineralization rate of peat soils, and can reduce the surface gas emission of CO2 (CitationBest and Jacobs 1997).
In drained peatlands, not only a surface CO2 gas flux, but also a CO2 discharge in a dissolved form via groundwater can be the fate of soil carbon. At a catchment scale, several studies have shown the importance of dissolved CO2 export to the total carbon budget in targeted ecosystems. CitationHuttunen et al. (2002) observed that the mean CO2 efflux from ponds was higher in a peatland-dominated catchment than in a forested catchment, implying that the peatlands inside the catchment were significant sources of dissolved carbon. CitationWorrall et al. (2005) and CitationWorrall and Burt (2005), based on carbon discharge data over three decades, determined that the amount of dissolved CO2 produced in peat soils ranged between 9.6 and 25.6 t C km−2 year−1 and that this would decrease the predicted value of the net CO2 sink by up to 50%.
If part of the gaseous CO2 dissolved into the liquid phase, the O2 deficit to an atmospheric level could be greater than the CO2 abundance in the soil gaseous phase. The O2 consumption rate might also exceed the CO2 production rate in the soil gaseous phase alone. Therefore, peat soil degradation cannot be properly estimated without focusing on the O2 consumption in the peat soil profiles. Concurrent monitoring of CO2 and O2 gases in a peat soil profile can verify these hypotheses and can aid our understanding of the environmental functioning of wetland ecosystems. To date, however, very few studies have observed the actual conditions regarding the balance between CO2 abundance and O2 deficit in in situ peat soil profiles, and the correlation between O2 consumption and CO2 production has yet to be uncovered.
The objective of the present study was to examine seasonal changes in in situ gaseous CO2 profiles with complementary monitoring of an O2 gas profile in drained peat layers. The gap between the CO2 production and the O2 consumption was evaluated on the basis of the mass balance concept with the monitored CO2 and O2 concentration profiles. Turnover of CO2 was also estimated in the near-surface layer of the peat soil profiles.
MATERIALS AND METHODS
Description of the study field
The study field was Bibai mire (43°19′N, 141°48′E), Hokkaido, Japan (). This mire, originally a typical ombrotrophic bog, has been preserved by the National Agricultural Research Center for Hokkaido Region and is approximately 50 ha in size. The areas surrounding the mire were completely reclaimed as crop fields approximately 50 years ago, and ditches around the mire have enhanced drainage from the mire. The groundwater table has lowered and is unstable at the periphery of the mire and invasive plants have infringed into the area of indigenous plant species, such as sphagnums and sedges. The experiment sites were located 10 m away from a ditch, where peat layers have been exposed to unsaturated conditions. The soil profile of the sites consisted of the following layers: from 0 to 10 cm depth: bamboo roots and decomposed peat with almost no distinctive shapes of original plants; from 10 to 20 cm depth: black peat including volcanic ash; from 20 to 30 cm depth: moderately decomposed peat originated from Carex middendorffii and Myrica gale Linn.; below 30 cm depth: high moor peat originated from Carex middendorffii and Myrica gale Linn. The profiles of bulk density, particle density, carbon content and C/N ratio were reported in CitationIiyama and Hasegawa (2005).
Figure 1 Locations of (a) Bibai-City in Hokkaido, Japan and (b) the sampling sites in the Bibai mire. Contour lines indicate every 20 cm difference a.s.l. (after Ito et al. 2001) complemented with measured data on a 50 m × 50 m grid.
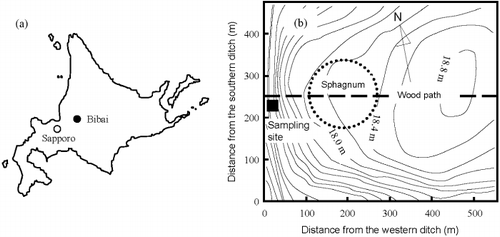
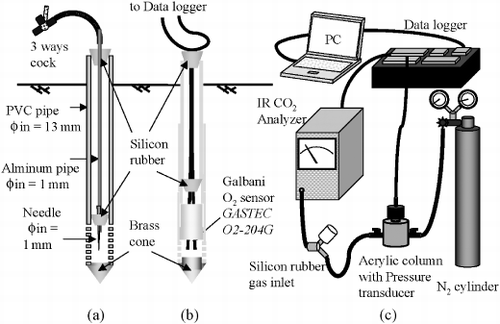
Figure 2 Equipment used for the soil gas measurements. (a) CO2 sampling tube, (b) O2 monitoring tube and (c) CO2 analyzing system.
Soil gases and temperature in the study field
Soil gaseous CO2 was sampled almost weekly using tubes (CitationOsozawa and Hasegawa 1995; CitationTackett 1968) that consisted of outer polyvinyl chloride (PVC) tubes and inner aluminum tubes (). The tubes were permanently installed at three sampling sites. The three sites were set up at approximately 1-m intervals following the direction of the ditch, one site was located 1 m closer to the ditch (site no. 3). The sampling depths at each site were 10, 20, 30, 40 and 50 cm. An air sample of 10 mL was withdrawn into a disposable plastic syringe from each gas sampling tube. These air samples were analyzed within 3 h. Preliminary tests using CO2 standards of 0.1550, 0.4970 and 9.9200% showed that the leakage of CO2 from a syringe within 3 h was less than 4% of the total CO2 enveloped in the syringe.
is a schematic diagram showing the monitoring tube used for soil gaseous O2. The monitoring depths were 5, 10, 20 and 30 cm and a single set of monitoring tubes was installed adjacent to the three CO2 sampling sites. The O2 concentration was sensed every 20 min using a Galbani-O2 battery (O2-204G; Gastec Corp., Ayase-City, Japan), which was attached inside a PVC tube, with a linear range of 0–25%. Both CO2 and O2 gases were monitored from July to November 2004.
shows the measurement system used to determine the CO2 concentration of a gas sample. The system consisted of an infrared CO2 gas analyzer (ZFP 5YA31; Sibata Scientific Technology, Tokyo, Japan), an N2 gas cylinder supplying a carrier gas, a pressure transducer (PA500; Nidec Copal Electronics Corp., Tokyo, Japan) for checking if the carrier gas flowed steadily under the atmospheric pressure, a data logger (CR10X; Campbell Scientific, Logan, UT, USA) and a personal computer to monitor signals from both the gas analyzer and the pressure transducer. Samples (8 mL) were injected into the measurement system. A calibration curve for transforming the analog data from the gas analyzer into CO2 concentration was plotted using CO2 standards of 0.1550, 0.4970 and 9.9200%. The coefficients of variation for detecting CO2 concentration using this system were less than 2% for atmospheric level samples and less than 1% for samples with higher concentration values.
The level of the groundwater table was monitored concurrently with the CO2 gas sampling using a perforated PVC tube installed adjacent to the gas sampling tubes. Daily precipitation was measured by a tipping bucket rain gauge. The soil temperature profile was monitored every 20 min over the whole year in 2004 using waterproof microloggers (TBI32-20+50; Onset Computer Corp., Pocasset, MA, USA) buried at depths of 2, 10, 20, 30 and 50 cm.
CO2 mass in the liquid phase
The dissolved CO2 mass in the liquid phase of the unsaturated peat layer was calculated on the basis of Henry's law for evaluating the residence time of CO2 in a peat soil layer. The equilibrium between dissolved CO2 and gaseous CO2 was assumed to be linear:
where CICO[M L−3] is the dissolved CO2 concentration in the soil liquid phase, β[L3 L−3] is the solubility coefficient (CitationThe Chemical Society of Japan 1984) determined at each depth based on the measured soil temperature, and Cgco2[M L−3] is the measured CO2 concentration in the soil air phase. The dissolved CO2 mass per unit bulk soil volume, θCICO 2[M L−3], was then evaluated at every 10 cm depth, where θ[L3 L−3] is the volumetric water content. The gaseous CO2 mass per unit bulk soil volume aCgco2 [M L−3] was also derived, where a [L3 L−3] is an air-filled porosity. Therefore, the total CO2 mass per unit bulk soil volume is the summation of θCICO2 and aCgco2 The values θ and a were derived from soil water characteristic curves (CitationIiyama and Hasegawa 2005) based on the assumption that soil water at any gas sampling depth is at equilibrium with the groundwater.
Mass balance equation for a soil gas
The mass balance concept was applied to the evaluation of the rates of CO2 production and O2 consumption. As diffusion is regarded as the major mechanism of soil gas transportation, the upward gas flux q [M L−2 T−1] can be expressed as
where C is the gas concentration [M L−3], z is a vertical axis with upward positive [L] and D s is the soil gas diffusion coefficient [L−2 T−1]. A relative gas diffusivity, D s /D 0, as a function of air-filled porosity, a, was modeled with a third-order polynomial for every soil layer between any successive two gas sampling depths. A polynomial model was fitted to the measured D s /D 0 data (CitationIiyama and Hasegawa 2005) at the corresponding layer. In the range of a near the saturated condition, where the measured D s /D 0 became 0, a constant zero value was assigned to the model. The gas diffusion coefficients in the atmosphere D 0[L2 T−1] for both CO2 and O2 were calculated from temperature-dependent equations (CitationFreijer and Leffelaar 1996; CitationOsozawa and Hasegawa 1995; CitationTang et al. 2003) with coefficients depending on the gas species (CitationMakita 1988), for example, D 0 = 0.138 (T/273)1.75[cm2 s−1] for CO2 and D 0 = 0.178 (T/273)1.75[cm2 s−1] for O2, where T[K] is the absolute temperature.
To apply the mass balance equation to the CO2 and O2 data obtained from the various monitoring depths, the peat layer was separated into layers with a thickness of 10 cm; the boundaries of these layers were at the soil gas sampling depths (zi , i = 0, 1, 2, . . . ). First, EquationEq. 2 can be spatially discretized as follows:
where flux qi and soil gas diffusion coefficient D si were defined between zi and zi +1, and Ci denotes the gas concentration at zi . And the temporally and spatially discrete form of the mass balance equation at zi can be written as
where t is time [T], ai and Si are air-filled porosity [L3 L−3] and gas production rate [M L−3 T−1], respectively. The flux qi was averaged between time t and t + Δt, and denoted with a bar at the top of the symbol. The time increment Δt used in the calculations for both CO2 and O2 corresponded to the interval of CO2 gas sampling so that the source term Si for O2 could directly be compared with that for CO2.
The source term Si was determined using EquationEq. 4. As the layer below 30 cm could not provide a sufficient amount of gas concentration data because the groundwater table rose several times, the calculation focused on the layer above a depth of 30 cm, and only the S at a depth of 20 cm was derived. As liquid-phase diffusion coefficients of the two gases are in the order of 1/10 000 of that in the gaseous phase (CitationMakita 1988), liquid phase diffusion was excluded from the analyses.
RESULTS AND DISCUSSION
Seasonal trends in the imbalance between CO2 abundance and O2 deficit
shows the seasonal variations in the groundwater table level associated with the daily precipitation (), the seasonal trends of gaseous CO2 concentration at the three sampling sites (), the changes in gaseous O2 concentration at depths from 5 to 30 cm (), the annual trends in mean daily temperatures at depths from 2 to 50 cm (), and air-filled porosity at every 10 cm depth determined from soil water retention curves (CitationIiyama and Hasegawa 2005) (). When a CO2 gas sampling tube was waterlogged, soil gas data was unavailable and, therefore, was excluded from the graphs. The dots on the curves in indicate the O2 concentration datasets recorded at the same time as the CO2 sampling, which were used for the direct comparisons with the CO2 datasets.
Figure 3 Seasonal changes in (a) groundwater table level with daily precipitation, (b) CO2 volume concentrations at the three sites, (c) O2 volume concentrations, (d) soil temperatures and (e) air-filled porosity.
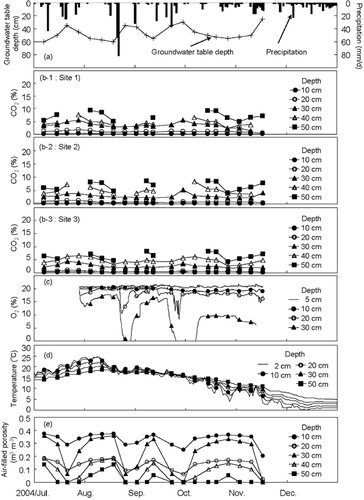
The CO2 abundance from the atmospheric level did not appear to exceed the O2 deficit at any depth. At a depth of 30 cm, the CO2 abundance at any of the three sites had rarely been larger than the O2 deficit for the entire study period (). Similar trends were found at depths of 10 and 20 cm. To quantify the imbalance in the gas concentrations, time-averaged values of the two gases were compared for the study period. At a depth of 10 cm, the CO2 concentration values were 0.16, 0.24 and 0.22% for the three sites (average = 0.21%), whereas the averaged value of the dotted dataset on the O2 curve was 19.71%. At a depth of 20 cm, the CO2 concentration values increased to 0.92, 0.77 and 0.56% (average = 0.75%), whereas the O2 concentration decreased to 18.05%. At a depth of 30 cm, the CO2 concentration values increased to 3.30, 2.91 and 2.55% (average = 2.92%), whereas the O2 concentration dropped to 9.51%.
The CO2 concentrations changed less sensitively with smaller amplitudes than the O2 concentrations in response to groundwater table fluctuation. For example, after rainfall of over 80 mm day−1 in the middle of August, and after a series of rainfall events in the middle of September, the rise in CO2 concentration at 20 and 30 cm depths was less marked at all three sites than the drop in O2 concentration at corresponding depths. The O2 dataset had standard deviations of 0.54, 1.65 and 5.65% at 10, 20 and 30 cm depths, respectively, whereas the maximum standard deviations of CO2 concentration at the three sites were 0.12, 0.41 and 1.49% at the corresponding depths. The single dataset of O2 concentrations makes it difficult to estimate how general the large temporal variability obtained in the present study is. However, means and standard deviations of O2 concentration similar to the values recorded in the present study were observed in CitationMagnusson (1994). CitationMagnusson (1994) monitored soil gaseous O2 in forested peatlands for 3 years using a similar gas sampling protocol with regard to the spatial and temporal sampling as that used in the present study.
The difference in CO2 concentration among the three sites might be explained by the distance of each site from the western ditch. Site no. 3, which showed the smallest CO2 concentration, was located 1 m closer to the ditch than the other two sites. Several past studies that have examined the effects of distance from a drainage ditch on peat soil decomposition have suggested that within the first 10 m from a drainage ditch, in particular, more accelerated decomposition is observed when the sampling points are closer to the ditch (CitationPrevost et al. 1997, Citation1999). As the groundwater table declined steeply toward the ditch, site no. 3 might have become unsaturated more frequently than the other two sites. And, in turn, easily available fractions of soil organic matter might have decomposed more in the peat layer closer to the ditch, resulting in soil air more diluted in CO2. This explanation is unsubstantiated at present and, therefore, the difference in the groundwater table level among the three sites was assumed to be negligible in the following analyses.
In summation, CO2 abundance at all three sites clearly fell below the O2 deficit, although a single O2 deficit dataset is not sufficient to clarify the generality of this result. And the smaller amplitudes and more moderate responses in CO2 concentrations than in O2 concentration were the features in common, despite the variance in CO2 concentrations among the three sites. These findings were believed to result from the solubility of CO2, which is 25–35-fold greater than that of O2 in ambient temperatures ranging between 0 and 30°C under atmospheric pressure. And it is possible that under certain production (or consumption) rates of the two gases, the higher water content would increase the apparent imbalance between the two gases, regardless of whether or not the groundwater table fluctuated.
Dissolved CO2 mass in the liquid phase
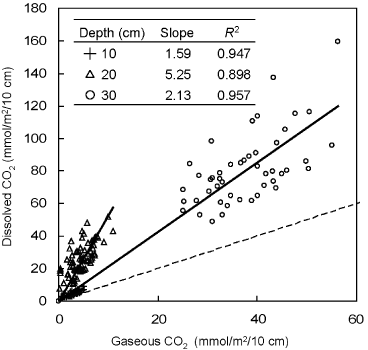
shows the dissolved CO2 mass (θCico2 ) plotted against the gaseous CO2 mass (aC gco2 ) at each depth. A dissolved mass value represents an area of one horizontal square meter with every 10 cm thickness around each gas sampling depth (mmol m−2 [10 cm]−1). The targeted depths were 10, 20 and 30 cm because these layers had never been below the groundwater table for most of the study period.
The dissolved CO2 mass increased with depth. The values ranged from 1.72 to 9.45, from 7.67 to 51.79 and from 49.04 to 159.3 mmol m−2 (10 cm)−1 at depths of 10, 20 and 30 cm, respectively. The slopes of the linear regression curves were 1.59, 5.25 and 2.13 for depths of 10, 20 and 30 cm, respectively, indicating that the soil liquid phase in these layers could contain more CO2 than the gaseous phase. The steepest slope of the three depths was observed at 20 cm as a result of the higher volumetric water content at this depth. According to the soil water characteristic curves of the sites, the volumetric water content of this layer remained higher than 0.727 and reached a maximum value of 0.889 during the study period. also showed a lower air-filled porosity at a depth of 20 cm compared with the two neighboring layers. These estimations suggested that the large water content of peat soils can tentatively store the produced CO2 and hinder immediate CO2 release into the gaseous phase.
Figure 4 Gaseous CO2 mass versus dissolved CO2 mass for every 10 cm thickness. The dotted line denotes a 1:1 relationship between the two variables.
Mass balance analyses of CO2 and O2
shows the seasonal trends in CO2 production rate, S(CO2), and O2 consumption rate, |S(O2)|, and a negative “S” value indicates “consumption” at a depth of 20 cm derived from the mass balance equation (EquationEq. 4) for the two gases. The gaseous and dissolved CO2 masses at this depth were also plotted to evaluate the residence time of the produced CO2 in the layer as the ratio of the CO2 mass to either S(CO2) or |S(O2)|.
As expected from the CO2 production rates in the gaseous phase at a depth of 20 cm at the three sites were below the O2 consumption rate in this layer for most of the study period, although the CO2 production rates differed among the three sites. The time-averaged values of S(CO2) for the three sites were 23.11(6.85), 9.93(5.20) and 6.52(2.67) mmol m−2 (10 cm)−1 day−1, whereas the time-averaged |S(O2)| value was 37.01(17.49) mmol m−2 (10 cm)−1 day−1 (the values in parentheses are the standard deviations and n = 14 for S(CO2) and n = 13 for |S(CO2)|).
Figure 5 CO2 production rates at a depth of 20 cm at the three sites (▵)compared with the O2 consumption rate (+) and the amounts of CO2 mass in both gaseous (○) and liquid phases (•).
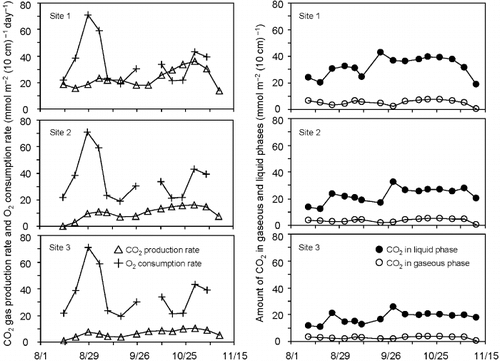
Table 1 Time-averaged indices for evaluating the contribution of CO2 production rate, S(CO2), to CO2– O2 turnover at a depth of approximately 20 cm at the study sites
The differences in S(CO2) among the three sites indicated that the site located closer to the ditch might have a smaller CO2 production rate. As these S(CO2) values were derived from the CO2 concentration data, the difference in S(CO2) should be given the same interpretation as that of CO2 abundance. The time-averaged values of |a∂C/∂t| at a depth of 20 cm at the three sites amounted to less than 2% of any of the other two terms in EquationEq. 4 at every measurement interval. Therefore, it was suggested that the gas concentrations at a depth of 20 cm had changed so moderately that the application of EquationEq. 4 to this layer could be regarded as a quasi-steady state problem.
summarizes the time-series data shown on that was used to evaluate the degree of contribution of S(CO2) to both |S(O2)| and the upward CO2 flux defined in the layer between the 10 and 20 cm depths, q(CO2)out. The time-averaged values of S(CO2)/|S(O2)| for the entire monitoring period were 0.781, 0.311 and 0.199 for sites 1, 2 and 3, respectively, indicating that the gaseous CO2 production could explain 43%, on average, of the O2 consumption in the air phase. As the gaseous CO2 might be produced not only through aerobic microbial activities, but also through anaerobic activities, it was suggested that the CO2 corresponding to the remaining 57% could have dissolved into the liquid phase.
The second column of describes the time-averaged values of S(CO2)/q(CO2)out for the study period. The values for the three sites were 0.078, 0.061 and 0.057, respectively, indicating that S(CO2) accounted for less than 10% of the gaseous CO2 produced in the whole peat layer below a depth of 20 cm. Therefore, it was suggested that a large CO2 source exists in the deep layers. However, the maximum thickness of the unsaturated zone below a depth of 20 cm was 40 cm during the study period, which appears to be insufficient to become a CO2 source ninefold greater than the 10 cm thickness layer around the 20 cm depth.
One possible CO2 source in the layer below the 30 cm depth might be the anaerobic decomposition of peat soils. Several laboratory incubation tests have suggested that anaerobic CO2 production can certainly provide a source of CO2 in a submerged soil profile, although anaerobic decomposition appears to be consistently slower than aerobic decomposition. For instance, CitationDeBusk and Reddy (1998), CitationWaddington et al. (2001) and CitationGlatzel et al. (2004) observed that anaerobic C mineralization rates were approximately one-third of the aerobic mineralization rates. Nevertheless, as the CO2 data in the layers below 30 cm had been strongly affected by groundwater table fluctuations (), it is difficult to discuss whether a large CO2 source is located in the layer below the 30 cm depth or not.
The third column in includes the residence time (t 1), which symbolizes the time-averaged CO2 turnover in the gaseous phase, derived from aC gco2 divided by S(CO2). The values of t 1 for the observation period were 0.237, 0.390 and 0.436 day for the three sites (average = 0.351 day). The fourth column contains the time-averaged values of the residence time (t 2), which denotes the CO2 turnover in the whole soil matrix and is derived from aC gco2 + θgco2 divided by |S(O2)|. The values of t 2 were 1.260, 0.844 and 0.655 day for the three sites (average = 0.919 day). A comparison of t 1 and t 2 suggested that even if all of the consumed O2 was transformed into CO2, it would take 2.6-fold longer for the produced CO2 to discharge than expected from the CO2 balance in the gaseous phase alone, implying that high water content served as a tentative storage for the CO2 produced in the gaseous phase of the peat layers.
Conclusions
Seasonal changes in in situ gaseous CO2 profiles were examined with complementary monitoring of an O2 gas profile in an unsaturated peat layer in Bibai mire, Hokkaido, Japan.
The CO2 abundance to the atmospheric level did not exceed the O2 deficit. The CO2 concentrations were 0.21, 0.75 and 2.92%, whereas the O2 concentrations were 19.71, 18.05 and 9.51% at depths of 10, 20 and 30 cm, respectively. The CO2 concentrations were less sensitive to groundwater table fluctuation than the O2 concentrations. The dissolved CO2 mass based on Henry's law ranged from 1.72 to 159.3 mmol m−2 (10 cm)−1, and was 1.59–5.25-fold greater than the gaseous CO2 mass. These results suggested that the liquid phase can make the gaseous CO2 abundance more stable and less intense than the O2 deficit in the peat soil layers.
The mass balance analyses showed that the CO2 production rate in the gaseous phase ranged from 6.52 to 23.11 mmol m−2 (10 cm)−1 day−1, accounting for 43% of the O2 consumption rate at a depth of 20 cm. And this CO2 production rate explained less than 10% of the gaseous CO2 produced in the whole unsaturated peat layer with a maximum thickness of 40 cm, implying the existence of a large CO2 source in the peat layer that included the saturated zone.
The residence time of CO2 in the gaseous phase alone was evaluated to be 0.351 day, whereas the residence time in the whole peat soil matrix was 0.919 day at a depth of approximately 20 cm, suggesting that high water content serves as a tentative storage for CO2 in peatlands.
The present study results showed that the dissolved fraction of CO2 can contribute substantially to the total CO2 turnover in the drained peatland, and that concurrent monitoring of O2 with CO2 can cross-check the aerobic microbial activities. For a more precise outline of soil degradation in the drained peat layers, further studies are needed to focus more specifically on the types and fates of dissolved carbon.
ACKNOWLEDGMENTS
We wish to thank Dr Osamu Nagata and the staff at the Bibai Research Station of the National Agricultural Research Center for Hokkaido Region for management of the study field. I. Iiyama was supported by “Research Fellowships of the Japan Society for the Promotion of Science for Young Scientists”.
Related Research Data
REFERENCES
- Best , EPH and Jacobs , FHH . 1997 . The influence of raised water table levels on carbon dioxide and methane production in ditch-dissected peat grasslands in the Netherlands . Ecol. Eng , 8 : 129 – 144 .
- Chapman , SJ and Thurlow , M . 1996 . The influence of climate on CO2and CH4emissions from organic soils . Agric. For. Meteorol , 79 : 205 – 217 .
- Chapman , SJ and Thurlow , M . 1998 . Peat respiration at low temperature . Soil Biol. Biochem , 30 : 1013 – 1021 .
- DeBusk , WF and Reddy , KR . 1998 . Turnover of detrital organic carbon in a nutrient-impacted Everglades marsh . Soil Sci. Soc. Am. J , 62 : 1460 – 1468 .
- Freijer , JI and Leffelaar , PA . 1996 . Adapted Fick's law applied to soil respiration . Water Resour. Res , 32 : 791 – 800 .
- Glatzel , S , Basiliko , N and Moore , T . 2004 . Carbon dioxide and methane production potentials of peats from natural, harvested, and restored sites, eastern Quebec, Canada . Wetlands , 24 : 261 – 267 .
- Glatzel , S , Lemke , S and Gerold , G . 2006 . Short-term effects of an exceptionally hot and dry summer on decomposition of surface peat in a restored temperate bog . Eur. J Soil Biol , 42 ( 4 ) : 219 – 229 .
- Gorham , E . 1991 . Northern peatlands: Role in the carbon cycle and probable responses to climatic warming . Ecol. Appl , 1 : 182 – 195 .
- Haraguchi , A , Hasegawa , C , Hirayama , A and Kojima , H . 2003 . Decomposition activity of peat soils in geogenous mires in Sasakami, central Japan . Eur. J Soil Biol , 39 : 191 – 196 .
- Huttunen , JT , Väisänen , TS Heikkinen , M . 2002 . Exchange of CO2 CH4and N2O between the atmosphere and two northern boreal ponds with catchments dominated by peatlands or forests . Plant Soil , 242 : 137 – 146 .
- Iiyama , I and Hasegawa , S . 2005 . Gas diffusion coefficient of undisturbed peat soils . Soil Sci. Plant Nutr , 51 : 431 – 435 .
- Ikkonen , EN , Kurets , VK , Grabovik , SI and Drozdov , SN . 2001 . The rate of carbon dioxide emission into the atmosphere from a southern Karelian mesooligotrophic bog . Russ. J. Ecol , 32 : 382 – 385 .
- Ito , S , Komada , M , Kimiwada , K and Awasaki , H . 2001 . Experiment of restoring high-moor plant community based on ground water environment of peatland . Res. Bull. Hokkaido Natl Agric. Exp. Stn , 173 : 1 – 36 . (in Japanese)
- Langeveld , CA , Segers , R , Dirks , BOM , van den Pol-van Dasselaar , A , Velthof , GL and Hensen , A . 1997 . Emissions of CO2 CH4and N2O from pasture on drained peat soils in the Netherlands . Eur. J. Agron , 7 : 35 – 42 .
- Magnusson , T . 1994 . Studies of the soil atmosphere and related physical characteristics in peat forest soils . For. Ecol. Manag , 67 : 203 – 224 .
- Makita , T . 1988 . “ Diffusion coefficient in gaseous phase ” . In Kagakukougaku-Binran , Edited by: The Society of Chemical Engineers . 100 – 104 . Tokyo, , Japan : Maruzen . (in Japanese)
- Maljanen , M , Martikainen , PJ , Walden , J and Silvola , J . 2001 . CO2exchange in an organic field growing barley or grass in eastern Finland . Global Change Biol , 7 : 679 – 692 .
- Oechel , WC , Hastings , SJ , Vourlitis , G , Jenkins , M , Riechers , G and Grulke , N . 1993 . Recent change of Arctic tundra ecosystems from a net carbon dioxide sink to a source . Nature , 361 : 520 – 523 .
- Osozawa , S and Hasegawa , S . 1995 . Diel and seasonal changes in carbon dioxide concentration and flux in an andisol . Soil Sci , 160 : 117 – 124 .
- Prevost , M , Belleau , P and Plamondon , AP . 1997 . Substrate conditions in a treed peatland: responses to drainage . Ecoscience , 4 : 543 – 554 .
- Prevost , M , Plamondon , AP and Belleau , P . 1999 . Effects of drainage of a forested peatland on water quality and quantity . J Hydrol , 214 : 130 – 143 .
- Tackett , JL . 1968 . Theory and application of gas chromatography in soil aeration research . Soil Sci. Soc. Am. Proc , 32 : 346 – 350 .
- Tang , JW , Baldocchi , DD , Qi , Y and Xu , LK . 2003 . Assessing soil CO2efflux using continuous measurements of CO2profiles in soils with small solid-state sensors . Agric. For. Meteorol , 118 : 207 – 220 .
- The Chemical Society of Japan . 1984 . “ Solubility ” . In Kagaku-Binran , Edited by: The Chemical Society of Japan . 11 – 158 . Tokyo : Maruzen . (in Japanese)
- Waddington , JM , Rotenberg , PA and Warren , FJ . 2001 . Peat CO2production in a natural and cutover peatland: implications for restoration . Biogeochemistry , 54 : 115 – 130 .
- Worrall , F and Burt , T . 2005 . Reconstructing long-term records of dissolved CO2 . Hydrol. Proc , 19 : 1791 – 1806 .
- Worrall , F , Burt , T and Adamson , J . 2005 . Fluxes of dissolved carbon dioxide and inorganic carbon from an upland peat catchment: implications for soil respiration . Biogeochemistry , 73 : 515 – 539 .