Abstract
This article reports on an analysis of assessment items in a Level 1 Earth Science and Climatology module at Liverpool John Moores University (LJMU). It examines the effect of increasing the diversity of assessment methods in the module and increasing the number of summative assessment items from 4 to 8.
The effect of doubling the number of assessment items on student performance is examined. Regression analysis highlights differences in how well the marks in the 8 assessment items predict the students’ final module total. The analysis highlights how students ranked overall in the top quartile performed better in the so called ‘deep learning’ assessments (field reports, weather analysis and use of a wiki) whereas students in the lowest quartile performed better in so called ‘shallow learning’ assessments (on-line multiple choice test and the formal written examination). Individual student’s ‘assessment profiles’ are examined and strengths (high class ranking) compared with weaknesses (low class ranking). The reasons for the differences are explored and discussed in the light of students’ motivations, recently introduced ‘graduate skills mapping’ in the University and research by assessment experts.
Introduction
What influences students’ learning most is not the teaching but the assessment (e.g. CitationMiller and Parlett, 1974). Students have been described as ‘strategic learners’ who are assessment-led or ‘assessment-driven’. Increased pressure on students’ time may be one reason why students become assessment-focused (CitationGibbs, 1992, p101). Traditionally, assessment primarily measures students’ performance (summative assessment) but more recently the notion of formative assessment has been raised as an important aspect of learning in Higher Education (HE) (CitationGibbs, 1999) and as a factor in student retention (CitationYorke, 2001).
The Assessment in Geography guide states:
“Few of us will have been systematically introduced to assessment issues when we began lecturing. It is something we have grown into and accepted, perhaps ‘caught’ rather than ‘learned’ and, for some of us, experimented with”.
This article reports on just such ‘experimentation’ within the Level 1 module ECLOE1201 at LJMU. The UK Government’s widening participation (WP) in HE policy is generating larger numbers of students with wider ranges of backgrounds, qualifications, experiences and diversity of learning needs in class. One strategy employed in a workload allocation model at LJMU to address WP, issues of transition into HE, and retention of Level 1 students, has been that of ‘front loading’ teaching. This involves allocating more teaching hours at Level 1. Typically 10% more teaching/contact hours are allocated to Level 1 modules.
The ‘experimentation’ with assessment reported here resulted from a desire:
to structure the ‘non-contact’ or ‘independent study’ hours of Level 1 students more effectively, so that they embraced University-appropriate learning styles as effectively as possible and as early as possible,
to encourage Level 1 students to embrace new learning technologies available through the University’s Blackboard Virtual Learning Environment (VLE).
The context
The Level 1 Earth Sciences and Climatology module is a semester-long (15-week), 24 credit (double) module. A full time student at LJMU studies 120 credits per year, or 1200 hours. It is a core module in the BA/BSc (Hons) Outdoor Education programme. It has been delivered by the author (with assistance from another colleague for the 1.5 days of fieldwork) since mid-1990s. Twenty topics are addressed (eg. plate tectonics, rocks and minerals, weather systems, micro-climatology etc) through 35 hours class-based and 10 hours of field trip contact time in the 240 hours allocation. Assuming students attend all 45 teaching hours, this leaves 195 independent study hours. It was the author’s desire to help students to structure and use these 195 independent study hours more effectively through changing the assessment pattern. This action-learning research evaluates this curriculum intervention through:
assessing the effect of increasing the assessment diversity on students’ performance.
examining whether certain groups of students perform better in certain types of assessment.
reflecting on these changes to inform future planning.
Table 1 Module Assessment schedule before (2002–07) and after (2008–09) changes.
The ‘experiment’
From 2003 to 2009 the number of students enrolled on the module increased from 29 to 52, and the author’s perception was that the diversity of learning needs increased with the number of students. A new assessment schedule was developed and introduced in 2008. The assessment tasks before and after the changes are summarised in . The new schedule was designed to break the assessment tasks into smaller ‘chunks’ with more deadlines spread across the module. The rationale behind this was to encourage students to spread their workload, rather than leaving much of the work until the ‘last minute’ at the end of the module, as seemed to be the case for many students in the pre-2007 schedule. The new assessment schedule introduced new e-technologies: the paper version of the multiple choice questions (MCQ) covering all module topics, as part of the written 3-hr examination, was removed and introduced as an on-line test earlier in the module (CitationSly, 1999; Stott & Meers, 2002; Stott et al., 2004; Stott, 2006). This test was supported by formative assessment in the form of 17 on-line revision quizzes, one for each topic, which students could attempt as many times as they liked. Blackboard gave the students feedback on each question, and some of the questions, students were assured, would appear in the summative on-line test in week 8, worth 15% of the module weighting. A further innovation was the use of Blackboard wikis. A short wiki training session was delivered early in the module. Students were tasked with entering information, which they had researched, into the module wiki so that their research could be shared with all students on the module.
Marks awarded for all assessment items, along with attendance data, were available from 2003–2009.
Results and discussion
Influence of each assessment on the overall module total (Aim 1)
In order to examine the influence of each individual assessment item on the overall module total, the marks in each individual assessment were plotted against the overall module total (example in ) and linear regression relationships fitted. Since the weighting of individual assessment items ranged from 5–15%, a scatter plot for class mean of weighted assessment items vs. unweighted assessment items was produced to test whether the weighting assigned to an assessment item itself influenced the module total (). Since there is a statistically significant relationship in it is unlikely that the weighting of the individual assessment item is the main influence on the module total, but rather the nature of the assessment task itself (i.e students’ marks in assessment items are not driven by the weighting assigned). This may not be the case where the difference between weightings is larger.
Figure 1 Scatter plot of % scored in one item of assessment (in this case the Blackboard on-line test worth 15% of the module weighting) vs. overall module total (%).
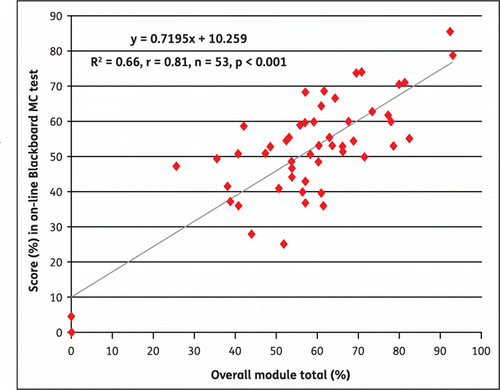
Figure 2 Scatter plot showing class mean for weighted assessment items vs.unweighted assessment items.
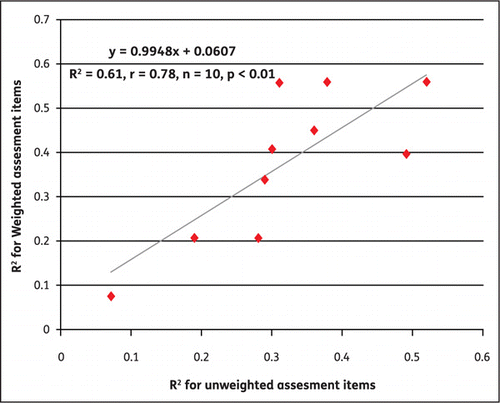
Table 2 Pearson correlation coefficients for individual assessments items vs. module total (2003–09).
Having established regression relationships (R2 values) for each assessment item for each year of the study, the correlation coefficients (r) are presented in (shaded according to their statistical significance levels). Note that the written examination items have been presented as sections (MCQ, short answers, essays) independently, as well as the combined exam score. Most, but not all, items are significant at the p < 0.05 level, with four significant at the p < 0.01 level.
In general, the examination assessment items (MCQ/on-line tests, short answer and essays in written exams) tend to have a greater influence on the final module total than the coursework items. The first assessment to be submitted in week 4, the rocks and mineral teaching resource (1000 word coursework submitted either as a Powerpoint Presentation, leaflet or web site) is only a statistically significant influence on the final module total in 2005. University guidance states that feedback must be given on all assessments within four weeks (though in this case it is normally within two weeks of submission) so it seems that students use this feedback to perform better in the second assessment task (the weather report) which has a statistically significant influence on the final module totals in 2004, 2007 and 2009. In the examination assessments, the short answer question section of the written examination is the only form of assessment which has a statistically significant influence on the final module total in every year. This is interesting, and may well reflect the fact that students are more used to this type of assessment through GCSE and A-level examinations than any other, so it is a good predictor of the final module total. The MCQ item (paper-based, then changed to on-line) has a statistically significant influence on the final module total in four of the seven years, whereas the exam essay questions are only statistically significant in two of the seven years. This suggests that examination written essays are not a good predictor of the final module total in most years. This may be because students are either not used to this skill, it is not practised enough, or, since the essays are normally tackled at the end of the written exam, students are fatigued, or feel they have scored enough marks in other parts of the module to have passed. The field report has a statistically significant influence on the final module in five of the seven years.
Of the new assessment tasks introduced in 2008 (and retained in 2009), the wiki tasks did not have a statistically significant influence on the final module total, but the practical worksheets did. The worksheets are collected at lectures by the students and completed partially during teaching sessions and finished as independent study. All are submitted at the end of the module. This task certainly seemed to have been taken seriously by students in 2008 and 2009, whereas the wiki tasks were not. This may have been because wikis were new or perhaps the training or the purpose of the tasks were not communicated well enough. The use of wikis (and blogs) as learning and teaching methods is growing rapidly, and more innovative ways of engaging students with these technologies is being considered.
This analysis offers one way in which HE teachers can monitor the influence of their assessment tasks on the final module total.
How does the performance of different groups of students vary with different assessment tasks? (Aim 2)
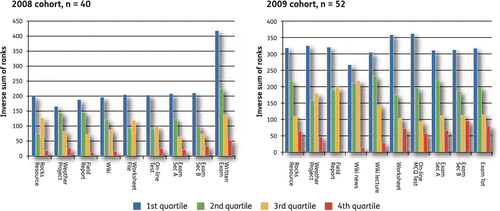
In order to answer this question, students’ ranking in assessment items was compared to their final module total ranking. Students in the 2008 and 2009 cohorts were ranked (highest to lowest) according to their final module total (the aggregate score in all eight assessments). Their scores in each individual assessment item were ranked and the difference between their rank in that task and their final module ranking was calculated (). This gave an indication of whether an individual, or group of students, did better than (over-performed), as well as, or worse (under-performed) in that task than compared to the module overall.
The students were then grouped into four quartiles (based on overall module ranking) and a measure of that quartile’s performance in each assessment was calculated (called the Inverse Sum of Ranks by adding up the ranks for the group then making the value positive by adding the lowest value to them all). These are plotted in and generally show the expected trend: that the rankings show 1st quartile > 2nd quartile > 3rd quartile > 4th quartile. Indeed, in all assessment items in both years the 1st quartile always out-performs the other three groups in all assessment items. Conversely, the 4th quartile always performs worse than the other three quartiles. However, there are exceptions to this predictable pattern. In 2008, the 3rd quartile group out-performs the 2nd quartile in the Rocks Resource assignment, practical worksheets and on-line test. In 2009, however, the pattern is not repeated but instead the 3rd quartile group again out-performs the 2nd quartile, this time in the weather analysis project, the field report and one of the wiki tasks. At the time of writing, no obvious explanation for these differences is readily forthcoming and further investigation will be required. However, these findings do seem to indicate that different assessment tasks may favour different groups of students within a cohort, which is not entirely surprising given the diversity of learning styles (CitationKolb, 1984) typical in a cohort of 40–50 students. Unfortunately, in this short study the particular tasks varied from one year to the next.
Table 3 Ranking of students’ performance in different assessment items, and calculation of the difference between each assessment item and their overall module total ranking.
Figure 3 Rankings in different assessment items analysed by student quartiles for 2008 and 2009 module cohorts.
Reflections on the findings and looking forward (Aim 3)
Reflecting on these findings answers some questions but inevitably raises more. While the correlations between students’ marks on single assessment tasks vs. their final module mean may be a way for HE teachers to assess the usefulness of a particular assessment item in contributing to the final module mark, it is clearly not an exact science. The correlation coefficients vary from year to year but it is possible to see that some types of assessment are better predictors of the final module mark than others. The effect of adding new tasks was, as expected, a partial ‘dilution’ of the influence of the existing forms of assessment, as weightings of former items are reduced to make space for the new items. Recent research (CitationGibbs, 2009) suggests that HE teachers should be making more use of formative assessment strategies throughout a module (or whole degree) with fewer summative assessment tasks, mainly coming at the end of the degree programme. Our experience at LJMU tends to show that unless a task carries some form of assessment weighting, students tend not to take it seriously or even avoid it altogether. However, in this study, even by providing lots of smaller assessment tasks with deadlines spaced throughout the module, with feedback on the earlier items available before the later tasks are assessed, the 4th quartile of students still show low engagement and poor attendance in general.
Perhaps there is a need to change students’ expectations right from the start. A great deal rests with the University Assessment Regulations where, at LJMU, the Level 1, 2 and 3 weightings towards final degree classification are 0, 25%, 75%. Should we be moving to 20%, 30%, 50% (to encourage students to take Level 1 more seriously, or perhaps, as CitationGibbs (2009) suggests, 0%, 0%, 100% but with lots of formative assessment and feedback in Levels 1 and 2 so that by Level 3 students are performing at their ‘peak’?
End of module fade can also be a problem for some students. Some students start off eager to make a good impression and with great intentions of completing all the tasks to the best of their ability. Later in the module their motivation fades. This may be for personal issues, poor time management or feedback on earlier assessment tasks which tells them they are doing well enough to pass. They slacken off their effort later in the module, or do not submit some smaller/later tasks at all, because they know they have done enough to pass (all that is required at Level 1). Some HE teachers have either insisted that all tasks must be at least submitted otherwise none of the tasks will be counted (or marked), but this could still mean poor effort is made in some smaller weighted tasks. Is a task weighted 5 – 10% worth doing? Is it enough to motivate students into doing their best work? The answer is ‘probably not’, but students may still be learning important new skills (such as using the module wiki) by attempting the task and engaging with the problem. In well-designed programmes, the new skills they learn at Level 1 are laying the foundation for success at Levels 2 and 3, enabling students to be better placed to succeed. Perhaps the order in which the tasks are presented is crucial. One strategy may be to present low weighted smaller tasks early in the module (5–10%), with higher weighted (25–50%) ones towards the end.
Another strategy used by HE teachers to ensure high submission rates is to ‘sample mark’. Here, for example, six tasks are set, but the assessor states that only one will be marked, but they do not say which one it is until all six tasks are submitted. This clearly reduces the marking load and should ensure that all students complete all the tasks, but this may lead to ill-feeling among students who have only had feedback on one-sixth of their work.
Separating classes into groups (in this example quartiles) does seem to reveal unexpected differences in performance in some assessment tasks. In several tasks in both years the 3rd quartile performed better than the 2nd. However, the 4th quartile never performed better than the 3rd, although in some assessment tasks the gap was narrowed. For some reason, certain groups of students (in this case the 3rd quartile) sometimes perform better than expected. This may be because the task better matched their learning style or they were more motivated towards some tasks than others. The division of the cohort into quartiles in this example is clearly arbitrary, but this technique could be used to draw out individual student’s strengths (where their assessment task ranking is better than their overall module ranking) so that HE teachers can see strengths and weaknesses of individuals and groups of students. This information could be useful in designing future assessment strategies at Level 2 and 3. Some HE teachers have argued for giving students more choice in the way they are assessed, particularly at Level 2 and 3, so that they can maximise their performances and/or address their weaknesses. This is not really novel, school teachers routinely differentiate their classes, and many tailor Individual Education Plans for their pupils.
Conclusions
Where module assessments consist of several discrete marks which are aggregated to give a final module total, linear regression relationships between marks scored in individual assessment items and the final module total seem to offer a way in which HE teachers can gauge the influence of certain assessment tasks on the final module total. Analysis over seven cohorts (years) of students shows that the influence varies from year to year. When extra (new) assessment items are added, a pattern emerges where some assessment tasks turn out to consistently influence the final module total, while others are less consistent in their influence.
The introduction of new assessment tasks, including a module wiki task and a weekly practical worksheet, showed that students’ marks in the wiki tasks had no statistically significant influence on the module total whereas the weekly practical worksheet did.
An analysis of students’ rankings in eight assessment items for two cohorts showed that in most cases the expected pattern held. However, in 2008 the 3rd quartile group out performed the 2nd quartile in the Rocks Resource assignment, practical worksheets and on-line test. In 2009, however, the pattern was not repeated: instead the 3rd quartile group out-performed the 2nd quartile, but this time in the weather analysis project, the field report and one of the wiki tasks.
Further research
This study is a preliminary one, with some experimentation and a sample of techniques which HE teachers might consider using to find out more about students’ response to the assessment tasks designed to help their learning. One avenue this study has not explored is special learning needs. In any one year, up to 10% of the cohort studying this module will have varying degrees of dyslexia affecting reading speed, writing, letter/word recognition, sequencing, planning and the time needed to complete assignments. Typically, these students are awarded 25% extra time in written examinations and sometimes, depending on the severity of the condition, extra tutor support. Researching the suitability of different styles of assessment for these students is one avenue for further investigation.
References
- BradfordM. and O’ConnellC. 1998 Assessment in Geography, Geography Discipline Network, Cheltenham
- GibbsG. 1992 Assessing More Students, Oxford Centre for Staff Development, Oxford
- GibbsG. 1999 Using assessment strategically to change the way students learn. In BrownS. and GlasnerA. (Eds.) Assessment Matters in Higher Education, SRHE, Open University Press, Buckingham
- GibbsG. 2009 Designing assessment for entire degree programmes, Designs for Assessment Conference, Leeds Metropolitan University http://flap.teams.leedsmet.ac.uk/conference-23rd-june-2009 Accessed 1 July 2010
- KolbD.A. 1984 Experiential learning, Prentice-Hall, Englewood Cliffs, New Jersey
- MillerC.M.I. and ParlettM. 1974 Up to the mark: A study of the examination game, Society for Research into Higher Education, Guildford
- SlyL. 1999 Practice tests as formative assessment improve student performance on computer managed learning assessments, Assessment and Evaluation in Higher Education, 24, 3, 339-344
- StottT.A. and MeersP.M. 2002 Using BlackBoard VLE to Support Referral Students at JMU, LJMU Internal Report to Learning Development Unit, Liverpool
- StottT.A., BoormanA. and HardyD.P. 2004 Developing Mountain Navigation Skills in Outdoor Education: Part 1, An Evaluation of Questionmark Perception, LJMU Learning & Teaching Press, 4, 1, 17-19
- StottT.A. 2006 Evaluation of the Use of Supporting Diagrams and Video Clips in Blackboard’s on-line assessment tests. Poster presented at 1st Pedagogical Research in Higher Education conference, Pedagogical Research: enhancing student success, Liverpool Hope University
- YorkeM. 2001 Formative assessment and its relevance to retention, Higher Education Research and Development, 20, 2, 115-126.