
Abstract
Liver-specific Nrf1 (NF-E2-p45-related factor 1) knockout mice develop nonalcoholic steatohepatitis. To identify postnatal mechanisms responsible for this phenotype, we generated an inducible liver-specific Nrf1 knockout mouse line using animals harboring an Nrf1flox allele and a rat CYP1A1-Cre transgene (Nrf1flox/flox::CYP1A1-Cre mice). Administration of 3-methylcholanthrene (3-MC) to these mice (Nrf1flox/flox::CYP1A1-Cre+3MC mice) resulted in loss of hepatic Nrf1 expression. The livers of mice lacking Nrf1 accumulated lipid, and the hepatic fatty acid (FA) composition in such animals differed significantly from that in the Nrf1flox/flox::CYP1A1-Cre control. This change was provoked by upregulation of several FA metabolism genes. Unexpectedly, we also found that the level of glutathione was increased dramatically in livers of Nrf1flox/flox::CYP1A1-Cre+3MC mice. While expression of glutathione biosynthetic enzymes was unchanged, xCT, a component of the cystine/glutamate antiporter system xc−, was significantly upregulated in livers of Nrf1flox/flox::CYP1A1-Cre+3MC mice, suggesting that Nrf1 normally suppresses xCT. Thus, stress-inducible expression of xCT is a two-step process: under homeostatic conditions, Nrf1 effectively suppresses nonspecific transactivation of xCT, but when cells encounter severe oxidative/electrophilic stress, Nrf1 is displaced from an antioxidant response element (ARE) in the gene promoter while Nrf2 is recruited to the ARE. Thus, Nrf1 controls both the FA and the cystine/cysteine content of hepatocytes by participating in an elaborate regulatory network.
INTRODUCTION
Nrf1 is a member of the CNC-bZIP (Cap'n'Collar basic region leucine zipper) group of transcription factors. Four core members of this family have been identified, i.e., NF-E2 p45, Nrf1, Nrf2, and Nrf3, along with the two more distantly related members Bach1 and Bach2 (Citation1, Citation2). Upon stimulation, the CNC-bZIP factors heterodimerize in the nucleus with small Maf (sMaf) proteins (i.e., MafF, MafK, or MafG) before binding to antioxidant response element (ARE)/electrophile response element (EpRE) (TGA[G/C]NNNGC) sequences in the promoters of target genes, many of which exert cytoprotective functions. In addition, sMaf proteins can form homodimers that bind to a palindromic extended ARE sequence, called a Maf recognition element (MARE) (TGCTGA[G/C]TCAGCA), and in so doing repress genes involved in cell differentiation and organization, such as those for rhodopsin and crystallin (Citation3).
It has previously been shown that each CNC-bZIP factor regulates a different set of genes, despite the fact that their consensus binding sequences are similar. While NF-E2 p45 and Nrf3 are subject to tissue-specific expression, in hematopoietic cell lineages and placenta, respectively (Citation4Citation–Citation6), Nrf1 and Nrf2 are essentially expressed ubiquitously (Citation7). Importantly, it has been speculated that Nrf1 and Nrf2 may exhibit combinational or competitive functions, but details of the basis for their distinct activities have yet to be established (Citation7, Citation8). Furthermore, while full-length Nrf1 transactivates ARE-driven gene expression, several short Nrf1 isoforms exist that have been reported to repress ARE-driven genes (Citation9Citation–Citation11), and this may account for some of the differences observed between Nrf1 and Nrf2.
Analyses of gene knockout (KO) mouse lines have provided invaluable information about the physiological function of CNC-bZIP factors. We and other laboratories have knocked out all of the CNC-bZIP factors, and the phenotypes of the resulting mice have been described (Citation12). Among the knockout mouse lines, only Nrf1-null mice exhibit embryonic lethality. The majority of NF-E2 p45 knockout mice die because of bleeding during the neonatal period, whereas Nrf2- and Nrf3-null mice develop normally. Nrf1 deficiency results in hepatocyte dysfunction and impairment of early hematopoietic development, leading to death at embryonic day 13.5 (E13.5). Importantly, a similar phenotype is observed in the MafF−/−::MafG−/−::MafK−/− triple knockout mouse (sMaf-TKO) and the MafG−/−::MafK−/− double knockout mouse (sMaf-DKO), whereas single sMaf knockout mice do not show such an obvious phenotype. Furthermore, neuron-specific Nrf1 knockout, sMaf-TKO, and sMaf-DKO mice all accumulate significant amounts of misfolded protein in the spinal cord, which leads to neuronal disorders. Taken together, these findings indicate that Nrf1 along with sMaf proteins is indispensable for early development (Citation13).
In order to delineate the physiological function of Nrf1 and avoid embryonic lethality, we and others have employed the Cre-loxP system to create an Nrf1 floxed mouse (Nrf1flox/flox) in which exon 4, encoding the CNC-bZIP domain, is floxed (Citation8, Citation14). Using the Nrf1flox/flox mouse, liver-specific knockout animals have been generated by crossing them with animals harboring the albumin (ALB) promoter-driven Cre recombinase (Alb-Cre) transgene. This Nrf1 liver-specific knockout mouse showed severe hepatic steatosis and inflammation, which led to hepatic failure as a consequence of fibrosis and hepatocarcinoma (Citation8, Citation14).
From in vitro experiments, a model is emerging to explain the molecular regulation of Nrf1 activity, in which it is first cotranslationally inserted into the endoplasmic reticulum (ER) membrane before it is glycosylated and subsequently either targeted for ubiquitination by the ligases Hrd1, β-TrCP, and Fbxw7 or proteolytically processed on the ER membrane by various mechanisms, including ER-associated degradation (ERAD) (Citation15, Citation16). Recently, it was reported that Nrf1 transactivates proteasomal genes and that the proteasome inhibitor MG132 can stabilize Nrf1 protein and increase the expression of proteasome subunits (Citation17, Citation18). These experiments therefore suggest that a major function of Nrf1 is to regulate the proteasome system in a manner that ensures that malfolded proteins do not accumulate. However, as no specific chemical activators of Nrf1 have been described and as neonatal Nrf1 knockout mice (with Alb-Cre) rapidly succumb to disease, uncertainty exists about the identity of its target genes.
In this report, we describe an inducible hepatic Nrf1 knockout mouse that has allowed us to investigate, for the first time, processes in the postnatal liver that the CNC-bZIP factor controls. We found that the new liver-specific and inducible Nrf1 knockout mice accumulate lipid in the liver and exhibit a phenotype that resembles that of human nonalcoholic steatohepatitis (NASH). To elucidate how these mice develop steatohepatitis, we have employed a comprehensive lipidomics analysis by means of gas chromatography-mass spectrometry (GC-MS) and identified fatty acid (FA) metabolism pathways that are altered in the mutant mouse. We have complemented the lipidomics analysis with quantitative reverse transcription-PCR (qRT-PCR) of candidate genes, which led to the discovery of Apoer2, Vldlr, Fads3, and Alox5ap as new Nrf1 target genes. We also examined the glutathione content of postnatal livers lacking Nrf1 and, surprisingly, discovered a significant increase in glutathione levels as a result of xCT upregulation. Direct repression of the xCT gene by Nrf1 in hepatocyte and mouse embryonic fibroblast (MEF) cells was confirmed by qRT-PCR and chromatin immunoprecipitation (ChIP) experiments. Taken together, the data in this study revealed that Nrf1 regulates FA intake and cystine/cysteine homeostasis in hepatocytes.
MATERIALS AND METHODS
Transgenic mouse lines.
Nrf1 floxed mice (Nrf1flox/flox [here called Nrf1F/F] mice) and Nrf2 knockout mice (Nrf2−/− mice), generated as described previously (Citation8), were backcrossed for six generations onto a C57BL/6 genetic background. A transgenic mouse that harbors 8.5 kbp of the rat cytochrome P450, family 1, subfamily A, polypeptide 1 (CYP1A1) gene promoter and thus contains multiple arylhydrocarbon receptor (AhR) binding sites, ligated to the Cre recombinase gene (ERL, here called CYP1A1-Cre) (Citation19), was provided by Colin J. Henderson and C. Roland Wolf (University of Dundee, Scotland, United Kingdom); this mouse allows induction of Cre by AhR ligands. In the present study, we crossed Nrf1F/F mice with CYP1A1-Cre mice to generate Nrf1F/F::CYP1A1-Cre animals. The PCR-based genotyping methods employed have been described previously. Briefly, genomic DNA was extracted from ear punch or biopsy samples with a weak alkaline solution (25 mM NaOH) and neutralized with 2 M Tris-HCl (pH 8.0) buffer. Using genomic DNA as the template, Ex Taq DNA polymerase (TaKaRa, Shiga, Japan) was employed to amplify sequences of distinct sizes with the following primer sets: for the Nrf1F/F allele, 5′-TGACGGGGACAGAATCACCA-3′, 5′-CATGTCAGCCCATGCTTTGC-3′, and 5′-GAGAGCCATTTGACTCTTTTCACAA-3′; for the CYP1A1-Cre transgene, 5′-CAAATGTTGCTTGTCTGGTG-3′ and 5′-GTCAGTCGAGTGCACAGTTT-3′. The resulting products were separated by electrophoresis in 2.0% (wt/vol) agarose gels containing Tris-acetate-EDTA (TAE) buffer and were detected by fluorescence using an UV light transilluminator after staining the gel with ethidium bromide. All mice were maintained under standard animal house conditions with a 12-h dark cycle and allowed access ad libitum to water and an RM3 diet (SDS, Essex, United Kingdom). All studies were carried out on 8-week-old male mice in accordance with the United Kingdom Animals (Scientific Procedures) Act (1986) and the guidelines of the Animal Care and Use Committee of Tohoku University, both of which were subject to local ethical review.
Mouse treatment.
The AhR ligand 3-methylcholanthrene (3-MC) was employed to induce CYP1A1-Cre as described previously (Citation19). The 3-MC was dissolved in corn oil (Sigma-Aldrich, St. Louis, MO) at a concentration of 4.0 mg/ml with the help of a water bath ultrasound sonicator and was administered to mice as a single subcutaneous (s.c.) injection to give a dose of 40 mg/kg body weight.
Histology.
Formalin-fixed liver was dehydrated in absolute ethanol and embedded in paraffin by standard methods. Sections (approximately 4 μm) of liver were cut from the tissue-embedded paraffin block and stained with hematoxylin (a counterstain for nuclei) and eosin before they were examined under a light microscope. For lipid staining, snap-frozen liver was embedded in Tissue-Tek OCT compound (Sakura Finetech, Tokyo, Japan). Thereafter, cryostat sections (15 μm) were cut from the frozen tissue block and stained with oil red O and hematoxylin.
Clinical chemistry.
Plasma alanine aminotransferase (ALT), aspartate aminotransferase (AST), and lactate dehydrogenase (LDH) activities, along with plasma ALB, triacylglyceride (TG), and cholesterol (CHO) levels, were measured using kits on a Dry-Chem 7000 autoanalyzer (Fuji Film, Tokyo, Japan).
Metabolite measurement.
Phosphate-buffered saline (PBS)-perfused liver samples (approximately 50 mg) were plunged into 500 ml of methanol containing the internal standards methionine sulfone (MetSul) (50 mM), and camphor-10-sulfonic acid (CSA) (50 mM) and homogenized with zirconia beads at 5,000 rpm for 30 s at 4°C using a Precellys-24 instrument (Bertin Technologies, Montigny-le-Bretonneux, France). To remove protein, 500 ml of chloroform and 200 ml of distilled water (DW) were added to the samples, mixed thoroughly, and centrifuged at 2,300 × g for 5 min at 4°C. The upper aqueous layer was filtered through a 5-kDa-cutoff membrane filter (UFC3LCCNB-HMT; Human Metabolome Technologies, Tsuruoka, Japan). The resulting filtered material was dried under reduced pressure and suspended in 25 ml of DW. The measurement of extracted metabolites was performed by capillary electrophoresis time-of-flight mass spectroscopy (CE-TOFMS) as described previously with commercial electrophoresis buffer (H3302-1011and H3302-1021; Human Metabolome Technologies) (Citation20).
Lipid metabolomics assay.
Metabolites were extracted using methanol-chloroform (2:1, 600 μl) added to ∼100 mg frozen liver tissue. Samples were mixed with ball bearings by shaking at 25 Hz for up to 3 min (at 4°C) in a Qiagen TissueLyser II (Qiagen, Hilden, Germany) before being sonicated for 10 min. Chloroform-water (1:1, 200 μl of each) was added, and the samples were centrifuged (16,400 × g, 15 min). The organic and aqueous fractions were separated. To maximize metabolite extraction, a second volume of methanol-chloroform (2:1, 600 μl) was added to the protein pellet, and the procedure was repeated. The organic and aqueous fractions from the first and second extractions were combined. A 100-μl portion of the organic fraction was subjected to ultraperformance liquid chromatography-mass spectrometry (UPLC-MS) and direct-infusion mass spectrometry (DI-MS), and 200 μl was used for gas chromatography-mass spectrometry (GC-MS) and gas chromatography-flame ionization detection (GC-FID). Prior to analysis, the organic phase was dried in a fume hood. From the aqueous phase, a volume corresponding to ∼50 mg tissue (wet weight) was dried down under N2 and used for UPLC-tandem MS (UPLC-MS/MS), and the remainder was dried in an evacuated centrifuge (Eppendorf, Hamburg, Germany) (Citation21).
RNA isolation and real-time qPCR.
Total RNA was prepared from snap-frozen liver using TRIzol reagent (Life Technologies, Carlsbad, CA) according to the manufacturer's recommendations. A 5-μg aliquot of total RNA was treated with DNase I (Promega, Madison, WI) prior to being reverse transcribed with SuperScript II reverse transcriptase (Invitrogen). The resulting cDNA was used as a template for quantitative reverse transcription-PCR (qRT-PCR) on a TaqMan or SYBR green 7500 real-time PCR analyzer (Life Technologies); the TaqMan probes and primers are listed in .
TABLE 1 Primer and probe sets for qRT-PCR experiments
Protein determination.
Protein determination in liver samples was done using the bicinchoninic acid (BCA) protein assay reagent marketed by Pierce (Rockford, IL).
Glutathione measurement.
The levels of reduced glutathione (GSH) and oxidized glutathione (GSSG) were determined by modifications of the methods of Griffith (Citation22) and Rahman et al. (Citation23, Citation24). Briefly, snap-frozen liver (approximately 100 mg) was homogenized in 2.0 ml of ice-cold GSH sample buffer (25 mM Tris-HCl buffer [pH 8.0] containing 0.25 M sucrose) by three strokes of a Potter homogenizer (Thermo Fisher Sciences, Waltham, MA). A 1.5-ml aliquot of GSH lysis buffer (0.2 M potassium phosphate, 10 mM EDTA, 10% [wt/vol] meta-phosphoric acid, 1.2% [wt/vol] 5-sulfosalicylic acid, 0.2% [vol/vol] Triton X-100, 0.2% [vol/vol] NP-40, pH 7.5) was added to an equal volume of liver homogenate, and after 10 min of incubation on ice, the mixture was centrifuged at 3,000 × g for 5 min to precipitate protein. A 500-μl portion of the supernatant was withdrawn and neutralized with 1.0 ml of Tris buffer (1 M Tris-HCl, pH 7.5) prior to measurement of glutathione.
To determine total glutathione content, the neutralized lysates were diluted 5 times with GSH sample buffer. Aliquots, each of 50 μl, of the diluted samples were transferred to a 96-well plate, and 60 μl of an aqueous solution of 0.67 mg/ml of 5,5′-dithio-bis(2-nitrobenzoic acid) (DTNB) (Sigma) and 3.3 U/ml of glutathione reductase (Sigma) were added and incubated at room for 2 min to reduce GSSG to GSH. Finally, a 60-μl aliquot of a 0.67-mg/ml NADPH solution was added, and the rate of change in optical density at 412 nm (OD412) was immediately measured with a spectrophotometer (SpectraMax M5; Molecular Devices, Sunnyvale, CA) at 15-s intervals. The amount of GSH in samples was calculated against a GSH standard curve and normalized for protein concentration.
To determine GSSG, 200-μl portions of liver lysates were first treated for 1 h at 25°C with 4 μl of 2-vinylpyridine (diluted 1/10 in GSH lysis buffer) to block covalently free thiol groups. The reaction mixtures were then neutralized for 10 min at 25°C with 12 μl triethanolamine (diluted 1/6 in GSH lysis buffer) to remove excess 2-vinylpyridine. Once excess 2-vinylpyridine had been removed, 50-μl portions from the resulting mixtures were transferred to a 96-well plate, and 60-μl aliquots of an aqueous solution containing 0.67 mg/ml 5,5′-dithio-bis(2-nitrobenzoic acid) (DTNB) (Sigma) and 3.3 U/ml glutathione reductase (Sigma) were added to reduce GSSG to GSH by incubation at 25°C for 2 min. Finally, a 60-μl aliquot of a 0.67-mg/ml NADPH solution was added and the OD412 measured at 15-s intervals as described above. The concentrations of GSSG in samples were calculated against a GSSG standard curve and normalized against protein concentration. The content of GSH was calculated by deducting the amount of GSSG from the total glutathione content and normalizing the results for protein concentration.
Antibodies.
Antiserum raised in rabbits against recombinant mouse Nrf1 protein (i.e., mNrf1β, residues 293 to 742) has been described previously (Citation25). However, in the present study, this serum was immunopurified prior to use. Briefly, recombinant mNrf1β protein was isolated from lysates of Escherichia coli BL21(DE3) that had been transformed with pGEX4T/mNrf1β in three stages. First, the glutathione S-transferase (GST)–mNrf1β fusion protein was recovered from bacterial lysates by affinity chromatography on columns of glutathione-Sepharose 4B (GE Healthcare, Little Chalfont, United Kingdom) treated with thrombin protease (New England BioLabs, Ipswich, MA) to remove GST from the N-terminal end of mNrf1β, before being reapplied to the glutathione-Sepharose 4B column to remove free GST. Second, the mNrf1β containing material that was not retained by glutathione-Sepharose 4B was subjected to anion-exchange fast protein liquid chromatography (FPLC) on a Mono Q column (GE Healthcare). Third, the mNrf1β-containing material retained by FPLC and eluted by an NaCl gradient was finally purified by gel filtration liquid chromatography on a Superdex 75pg column (GE Healthcare). The resulting purified mNrf1β protein was conjugated to a HiTrap N-hydroxysuccinimide (NHS)-activated HP column (GE Healthcare) and used in absorption chromatography to purify Nrf1 antibodies from an IgG-enriched fraction of rabbit anti-Nrf1 serum (obtained by precipitation with 33% [wt/vol] ammonium sulfate of serum produced previously by Morabian Biotechnology Ltd. against mNrf1β). The antiserum against mouse Nrf2 has been described previously (Citation26). The mouse glyceraldehyde-3-phosphate dehydrogenase (GAPDH) antibody was purchased from Sigma-Aldrich and used to control for protein equal loading of cytosolic and total protein lysate. The proliferating cell nuclear antigen (PCNA) antibody was a gift from Philip J. Coates (University of Dundee, Scotland, United Kingdom).
Organelle fractionation and immunoblot analysis.
Snap-frozen pieces of liver (approximately 1.0 g) were cut into small pieces and homogenized in 1.5 ml of ice-cold 25 mM Tris-HCl buffer, pH 8.0, containing complete mini-EDTA-free protease inhibitor (Roche Applied Sciences, Penzberg, Germany) and 0.25 M sucrose by three or four strokes in a glass round-bottom homogenizer (Wheaton, Millville, NJ). The homogenate was filtered through a 100-μm2 mesh cell strainer (Becton, Dickinson and Company, East Rutherford, NJ) to remove connective tissue. Total liver lysate was prepared by adding radioimmunoprecipitation assay (RIPA) buffer (50 mM Tris, 150 mM NaCl, 1% [vol/vol] NP-40, 0.5% [wt/vol] deoxycholic acid, 0.1% [wt/vol] SDS, pH 7.4) to the filtered homogenate and left on ice for 30 min. The debris was subsequently removed by centrifugation at 16,000 × g for 20 min at 4°C. In order to examine nuclear, mitochondrial, ER and cytosol proteins separately, nuclei were prepared as a pellet from the filtered lysate by low-speed centrifugation (1,000 × g, 10 min, 4°C). Second, the 1,000 × g supernatant was collected, and mitochondria were prepared as a pellet following high-speed centrifugation (8,000 × g, 10 min, 4°C). Finally, the 8,000 × g supernatant was collected, and ER proteins were recovered as a pellet from ultra-high-speed centrifugation (105,000 × g, 60 min, 4°C). The supernatant fraction was considered to represent cytosolic protein. All of the organelle pellets were lysed with RIPA buffer. Immunoblotting of all of the fractions was performed as described previously (Citation24).
ChIP analysis.
The ChIP assay was performed using a mouse embryonic fibroblast (MEF) cell line from wild-type (WT) mice immortalized by introduction of the simian virus 40 (SV40) large T antigen. Immunoprecipitation was performed using anti-Nrf1 antibody (described above) and anti-Nrf2 antibody (12721; Cell Signaling Technology, Danvers, MA). The sequences of a PCR primer set for the thromboxane synthase gene (Txs) promoter, as a negative control, and those flanking ARE sequences in the promoters of xCT sites 1, 2, and 3 and a negative site (N-site), Apoer2, Fads3, Ldlr, Alox5ap, and Vldlr are described in . The amount of chromatin-associated DNA was estimated by qRT-PCR using the SYBR green procedure.
TABLE 2 Primer sets for ChIP experiment
Reporter gene assay for xCT gene promoter.
WT MEF or Nrf1 KO MEF cells were plated in 12-well plates (2 × 10⁵ cell per well) and incubated for 16 h. They were then transiently transfected with various xCT luciferase reporter plasmids (800 ng) using Lipofectamine 2000 reagent (Invitrogen) (Citation27). To control for transfection efficiency, 0.16 ng of phRL-TK (Promega) was cotransfected with the reporter plasmids. The cells were split and segregated between 6 wells of 96-well plates and cultured for 16 h after transfection. Where indicated, the effect of exogenously added diethyl maleate (DEM) on xCT promoter activity in the WT MEF or Nrf1 KO MEF cells was determined; in such instances, the transfected cells were treated with DEM (100 μM) or dimethyl sulfoxide (DMSO) (1/1,000) (0.1 μg/ml) at 37°C for 12 h. For analysis of xCT promoter activity, the cells were lysed with passive lysis buffer (Promega), and luciferase activity was measured with the reagents and protocols provided in the dual-luciferase reporter gene assay kit (Promega) using a multiplate reader (PheraSTAR FS, BMG Labtech, GmbH, Germany). Specific activity was calculated from light intensity measurements with a Renilla luciferase internal control.
Statistical analyses.
All data were analyzed using one-way analysis of variance (ANOVA) followed by the Newman-Keuls multiple-comparison test using GraphPad Prism software (GraphPad, La Jolla, CA).
RESULTS
Generation of an inducible liver-specific Nrf1 knockout mouse model.
In order to better understand the function of Nrf1 in adult liver, we generated a liver-specific and inducible knockout mouse line called Nrf1flox/flox::CYP1A1-Cre. Here we refer to these mutant mice as Nrf1F/F::1A1-Cre (). Administration of the AhR ligand 3MC to these animals induces Cre recombinase, thereby allowing excision of exon 4 in the floxed Nrf1 gene (). However, 3MC has been reported to stimulate acute lipid accumulation in the liver and produce oxidative stress when injected intraperitoneally (i.p.) at a dose of 100 mg/kg of body weight (BW) (Citation28, Citation29). We therefore conducted an initial pilot experiment, and found that administration of 3MC at 100 mg/kg BW i.p. in corn oil caused severe inflammation in white adipose tissue and pancreas that was not related to Nrf1 knockout (data not shown). We subsequently found that administration of 3MC subcutaneously (s.c.) at 40 mg/kg BW did not cause any sign of inflammation but did effectively induce Cre recombinase. Hence, we used these conditions to induce Cre recombinase expression in the present study. For this reason, in addition to the Nrf1F/F::1A1-Cre+Corn vehicle control, we also included Nrf1F/F+3MC and Nrf1F/F::1A1-Cre+Corn vehicle mice as further controls to monitor 3MC side effects and possible leaky expression of Cre under basal conditions. The inclusion of these additional controls rendered the data from our Nrf1F/F::1A1-Cre+3MC mice more convincing and robust than those from the Nrf1F/F::Alb-Cre mouse (Citation8).
FIG 1 Generation of the 3MC-inducible liver-specific Nrf1 knockout mouse. (A) Genomic structure of the Nrf1-floxed allele, the CYP1A1-Cre transgene, and the Nrf1-deleted allele after Cre-mediated recombination. Black boxes, open boxes, and gray boxes indicate Nrf1 coding, noncoding, and Cre coding exons, respectively. Open arrowheads are loxP sites, and filled arrowheads are primers for detection of the Nrf1-floxed and -deleted alleles. (B) Experimental scheme employed to knock out the Nrf1 gene. (C) Expression of Nrf1 mRNA in the liver from each of the four groups of mice (Nrf1F/F+Vehicle, Nrf1F/F+3MC, Nrf1F/F::1A1-Cre+Vehicle, and Nrf1F/F::1A1-Cre+3MC) determined by qRT-PCR. The results are normalized against mRNA for β-actin and are shown as relative mRNA levels using the expression level in Nrf1F/F+Vehicle as 1.0. Error bars represent standard errors of the means (SEM) (n = 6). The statistical significance of results, compared with data from the Nrf1F/F+Vehicle group, was calculated using one-way ANOVA with the Newman-Keuls multiple-comparison test. $, significant decrease; $$, P = 0.01 to 0.001. (D) PCR analyses to detect the Nrf1-floxed and -deleted alleles in liver genomic DNA. The 262-bp PCR band represents the floxed allele, and the 520-bp band represents the deleted allele. (E) Immunoblot analyses for Nrf1 protein in cytosolic, nuclear, and microsomal fractions with polyclonal Nrf1 antibody. Tubulin, PCNA, and calreticulin were used as loading controls for cytosolic, nuclear, and microsomal proteins, respectively. Individual lanes represent the protein samples from separate mouse livers. The right-hand lane (lane 11) shows cellular lysate from MG132-treated MEF cells as a positive control for Nrf1 protein. We repeated this experiment three times, and results were reproducible. Representative results are presented.
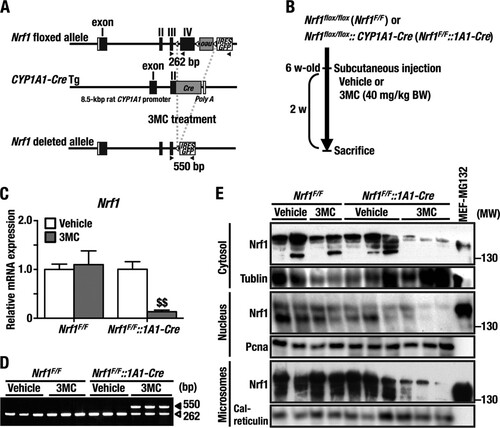
To assess the efficiency of the Nrf1 conditional knockout by CYP1A1-Cre, 6-week-old Nrf1F/F::1A1-Cre male mice were injected with 3MC s.c. (Nrf1F/F::1A1-Cre+3MC), and 2 weeks later these mice were sacrificed and examined (). As a control, we injected vehicle (corn oil) alone into Nrf1F/F::1A1-Cre mice (Nrf1F/F::1A1-Cre+Vehicle). In addition, Nrf1F/F mice injected with 3MC (Nrf1F/F+3MC) or vehicle alone (Nrf1F/F+Vehicle) were also used as controls.
Two weeks after the administration of a single dose of 3MC, Cre mRNA was still observed in the livers of Nrf1F/F::1A1-Cre+3MC mice, but it was not detected in the livers of control animals (i.e., Nrf1F/F::1A1-Cre+3MC, Nrf1F/F+3MC and Nrf1F/F+Vehicle mice) (data not shown). Of note, qRT-PCR analyses revealed that the level of Nrf1 mRNA in livers of Nrf1F/F::1A1-Cre+3MC mice was reduced to approximately 20% of that in the control mice (Nrf1F/F::1A1-Cre+Vehicle, Nrf1F/F+3MC, and Nrf1F/F+Vehicle) at 2 weeks after 3MC administration (). We also found that 3MC induced endogenous Cyp1a1 expression in the liver (data not shown). In contrast, the levels of Nrf1 mRNA in other organs, including brain, kidney, pancreas, spleen, muscle, intestine, and colon were essentially unchanged by administration of the single dose of 3MC, suggesting that knockdown of the Nrf1 gene is liver specific (data not shown).
To assess the efficiency of Cre-assisted recombination, we designed specific primer sets that detect both the exon 4-deleted and wild-type alleles (, arrowheads): the wild-type amplicon was 262 bp (a), whereas the recombinant amplicon was 550 bp (b). The recombination ratio [b/(a + b)] of whole genomic DNA from the livers of Nrf1F/F::1A1-Cre +3MC mice was approximately 60% (). Because rat CYP1A1 is expressed exclusively in liver parenchymal cells (Citation30), it seems likely that the recombination rate for Nrf1 in hepatocytes of Nrf1F/F::1A1-Cre +3MC mice is considerably greater than 60%.
To examine whether the reduction in Nrf1 mRNA results in loss of Nrf1 protein in hepatocytes, we immunoblotted Nrf1 in cytosolic, nuclear, and microsomal subcellular fractions of liver from Nrf1F/F::1A1-Cre+3MC, Nrf1F/F::1A1-Cre+Vehicle, Nrf1F/F+3MC, and Nrf1F/F+Vehicle mice, which were prepared as described in Materials and Methods. Consistent with the fact that Nrf1 is glycosylated in the ER lumen (Citation31, Citation32), we found that the Nrf1 antibody reacted with multiple protein bands of between 130 kDa and 150 kDa in all subcellular fractions from the control mouse livers (). Importantly the abundance of Nrf1 protein was significantly diminished in the cytosol, nucleus, and microsome fractions from Nrf1F/F::1A1-Cre+3MC animals, in agreement with the qRT-PCR data. These results demonstrate that the expression of Nrf1 can be reduced dramatically in a conditional fashion in the livers of adult Nrf1F/F::1A1-Cre mice using a single dose of 3MC to induce Cre recombinase.
The BW and liver-to-BW ratio did not change significantly between the Nrf1F/F::1A1-Cre+3MC, Nrf1F/F::1A1-Cre+Vehicle, Nrf1F/F+3MC, and Nrf1F/F+Vehicle mice (), suggesting that loss of Nrf1 in adult liver does not provoke catastrophic hepatocyte failure. Therefore, we conclude that the Nrf1F/F::1A1-Cre mouse can provide an important model system to study the physiological function of Nrf1 in hepatocytes.
TABLE 3 Mouse weight changes
Acute inducible loss of Nrf1 in mouse liver results in lipid accumulation and hepatocellular damage.
It has been reported that liver-specific knockout of Nrf1 by albumin-Cre in the neonatal mouse results in the spontaneous development of severe nonalcoholic steatohepatitis (NASH) (Citation8, Citation14). As it is unclear whether conditional Nrf1 knockout in adult mouse liver also leads to NASH, we first conducted histological examination of Nrf1F/F::1A1-Cre+3MC liver sections and evaluated phenotypic changes that accompanied acute knockout of hepatic Nrf1.
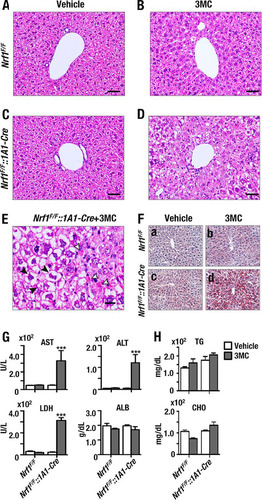
Of note, livers from Nrf1F/F::1A1-Cre+Vehicle, Nrf1F/F+3MC, and Nrf1F/F+Vehicle control animals did not exhibit obvious histological abnormalities ( to ). In contrast, livers from Nrf1F/F::1A1-Cre+3MC mice exhibited profound steatohepatitis with hepatocyte ballooning, apoptosis, Malony body formation, and lipid accumulation ( and ). Furthermore, significant lipid accumulation was confirmed in the Nrf1F/F::1A1-Cre+3MC group by oil red O staining (). Liver function testing by measurement of plasma ALT, AST, and LDH activities along with plasma ALB levels () revealed a marked impairment in hepatocellular integrity in Nrf1F/F::1A1-Cre+3MC mice as evidenced by a large increase in the acute liver toxicity markers AST, ALT, and LDH (). The levels of plasma ALB, triacylglyceride (TG), and cholesterol (CHO) did not differ between the groups of mice, indicating that the synthetic capacity of the hepatocytes was not compromised in the Nrf1F/F::1A1-Cre+3MC animals ( and ). These results thus demonstrate that acute knockout of Nrf1 in adult hepatocytes leads to liver toxicity and causes pathological features that resemble human NASH.
FIG 2 Nrf1 deficiency results in hepatic steatosis and acute liver injury consistent with NASH. (A to D) Formalin-fixed liver sections from Nrf1F/F and Nrf1F/F::1A1-Cre mice. The mice had been injected s.c. with a single dose of corn oil (vehicle) or 3MC 14 days prior to sacrifice. Livers from these animals were stained with hematoxylin and eosin (H/E). The images were collected under a magnification of ×200. (A) Vehicle-administered Nrf1F/F mice; (B) 3MC-administered Nrf1F/F mice; (C) vehicle-administered Nrf1F/F::1A1-Cre mice; (D) 3MC-administered Nrf1F/F::1A1-Cre mice. Scale bars represent 50 μm. (E) Higher magnification of the section presented in panel D. Open arrowheads show apoptotic hepatocytes, while filled arrowheads show Mallory bodies at a magnification of ×400. The scale bar represents 20 μm. (F) Liver frozen sections stained with oil red O. a, vehicle-administered Nrf1F/F mice; b, 3MC-administered Nrf1F/F mice; c, vehicle-administered Nrf1F/F::1A1-Cre mice; d, 3MC-administered Nrf1F/F::1A1-Cre mice. (G) Alanine aminotransferase (ALT), aspartate aminotransferase (AST), and lactate dehydrogenase (LDH) enzyme activities and albumin (ALB) protein level in plasma. (H) Triacylglyceride (TG) and cholesterol (CHO) levels in plasma. Plasma samples of four mice per group were measured using standard clinical chemistry assays. Error bars represent SEM. The statistical significance of results compared with data from the entire control group was calculated using a one-way ANOVA with the Newman-Keuls multiple-comparison test. ***, P < 0.001.
Nrf1 negatively regulates cystine intake and modulates cellular glutathione levels.
To investigate whether acute knockout of hepatic Nrf1 perturbs metabolism and/or produces oxidative stress, we first examined hepatic glutathione levels in the Nrf1F/F::1A1-Cre+3MC mice. For this purpose, 6-week-old Nrf1F/F::1A1-Cre mice were treated with a single dose of 3MC, and the livers were examined 2 weeks later. Remarkably, the levels of GSH and GSSG were both elevated in the Nrf1F/F::1A1-Cre+3MC livers (). The GSH-to-GSSG ratio, a hallmark of oxidative stress, did not differ in the livers of the 4 groups of animals. Hence, Nrf1F/F::1A1-Cre+3MC livers possessed strikingly elevated levels of total glutathione compared with the control groups, but the GSH-to-GSSG ratio was normal. It therefore appears that although Nrf1F/F::1A1-Cre+3MC livers suffer inflammation, this is not accompanied by oxidative stress.
FIG 3 The hepatic glutathione content is upregulated in Nrf1F/F::1A1-Cre+3MC mice. (A) Reduced glutathione (GSH) and oxidized glutathione (GSSG) in the livers from Nrf1F/F::1A1-Cre+3MC, Nrf1F/F::1A1-Cre+Vehicle, Nrf1F/F+3MC, and Nrf1F/F+Vehicle mice were measured by a modification of the method of Tieze (Citation23), and the [GSSG]/[GSH] ratio was calculated as a fold increase relative to that observed in Nrf1F/F::1A1-Cre+Vehicle livers. (B) Immunoblot analyses of Nrf2, Gclc, Gclm, and Nqo1. Aliquots of total lysates from three livers per group were separated by SDS-PAGE and transferred to Immobilon-P before being incubated with appropriate primary antibodies. Lane 1 shows a purified standard protein for Gclc, Gclm, and Nqo1. Equal loading was assessed by probing the blots with antibody against GAPDH. (C) xCT mRNA level determined by qRT-PCR. β-actin mRNA was used as an internal control. Each group consists of six individual mice. Error bars represent SEM. The statistical significance of results compared with data from the control group was calculated using one-way ANOVA with the Newman-Keuls multiple-comparison test. ***, P < 0.001.
![FIG 3 The hepatic glutathione content is upregulated in Nrf1F/F::1A1-Cre+3MC mice. (A) Reduced glutathione (GSH) and oxidized glutathione (GSSG) in the livers from Nrf1F/F::1A1-Cre+3MC, Nrf1F/F::1A1-Cre+Vehicle, Nrf1F/F+3MC, and Nrf1F/F+Vehicle mice were measured by a modification of the method of Tieze (Citation23), and the [GSSG]/[GSH] ratio was calculated as a fold increase relative to that observed in Nrf1F/F::1A1-Cre+Vehicle livers. (B) Immunoblot analyses of Nrf2, Gclc, Gclm, and Nqo1. Aliquots of total lysates from three livers per group were separated by SDS-PAGE and transferred to Immobilon-P before being incubated with appropriate primary antibodies. Lane 1 shows a purified standard protein for Gclc, Gclm, and Nqo1. Equal loading was assessed by probing the blots with antibody against GAPDH. (C) xCT mRNA level determined by qRT-PCR. β-actin mRNA was used as an internal control. Each group consists of six individual mice. Error bars represent SEM. The statistical significance of results compared with data from the control group was calculated using one-way ANOVA with the Newman-Keuls multiple-comparison test. ***, P < 0.001.](/cms/asset/69fcab07-6b95-45b7-a730-432d0c3d45b7/tmcb_a_12275397_f0003_oc.jpg)
The abundance of glutathione in the liver is regulated principally by glutamate-cysteine ligase (GCL), a heterodimeric enzyme that comprises a catalytic (GCLC) and a modifier (GCLM) subunit, whereas the final step, catalyzed by glutathione synthetase (GSS), is not rate limiting. We therefore analyzed the expression of Gclc and Gclm in mouse liver, as well as the prototypic Nrf2 target gene NADP(H):quinone oxidoreductase 1 (Nqo1). Immunoblotting showed that levels of Gclc, Gclm, and Nqo1 were not changed significantly by Nrf1 knockout, as demonstrated by comparison between Nrf1F/F::1A1-Cre+3MC livers and Nrf1F/F+3MC livers (). Moreover, qRT-PCR showed that Gclc, Gclm, and Gss mRNA levels were not changed significantly in the Nrf1F/F::1A1-Cre+3MC livers compared with control group livers (data not shown). These results therefore indicate that the increase in glutathione in the livers of Nrf1F/F::1A1-Cre+3MC mice is not due to overexpression of Gclc, Gclm, or Gss. Furthermore, as Gclc, Gclm, and Nqo1 are well-known Nrf2-targets, these data suggest that Nrf1 regulates a battery of genes distinct from that for Nrf2.
We next considered the mechanisms by which cells import cysteine, because the levels of this amino acid can be rate limiting during glutathione synthesis. In particular, we examined the cystine/glutamate antiporter system xc−, as it is responsible for cellular uptake of cystine, which is subsequently reduced to cysteine. System xc− is a heterodimeric amino acid transporter that consists of a light-chain xCT (SLC7A11) subunit and a heavy-chain 4Fhc (CD98hc/SLC3A2) subunit, with the variant adhesion molecule CD44v modulating its activity. The expression of the xCT and CD44v components is tightly associated with the cellular uptake of cystine (Citation33). We conducted qRT-PCR to analyze xCT expression, and to our surprise we found that its mRNA was markedly increased in Nrf1F/F::1A1-Cre+3MC livers compared with control livers (). These results indicate that Nrf1 negatively regulates the basal levels of cystine uptake by system xc− through suppression of xCT expression. It is well known that Nrf2 positively regulates xCT expression (Citation27). Therefore, cystine uptake by hepatocytes appears to be controlled by the combined actions of Nrf1 and Nrf2, and possibly Nrf1 and Nrf2 antagonize each other.
Nrf1 knockout causes accumulation of cysteine.
Since overexpression of xCT in Nrf1F/F::1A1-Cre+3MC livers may be responsible for the increase in glutathione, we examined whether changes in cysteine, or other amino acids, occur in the livers of these mice using capillary electrophoresis (CE) quadropole (Q)-TOFMS. As shown in , we found that the amount of cysteine was significantly elevated in the Nrf1F/F::1A1-Cre+3MC mouse livers (orange bars) compared with other control mouse groups (open, blue, and gray bars). The marked increase in cysteine was observed in both male and female mice (data not shown). In addition to cysteine, arginine, glutamate, and glycine were also increased in male Nrf1F/F::1A1-Cre+3MC mouse livers. While the increases of the latter amino acids were statistically significant, the magnitudes of the increases were moderate and these increases were not apparent in female Nrf1F/F::1A1-Cre+3MC livers (data not shown).
FIG 4 Cysteine accumulation in the livers of Nrf1F/F::1A1-Cre+3MC mice. (A) Relative abundances of amino acids in the livers from Nrf1F/F+Vehicle, Nrf1F/F+3MC, Nrf1F/F::1A1-Cre+Vehicle, and Nrf1F/F::1A1-Cre+3MC mice. The amino acid content of livers was determined using the cationic mode of CE-MS, and results are displayed as a fold change compared to Nrf1F/F+Vehicle samples. Error bars represent SEM (n = 3). (B) Levels of amino acids and their metabolites involved in glutathione synthesis. Metabolite levels were determined by CE-MS. Each bar corresponds to the same group of mice as in panel A. The values were standardized with methionine sulfone as an internal control and the results expressed as nmol/g of protein. Error bars represent SEM (n = 3). The statistical significance of results compared with data from the control group was calculated using a one-way ANOVA with the Newman-Keuls multiple-comparison test. *, P = 0.05 to 0.01; **, P = 0.01 to 0.001.
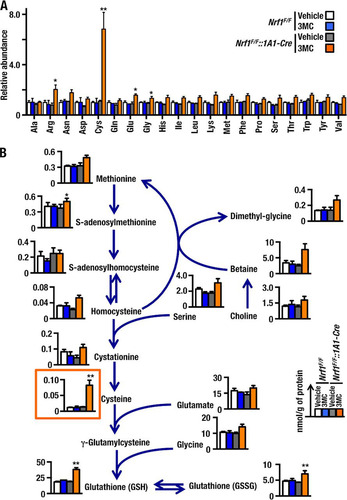
We also quantified metabolites associated with glutathione synthesis and sulfur-containing amino acids. As shown by the orange box in , the amount of cysteine was elevated in the Nrf1F/F::1A1-Cre+3MC mouse livers compared to control mouse groups. Of note, intermediate metabolites in the methionine-to-cysteine pathway, i.e., S-adenosylmethionine, S-adenosylhomocysteine, and homocysteine, were not increased significantly; this observation suggests that the methionine pathway was not principally responsible for the increase in cysteine. We also measured glutamate and glycine levels and found that these amino acids were far more abundant in the liver than cysteine, showing very good agreement with a previous report (Citation34). Therefore, we surmise that the existence of an alternative cysteine supply pathway, specifically cellular uptake of cystine (which is easily converted to cysteine), contributes substantially to the increase in cysteine and that this is responsible for the increased glutathione biosynthesis. These results suggest that Nrf1 regulates the intracellular cysteine pool by repressing expression of the cystine transporter xCT gene, thereby limiting cellular uptake of cystine.
Nrf1 is a direct repressor of xCT gene transactivation.
To address the question of whether Nrf1 regulates transcription of the xCT gene directly, we used ChIP analysis to examine binding of Nrf1 to the xCT gene regulatory region. Since no information about Nrf1 binding to the xCT locus was available, we first examined MafK ChIP-sequencing (ChIP-seq) information for E14.5 mouse embryonic stem (ES) cells and mouse erythroleukemia (MEL) cells provided through the Stanford/Yale transcriptional factor binding site database mapped onto the UCSC genome browser (NCBI37/mm9, http://genome.ucsc.edu). Through the MafK ChIP-seq data, we found three candidate Nrf1 binding sites that we designated site 1, site 2, and site 3 and that are localized in an upstream promoter region, intron 1, and intron 2, respectively (). These candidate sites each conform to the consensus ARE sequence ().
FIG 5 Nrf1 is a direct transcriptional repressor of xCT gene expression. (A) Nrf1 binding sites around the xCT genomic locus predicted from binding sites established for MafK. ChIP-seq profiles of MafK from ES cells (CH12 line) and MEL cells were obtained from the UCSC genome browser (http://genome.ucsc.edu). Significant peaks that cover ARE consensus sequences or negative binding sites are depicted as horizontal black bars and designated site 1, site 2, site 3, and N-site. (B) The ARE/EpRE sequences from predicted Nrf1 binding sites indicated in panel A are aligned. Nucleotides that are conserved between site 1, site 2, site 3, and the N-site are indicated as white letters on a black background. Black letters on a gray background indicate G or C residues that contribute to the ARE/EpRE consensus sequence. (C) ChIP-qPCR experiment performed with MEF cells and an Nrf1-specific antibody. (D) ChIP-qPCR experiment performed with MEF cells treated with DMSO vehicle or DEM (100 μM) for 6 h using an Nrf2-specific antibody. Specific primer sets were employed in qPCRs from precipitated DNA to detect site 1, site 2, site 3, and N-site separately. Txs, a genomic region in the third intron of Txs, was used as a negative control. N.D., below the limit of detection. (E) Nrf2 deficiency abolishes the upregulation of xCT that occurs upon knockout of Nrf1. The xCT mRNA levels were determined in four groups of mice (Nrf1F/F::Nrf2−/−+Vehicle, Nrf1F/F::Nrf2−/−+3MC, Nrf1F/F::Nrf2−/−::1A1-Cre+Vehicle, and Nrf1F/F::Nrf2−/−::1A1-Cre+3MC) by qRT-PCR. (F) Nrf1 deficiency leads to upregulation of xCT. The Nrf1, Nrf2, and xCT mRNA levels were determined in WT or Nrf1-KO MEF cells using qRT-PCR. (G) Schematic illustration of reporter constructs used in panels H and I. (H) Luciferase reporter gene assay to measure xCT transactivation in WT MEF (open bars) or Nrf1-KO MEF (filled bars) cells. WT MEF cells or Nrf1-KO MEF cells were transfected with the xCT reporter constructs depicted in panel E, and transfected cells were harvested 24 h later to determine the resulting firefly luciferase activity. Data were standardized against sea pansy luciferase activity. (I) Luciferase reporter gene activity was measured to assess xCT transactivation in WT MEF cells upon stimulation with DEM. The WT MEF cells were transfected with the xCT reporter constructs depicted in panel G. After 24 h of recovery, the transfected cells were treated with DEM (100 μM) or vehicle control for 12 h. The cells were harvested and firefly luciferase activity determined. Data were standardized for transfection efficiency using sea pansy luciferase activity. Experiments were performed in triplicate. Error bars represent SEM.
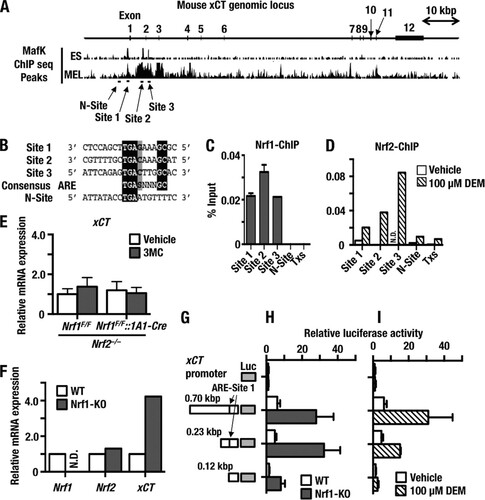
We extracted DNA from mouse embryonic fibroblast (MEF) cells and conducted a ChIP experiment using an immunopurified Nrf1 antibody and specific primer sets for site 1, site 2, and site 3. We also prepared primers for a negative site within xCT (N-site 1) and thromboxane synthase (Txs) () and utilized these as negative controls. This analysis revealed that Nrf1 bound to site 1, site 2, and site 3 but did not bind to either the N-site or Txs (). The xCT gene has been reported to be a target for Nrf2. To validate which of the xCT ARE sites recruit Nrf2, we performed ChIP analysis using an Nrf2 antibody with the DNA from MEF cells that had been treated with DMSO or 100 μmol/liter diethyl maleate (DEM) (an electrophile that activates Nrf2) for 6 h (). This revealed that Nrf2 was effectively recruited to the three xCT ARE sites in cells that had been treated with DEM.
To delineate the contribution made by Nrf2 to the upregulation of xCT mRNA in livers from Nrf1F/F::1A1-Cre+3MC mice, we crossed Nrf1F/F or Nrf1F/F::1A1-Cre mice with Nrf2−/− mice; here we refer to these as Nrf1F/F::Nrf2−/− and Nrf1F/F::Nrf2−/−::1A1-Cre mice. Following the methods employed to analyze Nrf1 knockout mice, 6-week-old male Nrf1F/F::Nrf2−/− and Nrf1F/F::Nrf2−/−::1A1-Cre mice were injected with 3MC or vehicle, and xCT mRNA was measured 2 weeks later. The substantial increase in xCT expression in livers of Nrf1F/F::1A1-Cre+3MC mice was abolished when they were crossed with Nrf2−/− mice (see the Nrf1F/F::Nrf2−/−::1A1-Cre+3MC group of mice []). These results support the conclusion that Nrf1 directly binds to ARE sequences in the xCT gene and exerts a negative effect on its expression. However, when the MEF cells encounter oxidative stress, Nrf2 is recruited as Nrf1 to the same xCT ARE sites and activates gene expression.
To further validate the relationship between Nrf1 and xCT gene regulation, we next exploited immortalized MEF cells prepared from Nrf1 knockout mice (Citation8). In the Nrf1-knockout (Nrf1-KO) MEF cells, the level of xCT mRNA was approximately 4-fold higher than that in MEF cells derived from WT mice. In comparison, the expression of Nrf2 was unchanged (). Thus, knockout of the Nrf1 gene provokes a reproducible increase in xCT gene expression, not only in mouse liver in vivo but also in MEF cells in culture.
We performed a luciferase reporter assay to further investigate the contribution of Nrf1 to repression of xCT. Three reporter plasmids were constructed by ligating the xCT upstream promoter region, which contains the Nrf1 binding site 1 identified in the ChIP assay, to firefly luciferase (Luc) (). While xCT-0.70-Luc and xCT-0.23-Luc both harbor the site 1 ARE, xCT-0.12-Luc lacked the element. We transfected these reporter plasmids into WT MEF cells and Nrf1-KO MEF cells and measured luciferase activity. The results revealed that the Luc reporter gene expression from xCT-0.70-Luc and xCT-0.23-Luc was markedly upregulated in Nrf1-KO MEF cells, but the increase was not observed in WT MEF cells (). This increase in Luc activity was not observed upon transfection of the xCT-0.12-Luc reporter plasmid into Nrf1-KO MEFs.
In order to determine whether the xCT gene is induced by Nrf2, we next examined the increase of Luc activity from these reporter constructs when WT MEF cells were treated with 100 μM DEM. We found that Luc activity from xCT-0.70-Luc and xCT-0.23-Luc constructs was markedly upregulated by DEM treatment, while the activity from the xCT-0.12-Luc reporter plasmid was not. These results indicate that the region between kbp 0.23 and 0.12, which contains site 1, contributes to the induction of Luc reporter activity by DEM ().
Taken together, these results support the notion that site 1 functions to enhance transcriptional activation of the xCT gene in response to Nrf2 induction. They further suggest that Nrf1 normally represses xCT gene expression, so that the xCT subunit is maintained at a low level under unstressed conditions but can be upregulated in response to inducers that activate Nrf2.
Acute loss of hepatic Nrf1 leads to accumulation of TGs in the liver due to overexpression of lipoprotein receptors.
As described above, histology and oil red O staining () revealed that Nrf1 knockout mice exhibit liver steatosis. To assess whether Nrf1 knockout influences lipid metabolism, we measured the lipid content of Nrf1F/F::1A1-Cre+3MC, Nrf1F/F::1A1-Cre+Vehicle, Nrf1F/F+3MC, and Nrf1F/F+Vehicle mouse livers. This was first examined by UPLC-MS. As shown in , the polar lipid content, which comprises mainly FAs derived from triacylglycerides (TGs), was significantly elevated in livers of Nrf1F/F::1A1-Cre+3MC mice compared with those in control mouse livers. In contrast, no change was observed in the nonpolar lipid content in livers of these four groups of mice (). Accordingly, the total lipid content (i.e., the sum of polar and nonpolar lipids) of Nrf1F/F::1A1-Cre+Vehicle, Nrf1F/F+3MC, and Nrf1F/F+Vehicle mouse livers was 30.10 ± 2.38, 31.45 ± 1.06, and 31.64 ± 1.26 mg/g tissue, respectively. In comparison, the total lipid content of livers from Nrf1F/F::1A1-Cre+3MC mice was 39.61 ± 4.4 mg/g tissue, which was significantly higher than that of control mouse livers (P < 0.001).
FIG 6 Accumulation of fatty acids and triacylglycerides in livers of Nrf1F/F::1A1-Cre+3MC mice. As a consequence of upregulation of lipoprotein receptors, lipid accumulated in the livers of Nrf1F/F::1A1-Cre+3MC mice. (A) Amounts of total polar and nonpolar lipids. These were determined in mouse liver by GC-MS and UPLC-MS. The abundance of lipids in livers from Nrf1F/F+Vehicle, Nrf1F/F+3MC, Nrf1F/F::1A1-Cre+Vehicle, and Nrf1F/F::1A1-Cre+3MC mice is shown. (B) Expression of receptors for lipoprotein intake and export. These were determined by qRT-PCR. Results are presented as relative hepatic mRNA levels compared with the amount in Nrf1F/F+Vehicle mice (designated 1.0 in each case). Histogram bar colors employed for the mouse groups are the same as in panel A. Error bars represent SEM (n = 6). The statistical significance of results compared with data from the control group was calculated using one-way ANOVA with the Newman-Keuls multiple-comparison test. *, P = 0.05 to 0.01; ***, P < 0.001.
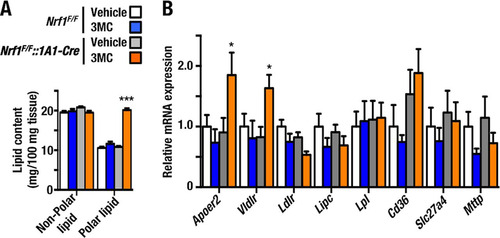
To explore the mechanisms by which FA levels are upregulated in Nrf1F/F::1A1+3MC mouse livers, we examined the expression levels of lipid transporters, which contribute to the uptake and export of TGs in these animals. In particular, we focused on the import of chylomicrons and very-low-density lipoproteins (VLDL), because these contain high levels of TG. Examination of the expression of apolipoprotein receptor 2 (Apoer2/LRP8), very-low-density lipoprotein receptor (Vldlr), low-density lipoprotein receptor (Ldlr), hepatic lipase (Lipc), CD36, solute carrier family 27 member 6 (Slc27a6), and microsomal triglyceride transporter protein (Mttp) revealed that Apoer2 and Vldlr were upregulated in Nrf1F/F::1A1+3MC mouse livers and that Ldlr demonstrated a nonsignificant downregulation in Nrf1F/F::1A1+3MC livers, while the other receptors and exporter did not show a marked change. These results suggest that Apoer2 and Vldlr may be targets of Nrf1 which contribute to the steatosis observed in livers of Nrf1 knockout mice ().
Nrf1 knockout leads to alteration of FA composition.
We next examined the composition of polar lipids, i.e., saturated FAs, monounsaturated FAs, and polyunsaturated FAs, in mouse liver using GC-FID. The results revealed that Nrf1F/F::1A1-Cre+3MC livers contained substantially larger amounts of all classes of FA than those in control Nrf1F/F::1A1-Cre+Vehicle, Nrf1F/F+3MC, and Nrf1F/F+Vehicle livers ().
FIG 7 Alteration of fatty acid composition in livers from Nrf1F/F::1A1-Cre+3MC mice. (A) Determination of FA composition, including saturated FA (SatFA), monounsaturated FA (MUFA), and polyunsaturated FA (PUFA), by GC-MS and GC-FID. The FA content of livers from Nrf1F/F+Vehicle, Nrf1F/F+3MC, Nrf1F/F::1A1-Cre+Vehicle, and Nrf1F/F::1A1-Cre+3MC mice are shown. (B) A scheme of the FA metabolic pathways shows changes in metabolic enzymes in livers of Nrf1F/F::1A1-Cre+3MC mice. The amounts of individual FAs and the levels of mRNAs for metabolic enzymes are superimposed. These FAs and mRNA levels in Nrf1F/F::1A1-Cre+3MC mouse livers are compared with those in control mice (i.e., Nrf1F/F+Vehicle, Nrf1F/F+3MC or Nrf1F/F::1A1-Cre+Vehicle). Increased amounts of FA in Nrf1F/F::1A1-Cre+3MC livers are indicated as red characters, while reduced amounts are in blue, no-change groups are in black, and not determined groups are in gray. (C) Expression profiles for FA desaturase gene family members. Expression of Fads1, -2, -3, -5, and -6 was determined by qRT-PCR. Results are shown as relative mRNA expression using the expression level in Nrf1F/F+Vehicle mice as 1.0. Histogram bar colors represent the same groups of mice as in panel A. (D) Expression levels of enzymes involved in the metabolism of arachidonic acid. Histogram bar colors represent the same groups of mice as in panel A. Error bars represent SEM (n = 6). The statistical significance of results compared with data from the control group was calculated using one-way ANOVA with the Newman-Keuls multiple-comparison test. ns, P > 0.05; **, P = 0.01 to 0.001; ***, P < 0.001.
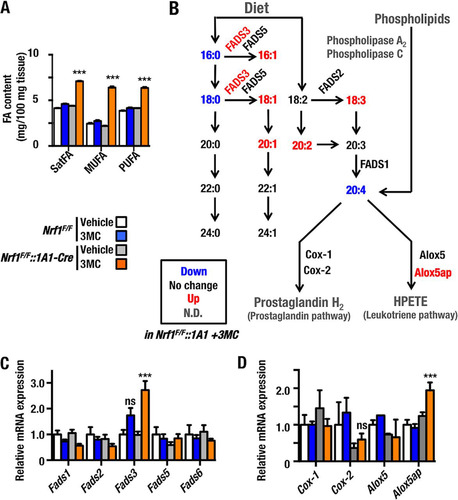
We then determined the relative abundances of individual FAs in Nrf1F/F::1A1+3MC livers using GC-MS and GC-FID. The results are summarized in a metabolomic map that includes the enzymes for FA elongation and desaturation (). We found that palmitic acid (16:0), stearic acid (18:0) and arachidonic acid (20:4) (Citation5, Citation8, Citation11, Citation14) were all diminished in Nrf1 knockout mouse livers (as depicted in blue in ). On the other hand, palmitoleic acid (16:1) (Citation9), oleic acid (18:1) (Citation9), gadoleic acid (20:1) (Citation9), γ-linoleic acid (18:3) (Citation9, Citation12, Citation15), and eicosadienoic acid (20:2) (Citation8, Citation11) were all elevated in Nrf1 knockout livers (depicted in red).
To explore the reason for this alteration in lipid content, we examined by qRT-PCR the expression of desaturase gene family members, including FA desaturase (FADS) genes Fads1, -2, -3, -5, and -6 (). We found that of all Fads mRNAs examined, the level of Fads3 mRNA was specifically and significantly upregulated in Nrf1F/F::1A1+3MC livers, which explains the increases in palmitoleic acid (16:1) (Citation9) and oleic acid (18:1) (Citation9) (as noted in ). The result suggests that Fads3 is a target of Nrf1. On the other hand, mRNAs for the other FADS genes did not show significant increases. Conversely, we noticed moderate decreases in mRNA for Fads1 and Fads2. The former is consistent with the observation that the level of arachidonic acid is decreased in Nrf1F/F::1A1+3MC livers.
Among FAs, the decrease in arachidonic acid in Nrf1 knockout livers was the most remarkable change detected by GC-MS. Therefore, we also examined the expression of enzymes involved in prostaglandin and leukotriene synthesis. Using qRT-PCR, we observed a specific and significant increase in the expression of 5-lipoxygenase-activating protein gene (Alox5ap/Flap) mRNA, that facilitates the synthesis of 5-hydroperoxyeicosatetraenoic acid (HPETE) ( and ).
Taken together, our results reveal that inducible liver-specific Nrf1 knockout leads to TG accumulation due to an excessive hepatic uptake of chylomicrons and VLDL particles. This appears to be a consequence of increased expression of Apoer2 and Vldlr. We also identified Alox5ap as a gene in the FA metabolomic pathway that is negatively regulated by Nrf1, suggesting that loss of Nrf1 triggers a switch from prostaglandin to leukotriene synthesis.
Nrf1 directly regulates genes for lipoprotein receptors and lipid-metabolizing enzymes.
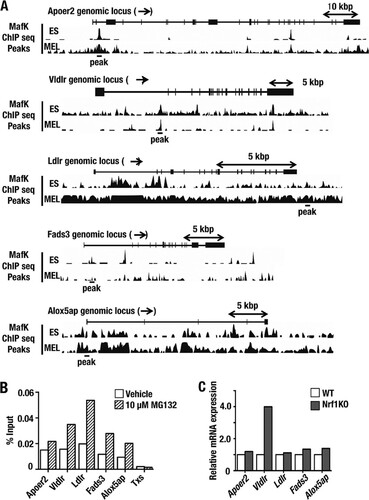
To determine whether Nrf1 regulates lipid-associated genes directly, we sought potential Nrf1 binding sites from the MafK ChIP-seq database provided at the Stanford/Yale transcriptional factor binding site mapped on the UCSC genome browser (NCBI37/mm9) in a manner similar to that employed for xCT. Through this strategy, we found candidate ARE consensus sequences in genes of interest, which we have referred to as Apoer2, Vldlr, Ldlr, Fads3, and Alox5ap sites (). To examine the significance of these sites, we extracted DNA from MEF cells that had been treated with vehicle or MG132 and conducted a ChIP experiment using an immunopurified Nrf1 antibody and specific primer sets for the ARE sites in Apoer2, Vldlr, Ldlr, Fads3, and Alox5ap (); we used a primer set for Txs as a negative control. These analyses revealed that Nrf1 bound to the Apoer2, Vldlr, Ldlr, Fads3, and Alox5ap sites even under normal conditions. When treated with MG132, which stabilizes Nrf1 protein, more Nrf1 was recruited to the Apoer2, Vldlr, Ldlr, Fads3, and Alox5ap sites. We next examined the expression profiles of Apoer2, Vldlr, Ldlr, Fads3, and Alox5ap in immortalized WT and Nrf1-KO MEF cells (Citation8). In Nrf1 knockout MEF cells, the Vldlr mRNA level was approximately 4-fold higher than that in MEF cells derived from WT mice. However, the expression levels of Apoer2, Fads3, and Ldlr did not differ between WT and Nrf1-KO MEF cells. Thus, loss of Nrf1 is not sufficient to activate Apoer2, Ldlr, Fads3, and Alox5ap gene expression.
FIG 8 Recruitment of Nrf1 protein to regulatory ARE sequences in genes of lipid receptors and lipid metabolism enzymes. (A) MafK binding sites around the Apoer2, Vldlr, Ldlr, Fads3, and Alox5ap genomic loci were used to identify potential Nrf1 binding sites. The ChIP-seq profiles of MafK presented are from ES cells (the CH12 line) and MEL cells and were obtained from the UCSC genome browser (http://genome.ucsc.edu). Significant peaks of MafK binding that cover ARE consensus sequences are depicted as horizontal bars labeled “peak” below each gene. (B) A ChIP-qPCR experiment was performed with MEF cells that had been treated with vehicle or MG132 (10 μM) for 6 h using an Nrf1-specific antibody and primers for Apoer2, Vldlr, Ldlr, Fads3, and Alox5ap; primers for Txs were used as a negative control. (C) The Apoer2, Vldlr, Ldlr, Fads3, and Alox5ap mRNA levels were determined in WT or Nrf1-KO MEF cells using qRT-PCR.
DISCUSSION
In order to delineate the function of Nrf1 in the liver, we have adopted two new approaches in this study. First, we have generated an Nrf1F/F::1A1-Cre compound mutant mouse in which the expression of Cre recombinase from the rat CYP1A1 promoter can be induced by AhR ligands (Citation19) and disrupts a floxed Nrf1 allele in order to analyze the acute loss-of-function effects of Nrf1 in adult mouse liver. This strategy was employed because knockout of Nrf1 in the livers of neonatal mice using the Alb-Cre transgene results in rapid spontaneous onset of NASH, making it difficult to dissociate the direct effects of loss of the transcription factor from those associated with liver development, as well as those that are secondary to disease. Importantly, our Nrf1F/F::1A1-Cre mouse system allows late-onset and inducible loss of function of Nrf1 in adult mouse liver. While the CYP1A1-Cre mouse has been employed previously to knock out cytochrome P450 oxidoreductase in mouse liver and small intestine (Citation19), it has not been employed to knock out a transcription factor such as Nrf1 whose function is poorly understood. Second, we have developed a new antibody for mouse Nrf1 and have used it to demonstrate the presence of significant amounts of Nrf1 protein in the nuclear fraction of mouse liver. Moreover, we have used this antibody in ChIP experiments to identify Nrf1 target genes. Taking advantage of these approaches, we have demonstrated a unique mode of Nrf1 function in the regulation of genes encoding redox-associated proteins, lipid receptors, and lipid-metabolizing enzymes.
The two CNC-bZIP transcription factors Nrf1 and Nrf2 bind to ARE sequences in antioxidant, detoxication, and metabolic genes with comparable efficiencies (Citation35). Our original hypothesis was that the batteries of genes regulated by Nrf1 and Nrf2 overlap. However, recent experiments have revealed that Nrf1 and Nrf2 regulate different genes in a distinct manner (Citation8). During characterization of the Nrf1F/F::1A1-Cre and Nrf1F/F mouse lines, we examined how Nrf1 influences cellular redox status and so investigated hepatic glutathione. Surprisingly, rather than diminishing glutathione, loss of Nrf1 in Nrf1F/F::1A1-Cre+3MC mouse liver caused a 2-fold increase in glutathione levels. The doubling of hepatic glutathione was associated with a remarkable 6-fold increase in the amount of hepatic cysteine, which is a rate-limiting amino acid in glutathione biosynthesis. We found that the increase in the cysteine pool is attributable to a greater uptake of cystine due to an increase in expression of the xCT gene product, a light-chain polypeptide in the cystine/glutamate antiporter system xc−.
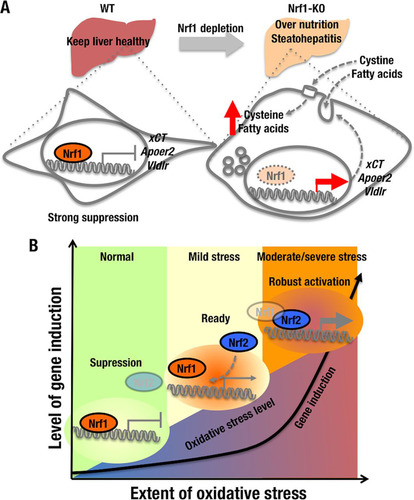
It has been reported that Nrf2 transactivates xCT gene expression (Citation27). In the present study, we have provided evidence that Nrf2 binds several regulatory ARE sequences in the xCT gene, and we have also shown that xCT is induced in MEF cells by the Nrf2 activator DEM. Based on these observations, we propose that Nrf1 is involved in a two-step stress-responsive induction of xCT and possibly other genes: as shown in , Nrf1 is recruited to ARE sequences in xCT under basal conditions, whereupon the CNC-bZIP protein contributes to gene repression, but it is displaced from these sites during oxidative/electrophile stress and thus allows other factors to induce xCT expression. It therefore seems likely that Nrf1 contributes to the suppression of certain stress-responsive genes under basal conditions, thereby helping to prevent wasteful and inappropriate expenditure of energy. However, when cells are exposed to severe oxidative and electrophile stress, the strong transcriptional activator Nrf2 may replace Nrf1 to transactivate cytoprotective genes robustly. In this regard, AhR is known to regulate Nrf2 expression (Citation36), and 3MC is metabolized by cytochromes P450 to yield electrophilic metabolites that attack reactive cysteine residues of Keap1. It is therefore possible that under the experimental conditions we employed, induction of Nrf2 through the AhR pathway and inactivation of Keap1 by electrophilic metabolites derived from 3MC also contribute a little to the massive increase in xCT expression we observed.
FIG 9 Two-step stress-responsive gene induction mediated by Nrf1 and Nrf2. (A) In normal liver, Nrf1 represses genes that are involved in cystine and lipoprotein uptake (i.e., xCT, Apoer2, and Vldlr). Knockout of Nrf1 increases expression of the cystine antiporter and lipoprotein receptors in hepatocytes, and the upregulation of these proteins contributes to the rapid development of NASH as a consequence of increased uptake of cystine and FAs into hepatocytes. Thus, Nrf1 prevents overnutrition in the liver and controls hepatic glutathione levels. (B) Under unstressed conditions, Nrf1 suppresses the expression of genes for nutrient and cystine intake by binding to ARE/EpRE motifs (suppression stage) in target genes as a heterodimer with small Maf (sMaf) proteins. Under stress conditions, the Nrf1-sMaf heterodimers are displaced from ARE/EpRE sequences to be replaced by Nrf2-sMaf heterodimers, and as a consequence target genes are induced. In the transition stage (i.e., mild stress conditions), Nrf1 and Nrf2 compete for binding to ARE/EpRE motifs, and induction of target genes is limited.
It was first discovered that global knockout of Nrf1 in the mouse results in death of embryos at E13.5, indicating that Nrf1 regulates genes that are critical for development (Citation37, Citation38). Subsequently, we and another research group separately generated liver-specific Nrf1 knockout mice using an Alb-Cre transgene and reported that the resulting animals exhibit steatohepatitis (Citation8, Citation14). Importantly, our present lipidomics GC-MS analyses revealed that FAs accumulate in Nrf1F/F::1A1-Cre+3MC mouse liver. These FAs seem to be derived from serum TGs, which are transported into the blood from the intestine within chylomicrons and VLDL particles. Liver cells take up these lipoprotein particles using the apoE-dependent receptor. Our results provide evidence that Apoer2 and Vldlr expression is increased in Nrf1F/F::1A1-Cre+3MC mouse liver, suggesting that the increase of these receptors contributes to the onset of hepatic steatosis. Furthermore, a modest increase in Cd36 may also contribute to the uptake of lipids in Nrf1F/F::1A1-Cre+3MC liver.
Our current expression analyses of the lipid-metabolizing enzymes are limited to qPCR, as immunoblotting experiments with these proteins await further technical advancement. Nonetheless, our contention that steatosis in Nrf1F/F::1A1-Cre+3MC livers may be due to increased uptake of chylomicrons and VLDL is supported by the observation that FAs accumulate in the livers of mice in which Vldlr, ApoE, and Cd36 are upregulated (Citation39Citation–Citation41) and in the livers of mice in which Mttp, a Vldl lipid exporter, is suppressed (Citation42). Our current analyses suggest that Nrf1 acts as a transcriptional repressor of the lipid-associated genes Apoer2, Vldlr, Fads3, and Alox5ap. The overexpression of the Apoer2 and Vldlr receptors is likely to contribute to the accumulation of lipid in livers of Nrf1F/F::1A1-Cre+3MC mice. As the expression of Apoer2 and Vldlr is low in normal conditions, we conclude that Nrf1 negatively regulates lipoprotein receptor genes, as it does for xCT, to prevent overnutrition resulting from excessive lipoprotein uptake. Furthermore, the increase in Alox5ap expression may increase leukotriene synthesis, and as leukotrienes are lipid mediators of inflammation, upregulation of this gene may accelerate progression of simple steatosis to NASH. It seems unlikely that the changes in expression of lipid transporters and lipid-metabolizing enzymes in Nrf1F/F::1A1-Cre+3MC livers are due to upregulation of the AhR pathway by 3MC, because they were not observed in Nrf1F/F+3MC livers, but it is still possible that the AhR pathway and Nrf1 exert combinatorial effects. Taking the results together, the two-step gene regulatory system described above for xCT may also operate for genes encoding lipid transporters and lipid-metabolizing enzymes.
The xCT light chain of the system xc− antiporter is overexpressed in glioblastoma, hepatocellular carcinoma, and pancreatic cancer and has been utilized as a biomarker for neoplastic disease (Citation43Citation–Citation45). A splice variant of CD44, designated CD44v, has been reported to stabilize xCT protein in cancer cells, increase GSH biosynthesis, and increase defense against reactive oxygen species (Citation33). CD44 is also highly expressed in several cancers, including colorectal cancer, metastatic breast cancer, and head and neck squamous cell carcinoma (Citation46Citation–Citation48). It has therefore been proposed that the CD44v-xCT axis represents a therapeutic anticancer target (Citation49). Our finding that Nrf1 is a major transcriptional repressor of xCT suggests that activation of this CNC-bZIP factor may also be a useful strategy in cancer medicine.
In conclusion, we have generated a novel inducible liver-specific Nrf1 knockout mouse and exploited it to identify hitherto-unknown contributions of Nrf1 to lipid metabolism and cystine/cysteine homeostasis. We have utilized MS analysis to quantify lipids, amino acids, and intermediary metabolites, and this approach has enabled us to discover a new set of Nrf1 target genes that are responsible for hepatic lipid accumulation, imbalance between unsaturated and saturated FAs, and excessive intake of cystine. This study thus reveals that Nrf1 has a broad repressor activity for the intake of nutrients by the liver. These observations have led us to formulate a model of gene regulation by Nrf1 that explains homeostatic repression and strong induction of cytoprotective and lipid-metabolizing genes by the CNC-bZIP factor and Nrf2.
ACKNOWLEDGMENTS
We are grateful to Colin Henderson and Roland Wolf for supplying CYP1A1-Cre mice and to Sudhir Chowdhry for technical assistance. We thank John Z. Sharkey and Albena Dinkova-Kostova for valuable discussions. We also thank Satomi Goto for assistance with mouse work, Eriko Naganuma for histology work, the Biomedical Research Core of the Tohoku University Graduate School of Medicine for technical support, and all members of the Tohoku University Graduate School of Medicine Department of Medical Biochemistry laboratory for valuable discussions.
This work was supported in part by Platform for Drug Discovery, Informatics, and Structural Life Science from the MEXT, Japan (T.T. and M.Y.), Association for International Cancer Research grant 07-0074 (J.D.H., M.Y., and T.T.), JSPS KAKENHI grant 25750357 (T.T.), the Naito Memorial Foundation (T.T. and M.Y.), and the Adaptable and Seamless Technology Transfer Program through target-driven R&D (A-STEP), Japan Science and Technology Agency grant J120001909 (T.T.).
Related Research Data
REFERENCES
- Motohashi H, O'Connor T, Katsuoka F, Engel JD, Yamamoto M. 2002. Integration and diversity of the regulatory network composed of Maf and CNC families of transcription factors. Gene 294:1–12. http://dx.doi.org/10.1016/S0378-1119(02)00788-6.
- Kobayashi M, Yamamoto M. 2006. Nrf2-Keap1 regulation of cellular defense mechanisms against electrophiles and reactive oxygen species. Adv. Enzyme Regul. 46:113–140. http://dx.doi.org/10.1016/j.advenzreg.2006.01.007.
- Motohashi H, Katsuoka F, Shavit JA, Engel JD, Yamamoto M. 2000. Positive or negative MARE-dependent transcriptional regulation is determined by the abundance of small Maf proteins. Cell 103:865–875. http://dx.doi.org/10.1016/S0092-8674(00)00190-2.
- Andrews NC, Kotkow KJ, Ney PA, Erdjument-Bromage H, Tempst P, Orkin SH. 1993. The ubiquitous subunit of erythroid transcription factor NF-E2 is a small basic-leucine zipper protein related to the v-maf oncogene. Proc. Natl. Acad. Sci. U. S. A. 90:11488–11492. http://dx.doi.org/10.1073/pnas.90.24.11488.
- Kobayashi A, Ito E, Toki T, Kogame K, Takahashi S, Igarashi K, Hayashi N, Yamamoto M. 1999. Molecular cloning and functional characterization of a new Cap‘n' collar family transcription factor Nrf3. J. Biol. Chem. 274:6443–6452. http://dx.doi.org/10.1074/jbc.274.10.6443.
- Oyake T, Itoh K, Motohashi H, Hayashi N, Hoshino H, Nishizawa M, Yamamoto M, Igarashi K. 1996. Bach proteins belong to a novel family of BTB-basic leucine zipper transcription factors that interact with MafK and regulate transcription through the NF-E2 site. Mol. Cell. Biol. 16:6083–6095.
- Hirotsu Y, Hataya N, Katsuoka F, Yamamoto M. 2012. NF-E2-related factor 1 (Nrf1) serves as a novel regulator of hepatic lipid metabolism through regulation of the Lipin1 and PGC-1β genes. Mol. Cell. Biol. 32:2760–2770. http://dx.doi.org/10.1128/MCB.06706-11.
- Ohtsuji M, Katsuoka F, Kobayashi A, Aburatani H, Hayes JD, Yamamoto M. 2008. Nrf1 and Nrf2 play distinct roles in activation of antioxidant response element-dependent genes. J. Biol. Chem. 283:33554–33562. http://dx.doi.org/10.1074/jbc.M804597200.
- Wang W, Kwok AM, Chan JY. 2007. The p65 isoform of Nrf1 is a dominant negative inhibitor of ARE-mediated transcription. J. Biol. Chem. 282:24670–24678. http://dx.doi.org/10.1074/jbc.M700159200.
- Zhao R, Hou Y, Xue P, Woods CG, Fu J, Feng B, Guan D, Sun G, Chan JY, Waalkes MP, Andersen ME, Pi J. 2011. Long isoforms of NRF1 contribute to arsenic-induced antioxidant response in human keratinocytes. Environ. Health Perspect. 119:56–62. http://dx.doi.org/10.1289/ehp.1002304.
- Chepelev NL, Zhang H, Liu H, McBride S, Seal AJ, Morgan TE, Finch CE, Willmore WG, Davies KJ, Forman HJ. 2013. Competition of nuclear factor-erythroid 2 factors related transcription factor isoforms, Nrf1 and Nrf2, in antioxidant enzyme induction. Redox Biol. 1:183–189. http://dx.doi.org/10.1016/j.redox.2013.01.005.
- Yamazaki H, Katsuoka F, Motohashi H, Engel JD, Yamamoto M. 2012. Embryonic lethality and fetal liver apoptosis in mice lacking all three small Maf proteins. Mol. Cell. Biol. 32:808–816. http://dx.doi.org/10.1128/MCB.06543-11.
- Kobayashi A, Tsukide T, Miyasaka T, Morita T, Mizoroki T, Saito Y, Ihara Y, Takashima A, Noguchi N, Fukamizu A, Hirotsu Y, Ohtsuji M, Katsuoka F, Yamamoto M. 2011. Central nervous system-specific deletion of transcription factor Nrf1 causes progressive motor neuronal dysfunction. Genes Cells 16:692–703. http://dx.doi.org/10.1111/j.1365-2443.2011.01522.x.
- Xu Z, Chen L, Leung L, Yen TS, Lee C, Chan JY. 2005. Liver-specific inactivation of the Nrf1 gene in adult mouse leads to nonalcoholic steatohepatitis and hepatic neoplasia. Proc. Natl. Acad. Sci. U. S. A. 102:4120–4125. http://dx.doi.org/10.1073/pnas.0500660102.
- Tsuchiya Y, Morita T, Kim M, Iemura S, Natsume T, Yamamoto M, Kobayashi A. 2011. Dual regulation of the transcriptional activity of Nrf1 by beta-TrCP- and Hrd1-dependent degradation mechanisms. Mol. Cell. Biol. 31:4500–4512. http://dx.doi.org/10.1128/MCB.05663-11.
- Biswas M, Phan D, Watanabe M, Chan JY. 2011. The Fbw7 tumor suppressor regulates nuclear factor E2-related factor 1 transcription factor turnover through proteasome-mediated proteolysis. J. Biol. Chem. 286:39282–39289. http://dx.doi.org/10.1074/jbc.M111.253807.
- Lee CS, Ho DV, Chan JY. 2013. Nuclear factor-erythroid 2-related factor 1 regulates expression of proteasome genes in hepatocytes and protects against endoplasmic reticulum stress and steatosis in mice. FEBS J. 280:3609–3620. http://dx.doi.org/10.1111/febs.12350.
- Tsuchiya Y, Taniguchi H, Ito Y, Morita T, Karim MR, Ohtake N, Fukagai K, Ito T, Okamuro S, Iemura S, Natsume T, Nishida E, Kobayashi A. 2013. The casein kinase 2-nrf1 axis controls the clearance of ubiquitinated proteins by regulating proteasome gene expression. Mol. Cell. Biol. 33:3461–3472. http://dx.doi.org/10.1128/MCB.01271-12.
- Finn RD, McLaren AW, Carrie D, Henderson CJ, Wolf CR. 2007. Conditional deletion of cytochrome P450 oxidoreductase in the liver and gastrointestinal tract: a new model for studying the functions of the P450 system. J. Pharmacol. Exp. Ther. 322:40–47. http://dx.doi.org/10.1124/jpet.107.121780.
- Ohashi Y, Hirayama A, Ishikawa T, Nakamura S, Shimizu K, Ueno Y, Tomita M, Soga T. 2008. Depiction of metabolome changes in histidine-starved Escherichia coli by CE-TOFMS. Mol. Biosyst. 4:135–147. http://dx.doi.org/10.1039/b714176a.
- Roberts LD, McCombie G, Titman CM, Griffin JL. 2008. A matter of fat: an introduction to lipidomic profiling methods. J. Chromatogr. B 871:174–181. http://dx.doi.org/10.1016/j.jchromb.2008.04.002.
- Griffith OW. 1980. Determination of glutathione and glutathione disulfide using glutathione reductase and 2-vinylpyridine. Anal. Biochem. 106:207–212. http://dx.doi.org/10.1016/0003-2697(80)90139-6.
- Rahman I, Kode A, Biswas SK. 2006. Assay for quantitative determination of glutathione and glutathione disulfide levels using enzymatic recycling method. Nat. Protoc. 1:3159–3165. http://dx.doi.org/10.1038/nprot.2006.378.
- Chowdhry S, Nazmy MH, Meakin PJ, Dinkova-Kostova AT, Walsh SV, Tsujita T, Dillon JF, Ashford ML, Hayes JD. 2010. Loss of Nrf2 markedly exacerbates nonalcoholic steatohepatitis. Free Radic. Biol. Med. 48:357–371. http://dx.doi.org/10.1016/j.freeradbiomed.2009.11.007.
- Zhang Y, Lucocq JM, Hayes JD. 2009. The Nrf1 CNC/bZIP protein is a nuclear envelope-bound transcription factor that is activated by t-butyl hydroquinone but not by endoplasmic reticulum stressors. Biochem. J. 418:293–310. http://dx.doi.org/10.1042/BJ20081575.
- McMahon M, Itoh K, Yamamoto M, Hayes JD. 2003. Keap1-dependent proteasomal degradation of transcription factor Nrf2 contributes to the negative regulation of antioxidant response element-driven gene expression. J. Biol. Chem. 278:21592–21600. http://dx.doi.org/10.1074/jbc.M300931200.
- Sasaki H, Sato H, Kuriyama-Matsumura K, Sato K, Maebara K, Wang H, Tamba M, Itoh K, Yamamoto M, Bannai S. 2002. Electrophile response element-mediated induction of the cystine/glutamate exchange transporter gene expression. J. Biol. Chem. 277:44765–44771. http://dx.doi.org/10.1074/jbc.M208704200.
- Kawano Y, Nishiumi S, Tanaka S, Nobutani K, Miki A, Yano Y, Seo Y, Kutsumi H, Ashida H, Azuma T, Yoshida M. 2010. Activation of the aryl hydrocarbon receptor induces hepatic steatosis via the upregulation of fatty acid transport. Arch. Biochem. Biophys. 504:221–227. http://dx.doi.org/10.1016/j.abb.2010.09.001.
- Jin Y, Miao W, Lin X, Pan X, Ye Y, Xu M, Fu Z. 27 May 2013. Acute exposure to 3-methylcholanthrene induces hepatic oxidative stress via activation of the Nrf2/ARE signaling pathway in mice. Environ. Toxicol. http://dx.doi.org/10.1002/tox.21870.
- Neupert G, Glöckner R, Müller D. 1998. Immunohistochemical localization of cytochrome P450 1A1 in precision-cut rat liver slices after in vitro exposure to β-naphthoflavone. Exp. Toxicol. Pathol. 50:514–518. http://dx.doi.org/10.1016/S0940-2993(98)80043-2.
- Wang W, Chan JY. 2006. Nrf1 is targeted to the endoplasmic reticulum membrane by an N-terminal transmembrane domain. Inhibition of nuclear translocation and transacting function. J. Biol. Chem. 281:19676–19687. http://dx.doi.org/10.1074/jbc.M602802200.
- Zhang Y, Crouch DH, Yamamoto M, Hayes JD. 2006. Negative regulation of the Nrf1 transcription factor by its N-terminal domain is independent of Keap1: Nrf1, but not Nrf2, is targeted to the endoplasmic reticulum. Biochem. J. 399:373–385. http://dx.doi.org/10.1042/BJ20060725.
- Ishimoto T, Nagano O, Yae T, Tamada M, Motohara T, Oshima H, Oshima M, Ikeda T, Asaba R, Yagi H. 2011. CD44 variant regulates redox status in cancer cells by stabilizing the xCT subunit of system xc− and thereby promotes tumor growth. Cancer Cell 19:387–400. http://dx.doi.org/10.1016/j.ccr.2011.01.038.
- Marquez J, Nunez de Castro I. 1991. Mouse liver free amino acids during the development of Ehrlich ascites tumour. Cancer Lett. 58:221–224. http://dx.doi.org/10.1016/0304-3835(91)90104-P.
- Chan JY, Han XL, Kan YW. 1993. Cloning of Nrf1, an NF-E2-related transcription factor, by genetic selection in yeast. Proc. Natl. Acad. Sci. U. S. A. 90:11371–11375. http://dx.doi.org/10.1073/pnas.90.23.11371.
- Miao W, Hu L, Scrivens PJ, Batist G. 2005. Transcriptional regulation of NF-E2 p45-related factor (NRF2) expression by the aryl hydrocarbon receptor-xenobiotic response element signaling pathway: direct cross-talk between phase I and II drug-metabolizing enzymes. J. Biol. Chem. 280:20340–20348. http://dx.doi.org/10.1074/jbc.M412081200.
- Murphy P, Kolstø A. 2000. Expression of the bZIP transcription factor TCF11 and its potential dimerization partners during development. Mech. Dev. 97:141–148. http://dx.doi.org/10.1016/S0925-4773(00)00413-5.
- Chen L, Kwong M, Lu R, Ginzinger D, Lee C, Leung L, Chan JY. 2003. Nrf1 is critical for redox balance and survival of liver cells during development. Mol. Cell. Biol. 23:4673–4686. http://dx.doi.org/10.1128/MCB.23.13.4673-4686.2003.
- Wang Z, Dou X, Li S, Zhang X, Sun X, Zhou Z, Song Z. 2014. Nrf2 activation-induced hepatic VLDLR overexpression in response to oxidative stress contributes to alcoholic liver disease in mice. Hepatology 59:1381–1392. http://dx.doi.org/10.1002/hep.26912.
- Kypreos KE. 2001. Domains of apolipoprotein E contributing to triglyceride and cholesterol homeostasis in vivo. Carboxyl-terminal region 203-299 promotes hepatic very low density lipoprotein-triglyceride secretion. J. Biol. Chem. 276:19778–19786. http://dx.doi.org/10.1074/jbc.M100418200.
- Li Y, Dong J, Ding T, Kuo MS, Cao G, Jiang XC, Li Z. 2013. Sphingomyelin synthase 2 activity and liver steatosis: an effect of ceramide-mediated peroxisome proliferator-activated receptor gamma2 suppression. Arterioscler. Thromb. Vasc. Biol. 33:1513–1520. http://dx.doi.org/10.1161/ATVBAHA.113.301498.
- Huang J, Iqbal J, Saha PK, Liu J, Chan L, Hussain MM, Moore DD, Wang L. 2007. Molecular characterization of the role of orphan receptor small heterodimer partner in development of fatty liver. Hepatology 46:147–157. http://dx.doi.org/10.1002/hep.21632.
- Takeuchi S, Wada K, Toyooka T, Shinomiya N, Shimazaki H, Nakanishi K, Nagatani K, Otani N, Osada H, Uozumi Y, Matsuo H, Nawashiro H. 2013. Increased xCT expression correlates with tumor invasion and outcome in patients with glioblastomas. Neurosurgery 72:33–41. http://dx.doi.org/10.1227/NEU.0b013e318276b2de.
- Guo W, Zhao Y, Zhang Z, Tan N, Zhao F, Ge C, Liang L, Jia D, Chen T, Yao M, Li J, He X. 2011. Disruption of xCT inhibits cell growth via the ROS/autophagy pathway in hepatocellular carcinoma. Cancer Lett. 312:55–61. http://dx.doi.org/10.1016/j.canlet.2011.07.024.
- Lo M, Ling V, Wang YZ, Gout PW. 2008. The xc-cystine/glutamate antiporter: a mediator of pancreatic cancer growth with a role in drug resistance. Br. J. Cancer 99:464–472. http://dx.doi.org/10.1038/sj.bjc.6604485.
- Dalerba P, Dylla SJ, Park IK, Liu R, Wang X, Cho RW, Hoey T, Gurney A, Huang EH, Simeone DM, Shelton AA, Parmiani G, Castelli C, Clarke MF. 2007. Phenotypic characterization of human colorectal cancer stem cells. Proc. Natl. Acad. Sci. U. S. A. 104:10158–10163. http://dx.doi.org/10.1073/pnas.0703478104.
- Al-Hajj M, Wicha MS, Benito-Hernandez A, Morrison SJ, Clarke MF. 2003. Prospective identification of tumorigenic breast cancer cells. Proc. Natl. Acad. Sci. U. S. A. 100:3983–3988. http://dx.doi.org/10.1073/pnas.0530291100.
- Yoshikawa M, Tsuchihashi K, Ishimoto T, Yae T, Motohara T, Sugihara E, Onishi N, Masuko T, Yoshizawa K, Kawashiri S, Mukai M, Asoda S, Kawana H, Nakagawa T, Saya H, Nagano O. 2013. xCT inhibition depletes CD44v-expressing tumor cells that are resistant to EGFR-targeted therapy in head and neck squamous cell carcinoma. Cancer Res. 73:1855–1866. http://dx.doi.org/10.1158/0008-5472.CAN-12-3609-T.
- Yae T, Tsuchihashi K, Ishimoto T, Motohara T, Yoshikawa M, Yoshida GJ, Wada T, Masuko T, Mogushi K, Tanaka H, Osawa T, Kanki Y, Minami T, Aburatani H, Ohmura M, Kubo A, Suematsu M, Takahashi K, Saya H, Nagano O. 2012. Alternative splicing of CD44 mRNA by ESRP1 enhances lung colonization of metastatic cancer cell. Nat. Commun. 3:883. http://dx.doi.org/10.1038/ncomms1892.