
ABSTRACT
hRpn13/ADRM1 links substrate recruitment with deubiquitination at the proteasome through its proteasome- and ubiquitin-binding Pru domain and DEUBAD domain, which binds and activates deubiquitinating enzyme (DUB) UCHL5/Uch37. Here, we edit the HCT116 colorectal cancer cell line to delete part of the hRpn13 Pru, producing cells that express truncated hRpn13 (trRpn13), which is competent for UCHL5 binding but defective for proteasome interaction. trRpn13 cells demonstrate reduced levels of proteasome-bound ubiquitinated proteins, indicating that the loss of hRpn13 function at proteasomes cannot be fully compensated for by the two other dedicated substrate receptors (hRpn1 and hRpn10). Previous studies indicated that the loss of full-length hRpn13 causes a corresponding reduction of UCHL5. We find UCHL5 levels unaltered in trRpn13 cells, but hRpn11 is elevated in ΔhRpn13 and trRpn13 cells, perhaps from cell stress. Despite the ∼90 DUBs in human cells, including two others in addition to UCHL5 at the proteasome, we found deletion of UCHL5 from HCT116 cells to cause increased levels of ubiquitinated proteins in whole-cell extract and at proteasomes, suggesting that UCHL5 activity cannot be fully assumed by other DUBs. We also report anticancer molecule RA190, which binds covalently to hRpn13 and UCHL5, to require hRpn13 Pru and not UCHL5 for cytotoxicity.
INTRODUCTION
The ubiquitin-proteasome system (UPS) regulates protein degradation and is required for cellular homeostasis (Citation1Citation–Citation3). Ubiquitinated substrates are recognized by the 19S regulatory particle (RP) of the proteasome, which abuts the 20S core particle (CP), where proteolysis occurs (Citation1, Citation4). Ubiquitin receptor sites in RP subunits hRpn1/S2/PSMD2 (Citation5), hRpn10/S5a (Citation6), and hRpn13/ADRM1 (Citation7, Citation8) bind directly to substrate-attached ubiquitin chains or ubiquitin folds of substrate shuttle factors (Citation5, Citation7Citation–Citation13), which also activate enzymatic activities of the 26S proteasome (Citation14). Prior to proteolysis, ubiquitin chains are deconjugated and removed from substrates by the activity of RP deubiquitinating enzymes (DUBs) UCHL5/Uch37 (Citation15), USP14/Ubp6 (Citation16Citation–Citation18), and hRpn11 (Citation19, Citation20). hRpn1 and hRpn13 bind USP14 (Citation21) and UCHL5, respectively (Citation22Citation–Citation25), whereas hRpn10 has a C-terminal domain for ubiquitin E3 ligase E6AP/UBE3A (Citation26).
Proteasome inhibitors that target CP β5 and iβ5 are used to treat hematological cancers (Citation27). Targeting the proteasome through hRpn13 has emerged as a promising alternative and/or synergistic therapeutic strategy based on results obtained in cell culture or mouse xenograft models (Citation28Citation–Citation33). Chalcone derivatives that covalently adduct to hRpn13 trigger accumulation of ubiquitinated proteins and apoptosis and restrict tumor growth (Citation28, Citation29, Citation31Citation–Citation33). These compounds are active in bortezomib-resistant multiple myeloma cell lines (Citation28, Citation31) and synergistic with lenalidomide, pomalidomide, or bortezomib against multiple myeloma (Citation29).
hRpn13 contains two functional domains, an N-terminal pleckstrin-like receptor for ubiquitin (Pru) domain that binds ubiquitin and the proteasome (Citation7, Citation8, Citation33, Citation34) and a C-terminal deubiquitinase adaptor (DEUBAD) domain (Citation35) that binds and activates UCHL5 (Citation22Citation–Citation25). The two domains can interact, restricting hRpn13 binding to ubiquitin chains, but dissociate at the proteasome (Citation36). hRpn13 and UCHL5 are required for proper cell cycle progression (Citation32), and the ADRM1 gene that encodes hRpn13 is upregulated in a variety of human cancers with inhibited proliferation upon knockdown (Citation37Citation–Citation40). UCHL5 deletion is embryonic lethal in mice (Citation41), and Rpn13-null mice die soon after birth (Citation42).
hRpn13 and UCHL5 are physically and functionally coupled, with knockdown of hRpn13 by short interfering RNA (siRNA) yielding reduced UCHL5 protein levels (Citation23, Citation32). This finding potentially both impacts and complicates the discovery that hRpn13 is required for RA190-induced cell death (Citation29, Citation33), as RA190 also targets UCHL5 in vitro (Citation31, Citation33). In this study, to better define the role of hRpn13 and UCHL5 at the proteasome and in RA190 cellular targeting, we used gene editing in combination with functional assays. We generated an HCT116-derived cell line that expresses defective hRpn13 (trRpn13), with a Pru domain missing the RA190-targeted Cys88 and unable to bind the proteasome. The hRpn13 DEUBAD domain remained intact and competent for binding to UCHL5, the levels of which were unaffected by Pru domain loss. We compared effects at the proteasome and following RA190 treatment in trRpn13 cells to the parental cell line. In addition, we generated another HCT116-derived cell line deleted of UCHL5 (ΔUCHL5). This research strategy enabled us to uncouple the impact of hRpn13 and UCHL5 in the cellular response to RA190 and ubiquitin-mediated protein degradation by the proteasome.
RESULTS
Generation of an HCT116-derived cell line with a defective hRpn13 Pru domain.
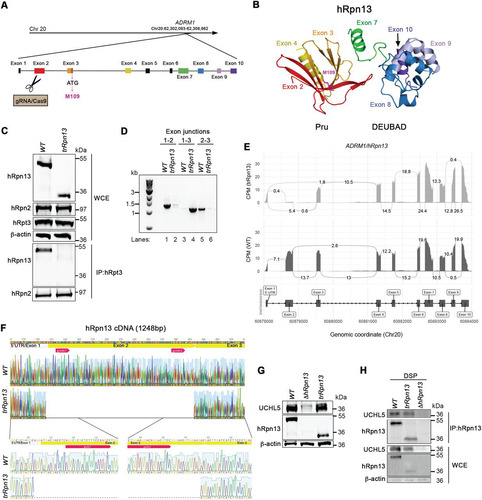
In an attempt to generate an hRpn13-deleted cell line with a selection-free frameshift mutation, we designed guide RNAs for CRISPR/Cas9 gene editing of the HCT116 colorectal cancer cell line that targeted ADRM1 exon 2 (), which is the first protein-coding exon (). Immunoprobing for hRpn13 in a clone derived by this approach revealed a truncated protein that migrates by SDS-PAGE at a molecular weight of ∼12 kDa smaller than that of full-length hRpn13 (, top). Here, we refer to this cell line and the hRpn13 protein product as trRpn13. Based on our targeting of exon 2, the size of the observed truncated protein, and examination of the hRpn13 sequence, we hypothesized that trRpn13 was generated by in-frame deletion of exon 2, allowing for the initiation of protein coding at a nearby methionine located toward the end of exon 3. To test directly whether the smaller trRpn13 is missing exon 2, we performed RT-PCR on mRNA isolated from trRpn13 and the parental HCT116 cell line, here referred to as the wild type (WT). We used primers spanning the first three exon junctions and found that the trRpn13 mRNA is indeed missing exon 2. In particular, the exon 1-exon 2 and exon 2-exon 3 junctions were readily observable in WT but not trRpn13 cells (, lanes 1 and 5 versus 2 and 6). In contrast, the exon 1-exon 3 junction was prominent in trRpn13 but not WT cells (, lane 4 versus 3). Next, we performed transcriptome sequencing (RNA-seq) analyses on total mRNA isolated from three replicate samples of WT and trRpn13 cells. As expected from reverse transcription-PCR (RT-PCR) (), exon 2 expression was observed to be close to background levels in trRpn13 cells with all other exons unaffected (), confirming that trRpn13 expresses a truncated hRpn13 protein missing exon 2 of the Pru domain. To more confidently identify the deletion in trRpn13, we performed Sanger sequencing analyses of ADRM1 cDNA from the WT and trRpn13 cell lines. Sanger sequencing indicated unambiguously the deletion of the first protein-coding exon ().
FIG 1 Generation of a cell line expressing truncated hRpn13 (trRpn13) competent for binding UCHL5 but not proteasome. (A) Schematic representation of the hRpn13-expressing ADRM1 gene highlighting and labeling each forward strand exon, including noncoding exon 1 and gRNA-targeted exon 2. Exons 3 to 10, as well as the ATG codon in exon 3 encoding M109, are also indicated. (B) Structure of hRpn13 (PDB 2KR0) highlighting exons of the ADRM1 gene colored as displayed in panel A. Exons 1 to 4 and 8 to 10 express the hRpn13 Pru and DEUBAD domains, respectively, with exon 7 yielding a helix that bridges these two structural domains. Exons 5 and 6 express parts of the protein that are intrinsically disordered and are omitted from this figure. The side chain heavy atoms are displayed (pink) for M109, which is located at the end of a helix encoded by exon 3. (C, top) Whole-cell extract from HCT116 (WT) or trRpn13 cells was resolved and analyzed by immunoprobing for hRpn13, hRpn2, or hRpt3, as indicated, with β-actin used as a loading control. (Bottom) Proteasomes from WT or trRpn13 whole-cell extract were immunoprecipitated (IP) with anti-Rpt3 antibodies and immunoprobed for hRpn13 or hRpn2 as a positive control. (D) Total RNA from HCT116 (WT) or trRpn13 was reverse transcribed to cDNA and subjected to PCR for evaluation with primers targeting the indicated ADRM1 exon junctions. PCR products were run on a 1% agarose gel and visualized by SYBR safe DNA gel stain. (E) Sashimi plot depicting normalized coverage for the ADRM1 gene that expresses hRpn13 in HCT116 trRpn13 or WT cells. (Top) Counts-per-minute (CPM)-normalized expression is shown along the y axis for the length of the gene along the x axis. Reads spanning splice junctions are depicted as arcs annotated with CPM-normalized counts. (Bottom) Schematic of the primary transcript (ENST00000253003) for the gene from the Ensembl database, version 75, with exons shown as boxes, introns shown as lines, and arrows indicating the direction of transcription. Numbers at the bottom denote the chromosomal coordinates along chromosome 20. (F) Sanger sequencing analysis of hRpn13 cDNA from WT or trRpn13 cells denoting the location of the two sgRNAs (red arrows), 5′ UTR, which includes exon 1 (gray arrow), and protein-coding exon 2 and exon 3 (yellow bars). An expansion is included in the lower panel showing the 5′ and 3′ portions from the deletion of exon 2. This image was generated by using Geneious. (G) Lysates from WT, ΔhRpn13, or trRpn13 cells were immunoprobed for UCHL5, hRpn13, or β-actin (as a loading control). (H) Lysates from WT, ΔhRpn13, or trRpn13 cells treated for 30 min with the cross-linker DSP were subjected to immunoprecipitation with anti-Rpn13 antibodies, and the immunoprecipitants were immunoprobed for UCHL5 or hRpn13 as indicated. Immunoblots of the whole-cell extract (WCE) are included as indicated in the lower panels for UCHL5, hRpn13, or β-actin (as a loading control).
Disrupting Pru abrogates hRpn13 interaction with the proteasome without affecting levels or interaction with UCHL5.
hRpn13 residues from exon 2 and exon 3 are used to bind the proteasome through RP component hRpn2 (Citation33, Citation34, Citation43); therefore, we hypothesized that trRpn13 does not associate with the proteasome. To test this hypothesis, we immunoprecipitated proteasomes from WT or trRpn13 cells by using antibodies against the RP ATPase component hRpt3 and immunoprobed for the presence of hRpn13 or hRpn2 (as a positive control). Full-length hRpn13 from WT cells was readily immunoprecipitated with anti-Rpt3 antibodies, as expected. In contrast, trRpn13 expressed in trRpn13 cells did not coimmunoprecipitate with hRpt3 (, bottom).
To assess whether UCHL5 protein levels are reduced in trRpn13 cells, as previously observed for ΔhRpn13 cells (Citation33), whole-cell extract from ΔhRpn13, trRpn13, or WT cells was analyzed by immunoprobing for UCHL5 with β-actin as a loading control. As expected (Citation33), loss of UCHL5 was observed in ΔhRpn13 cells (). However, in trRpn13 cells, levels of UCHL5 were unaltered compared to those of the WT (), indicating that loss of the hRpn13 Pru domain does not impact UCHL5 protein steady-state levels.
We next tested whether trRpn13 interacts with UCHL5. A cross-linking immunoprecipitation experiment was performed by treating trRpn13, ΔhRpn13 (as a negative control), or WT cells with dithiobis(succinimidyl propionate) (DSP) and immunoprecipitating hRpn13 with anti-Rpn13 antibodies. UCHL5 was observed to coimmunoprecipitate with hRpn13 from both WT and trRpn13 cells by immunoprobing with anti-UCHL5 antibodies (). Altogether, our data demonstrate that the Pru domain is essential for hRpn13 interaction with the proteasome and that its deletion does not impact hRpn13 interaction with UCHL5 or UCHL5 protein levels.
Ubiquitinated proteins accumulate in HCT116 cells lacking UCHL5.
To further interrogate the functional contribution of hRpn13 versus UCHL5 in proteasome function, we used CRISPR/Cas9 gene editing with RNA guides against UCHL5 exon 1 () to generate an HCT116-derived cell line deleted of UCHL5. RNA-seq analyses of total mRNA isolated from ΔUCHL5 or WT cells demonstrated UCHL5 mRNA loss across all protein-coding regions (). Quantitative real-time PCR analysis of WT or ΔUCHL5 cells confirmed an approximately 97% downregulation of UCHL5 mRNA for ΔUCHL5 compared to that of WT cells (P < 0.0001) (). Loss of the UCHL5 protein in ΔUCHL5 cells was validated by immunoprobing lysates from ΔUCHL5 or WT cells for UCHL5 with β-actin used as a loading control; levels of hRpn13, hRpn2, and hRpt3 appeared unaffected by UCHL5 loss ().
FIG 2 Levels of ubiquitinated proteins at the proteasome are altered in cells deleted of hRpn13, UCHL5, or the hRpn13 Pru. (A) Schematic representation of the UCHL5 gene from chromosome 1 depicting and labeling the exons as well as the gRNA targeting of exon 1 to generate the ΔUCHL5 cell line. (B) Sashimi plots depicting normalized coverage for the UCHL5 gene in HCT116 ΔUCHL5 or WT cells. (Top) CPM-normalized expression is shown along the y axis for the length of the gene along the x axis. Reads spanning splice junctions are depicted as arcs annotated with CPM-normalized counts. (Bottom) Schematic of the primary transcript (ENST00000367455) for the gene from the Ensembl database, version 75, with exons shown as boxes, introns shown as lines, and arrows indicating the direction of transcription. Numbers at the bottom denote the chromosomal coordinates along chromosome 1. (C) Total RNA from WT or ΔUCHL5 cells was reverse transcribed to cDNA and subjected to TaqMan PCR for UCHL5 mRNA analysis. β-Actin was used as an internal standard, and the data were normalized to the WT by using the 2–ΔΔCT method. Reported values represent means, with error bars indicating standard errors of the means (SEM) for n = 6. Fold change is also indicated for ΔUCHL5 compared to the WT. ****, P < 0.0001 by Student's t test analysis. (D) Lysates from WT or ΔUCHL5 cells were resolved and analyzed by immunoprobing for hRpn13, hRpt3, or hRpn2, as indicated, with β-actin as a loading control. (E) Whole-cell extract (WCE) from WT, ΔhRpn13, trRpn13, or ΔUCHL5 cells were resolved and analyzed by immunoprobing for ubiquitin (Ub), hRpn13, UCHL5, or proteasome components hRpn1, hRpn2, hRpn10, hRpn11, hRpt3, or USP14, as indicated. β-Actin was used as a loading control. Graphical plots show protein levels in ΔhRpn13, trRpn13, or ΔUCHL5 cells relative to the WT after normalization to β-actin for ubiquitin (Ub) levels in the region bracketed (left), hRpn1, hRpn2, hRpn10, hRpn11, hRpt3, and USP14. Data are plotted as average fold changes ± SEM for three independent experiments. (F) Proteasomes from WT, ΔhRpn13, trRpn13, or ΔUCHL5 cells were immunoprecipitated (IP) with anti-Rpt3 antibodies and the immunoprecipitates immunoprobed for ubiquitin (Ub), hRpn13, UCHL5, or proteasome components hRpn1, hRpn2, hRpn10, hRpn11, or hRpt3, as indicated. Graphical plots indicate protein levels in ΔhRpn13, trRpn13, or ΔUCHL5 cells relative to the WT after normalization to hRpn2 for ubiquitin (Ub) levels in the region bracketed (left), hRpn1 and hRpn10. Data are plotted as average fold changes ± SEM for three independent experiments. Bulk ubiquitin was probed with antiubiquitin/P4D1 (3936; Cell Signaling Technology). Dashed lines are included for the plots in panels E and F at a value of 1.0.
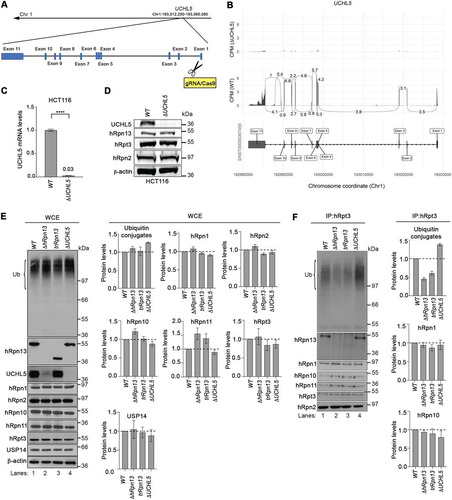
We tested the necessity of hRpn13, UCHL5, and the hRpn13 Pru domain for clearance of ubiquitinated proteins. The bulk level of ubiquitinated proteins was assayed by immunoprobing whole-cell extract from ΔhRpn13, trRpn13, ΔUCHL5, or WT cells with antiubiquitin antibodies. Levels appeared higher for ΔUCHL5 cells than the WT (, left), a trend reproducible over three experiments with quantification by using β-actin as a loading control (, upper right). A slight increase was observed for ΔhRpn13 cells, whereas trRpn13 ubiquitin levels were within the error range of that measured for the WT (). Some fluctuations were observed for RP components, with small reductions for hRpn1 and hRpn10 in ΔUCHL5 cells and a small increase for hRpn10 in ΔhRpn13 cells (). The largest effect was for hRpn11, which was increased for the ΔhRpn13 and trRpn13 cells (). This increase in hRpn11 may be in response to cellular stress initiated by losing hRpn13 activity at the proteasome, as Rpn11 overexpression suppresses age-related reduction of proteasome activity in fruit flies (Citation44).
Proteasome-bound ubiquitinated proteins are reduced in cells with a defective hRpn13 Pru.
We next assessed the impact of losing the hRpn13 Pru domain or UCHL5 at the proteasome. Proteasomes from ΔhRpn13, trRpn13, ΔUCHL5, or WT cells were immunoprecipitated with anti-Rpt3 antibodies and immunoprobed for RP components, including hRpn1, hRpn2, hRpn10, and hRpn11, as well as for the presence of ubiquitinated proteins (). A visible reduction of ubiquitinated proteins was observed for proteasomes from ΔhRpn13 and trRpn13 cells compared to WT and ΔUCHL5 cells (, left, lanes 2 and 3 compared to lanes 1 and 4) that was reproduced over three experiments with normalization to hRpn2 (, upper right). Moreover, ΔUCHL5 proteasomes exhibited a reproducible increase in ubiquitinated proteins compared to the WT (). Similar levels of RP components hRpn1, hRpn2, hRpn10, and hRpn11 were observed across the different cell lines (), with slight reduction in hRpn10 levels for ΔUCHL5. This finding is consistent with the reduced hRpn10 levels in the whole-cell extract (). hRpn10 is required in HCT116 cells for lid-based assembly of the proteasome RP (Citation26); therefore, this result may have implications for the distribution of RP-capped proteasome.
hRpn13 Pru contributes to G1/S transition in HCT116 cells.
Several studies have reported that knockdown or chemical targeting of hRpn13 blocks cellular proliferation (Citation28, Citation29, Citation38, Citation39), and our previous work similarly found knockdown of either hRpn13 or UCHL5 in HeLa cells stalled G1/S cell cycle transition with stabilization of the cell cycle inhibitor p27Kip1 (Citation32). Therefore, we assayed cellular metabolism in the ΔhRpn13, trRpn13, and ΔUCHL5 cell lines compared to the WT. Each cell line was seeded for 48 h, and cellular metabolism measured by an MTT [3-(4,5-dimethylthiazol-2-yl)-2,5-diphenyltetrazolium bromide] assay. We observed slower metabolic activity for all three CRISPR-edited cell lines compared to the WT, particularly for ΔhRpn13 and trRpn13 cells ().
FIG 3 Transient loss of hRpn13 or UCHL5 disrupts cell cycle progression in HCT116 cells. (A) Metabolic activity of WT, ΔhRpn13, trRpn13, or ΔUCHL5 cells measured by MTT assay at 48 h postseeding for the indicated cell density (n = 6). (B) Representative image (top) and plot (bottom) for flow cytometry analyses of WT, ΔhRpn13, trRpn13, or ΔUCHL5 cells from three independent experiments with triplicate repetitions. The cells were seeded at 0.4 million cells per well in 6-well plates for 48 h and subsequently labeled with EdU and propidium iodide. The distribution of cells in G0/G1, S, and G2/M is shown (bottom) by plotting the mean and SEM (error bar) for each cell line. (C) WT cells treated with scrambled control RNA or siRNA targeting hRpn13 (sihRpn13) or UCHL5 (siUCHL5) for 48 h, followed by labeling with EdU and propidium iodide, were subjected to flow cytometry analyses. A representative image (right) and plot (left) for the distribution of cells in G0/G1, S, and G2/M is provided from three independent experiments with triplicate repetitions. The plot indicates the means and SEM (error bars). ***, P < 0.001; ****, P < 0.0001; two-way ANOVA, Dunnett’s post hoc test. (D, left) Lysates from WT, ΔhRpn13, trRpn13, or ΔUCHL5 cells seeded at 0.4 million cells per well in 6-well plates for 48 h were resolved and immunoprobed for p21Cip1, Wee1, p53, hRpn13, UCHL5, or β-actin (as a loading control) as indicated (representative image). (Right) The quantitation of protein levels normalized to β-actin from three independent experiments is displayed. Averaged values are plotted with error bars indicating SEM. ****, P < 0.0001; analyses were done by Student's t test. (E, left) Lysates from WT cells treated with scrambled control RNA or siRNA targeting hRpn13 (sihRpn13) or UCHL5 (siUCHL5) were resolved and immunoprobed as indicated for p21Cip1, Wee1, p53, hRpn13, UCHL5, or β-actin (as a loading control; shown is a representative image). (Right) Quantitation of protein levels normalized to β-actin across three independent experiments. Averaged values are plotted with error bars indicating SEM (****, P < 0.0001; Student's t test).
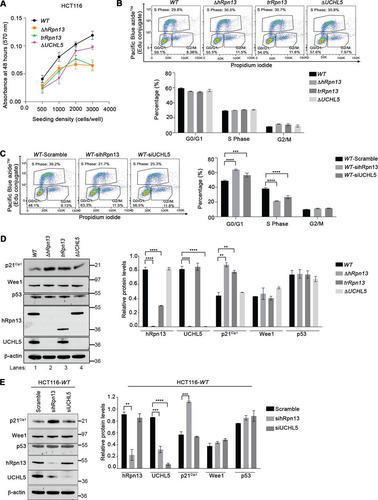
We next used flow cytometry to perform cell cycle profiling for ΔhRpn13, trRpn13, ΔUCHL5, or WT cells by incorporation of 5-ethynyl-2′-deoxyuridine (EdU) and counterstaining with propidium iodide (PI). Based on our findings reported above, we were surprised to observe that there was no statistically significant effect on cell proliferation for these modified cell lines compared to WT cells (). However, we postulated that adaptations occurred to support the loss of hRpn13 or UCHL5 function during the selection process following CRISPR targeting. To address this possibility, we assayed the effect on cell cycle following transient knockdown of these proteins in the parental HCT116 cell line by using targeted siRNA constructs. Consistent with the observation in HeLa cells (Citation32), a significant increase was observed in G0/G1 following hRpn13 or UCHL5 knockdown with a corresponding decrease in S phase, which was reproducible across three independent experiments ().
To investigate these effects further, we immunoprobed lysates from ΔhRpn13, trRpn13, ΔUCHL5, or WT cells for levels of the G0/G1 transition negative regulator p21Cip1 and the G2/M transition negative regulator Wee1 (Citation45). p21Cip1 and not Wee1 levels were stabilized in both ΔhRpn13 and trRpn13 cells compared to WT and ΔUCHL5 cells (). Quantification of p21Cip1 levels for three independent experiments yielded an ∼2-fold increase in both ΔhRpn13 and trRpn13 cells compared to the WT (). We found that this effect is also present following transient knockdown of hRpn13. Specifically, lysates from WT cells treated for 48 h with scramble (as a control) or siRNA against hRpn13 or UCHL5 were immunoprobed for p21Cip1 or Wee1 (). As expected, p21Cip1 but not Wee1 levels were stabilized by hRpn13 knockdown compared to a scrambled control RNA (, left), with the result being reproducible across three independent experiments (, right). No effect was observed for p21Cip1 or Wee1 following knockdown of UCHL5 compared to the scrambled control RNA (). Tumor suppressor p53 transactivates p21Cip1 expression and promotes G1 phase arrest by retarding the transition into or progression through S phase (Citation46, Citation47). Nevertheless, induction of p21Cip1 has been shown to occur independently of p53 expression (Citation48Citation–Citation50). We assayed p53 levels in lysates from WT, ΔhRpn13, trRpn13, or ΔUCHL5 cells by immunoblotting with anti-p53 antibodies. No significant change in p53 level was observed in the CRISPR-edited cell lines compared to the WT (). Similarly, p53 levels were unchanged following hRpn13 or UCHL5 knockdown compared to scrambled control RNA (). These results suggest that activation of p21Cip1 in ΔhRpn13 or trRpn13 cells is not driven by a change in p53 protein levels.
As expected (Citation23, Citation32), knockout or knockdown of hRpn13 caused significant reduction of UCHL5 levels ( and ). In addition, levels of trRpn13 in trRpn13 are reduced compared to WT hRpn13 levels (); however, UCHL5 levels are not altered compared to those of the WT in trRpn13 cells ().
Altogether, our results indicate an associative relationship between hRpn13 and G1/S transition that involves the Rpn13 Pru domain. It is likely that this activity is dependent on hRpn13 Pru domain function at the proteasome and driven by either a general defect in substrate recruitment to the proteasome or stabilization of an hRpn13-dependent subset of substrates.
RA190-induced accumulation of ubiquitinated proteins is attenuated in trRpn13 and not ΔUCHL5.
The hRpn13 Pru domain contains RA190-targeted Cys88 (Citation28) of exon 3 (), which is deleted in trRpn13 (). Therefore, we tested whether RA190-induced accumulation of ubiquitinated proteins is lost in trRpn13 cells. We treated trRpn13 or WT cells for 24 h with 1 μM RA190 or dimethyl sulfoxide (DMSO; as a control) and analyzed the cell lysates for the presence of ubiquitinated proteins by immunoprobing with antiubiquitin antibodies using β-actin as a loading control. As expected (Citation28, Citation29), RA190 induced accumulation of ubiquitinated proteins in cellular lysates from WT cells (, left, lane 1 versus 2) with reproducibility over three independent experiments, with normalizing to β-actin (, right). This bulk increase of ubiquitinated proteins following RA190 treatment is mitigated in trRpn13 cells ( left, lane 4 compared to lane 3), again consistently reproducible in three independent experiments (, right), similar to observations in ΔhRpn13 cells (Citation33).
FIG 4 Loss of hRpn13 Pru, and not UCHL5, attenuates sensitivity at the proteasome to RA190. (A) Ribbon diagram representation of hRpn13 with the missing Pru domain exons (exon 2 and most of exon 3) in yellow, the remaining Pru exon (exon 4) in blue, and the DEUBAD domain and interdomain helix in green. Heavy side chain atoms are displayed for RA190-targeted cysteine 88 (C88, orange) and trRpn13 start site methionine 109 (M109, pink). This image was made by using PDB entry 5IRS. (B and C) Whole-cell extracts (WCE) (B) or immunoprecipitated proteasomes (C) from HCT116 (WT) or trRpn13 cells treated for 24 h with RA190 (1 μM) or DMSO (as a control) were resolved and immunoprobed for ubiquitin (Ub), with β-actin as a loading control (B) or hRpn2 as a positive control (C). The ratio of ubiquitin levels is plotted for the region bracketed from trRpn13 or WT cells normalized first to β-actin (B) or hRpn2 (C) and then to the DMSO control WT. Values are average fold changes ± SEM from three independent experiments. (D and E) WCE (D) or immunoprecipitated proteasomes (E) from WT or ΔUCHL5 cells were resolved and immunoprobed for ubiquitin (Ub), with β-actin as a loading control (D) or hRpt3 as a positive control (E). The ratio of ubiquitin levels is plotted for the region bracketed from ΔUCHL5 or WT cells first normalized to β-actin (D) or hRpt3 (E) and then to the DMSO control WT. Values are average fold changes ± SEM from three independent experiments. Bulk ubiquitin was probed with antiubiquitin antibody (MAB1510; EMD Millipore). Dashed lines are included for the plots in panels B to E at a value of 1.0.
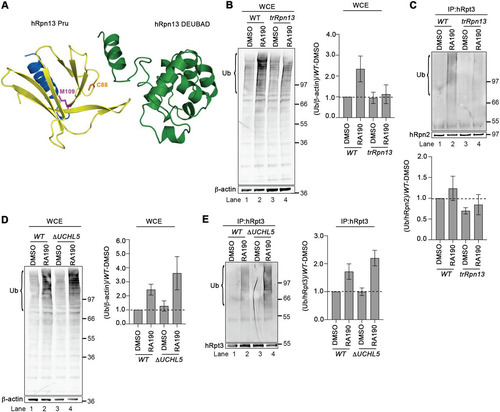
To determine whether RA190 triggers accumulation of ubiquitinated proteins at proteasomes in trRpn13 cells, proteasomes from WT or trRpn13 cells treated for 24 h with 1 μM RA190 or DMSO (vehicle control) were immunoprecipitated by using anti-Rpt3 antibodies. These immunoprecipitates then were assayed for the presence of ubiquitinated proteins by immunoprobing for ubiquitin and hRpn2 as a positive control. Following RA190 treatment, ubiquitinated proteins accumulated at proteasomes from WT cells (, upper, lane 2 versus 1), as quantified by normalizing to hRpn2 (, lower) and as expected (Citation28). RA190-induced accumulation of ubiquitinated proteins at the proteasome was attenuated for trRpn13 cells (, upper, lane 4 versus 3, and bottom). This finding was consistently reproduced in three independent experiments.
We next tested the effect of UCHL5 loss on RA190-induced accumulation of ubiquitinated proteins. We treated ΔUCHL5 or WT cells for 24 h with 1 μM RA190 or DMSO (vehicle control) and analyzed the lysates for the presence of ubiquitinated proteins by immunoprobing with antiubiquitin antibodies and for β-actin as a loading control. RA190 treatment caused increased levels of ubiquitinated proteins in whole-cell extracts from WT and ΔUCHL5 cells (, left, lanes 2 and 4 versus 1 and 3, respectively), as quantified across three independent experiments, with normalizing to β-actin (, right).
To test the impact of UCHL5 loss at the proteasome for RA190-treated cells, we used anti-Rpt3 antibodies to immunoprecipitate proteasomes from ΔUCHL5 or WT cells treated for 24 h with 1 μM RA190 or DMSO. Immunoprobing for ubiquitin revealed an increase of ubiquitinated proteins at the proteasome in RA190-treated WT and ΔUCHL5 cells (, lanes 2 and 4 versus 1 and 3, respectively) across three independent experiments, with normalizing to hRpt3 (, right).
RA190 cytotoxicity is reduced by hRpn13 loss and not by UCHL5 loss.
We next examined how loss of hRpn13, the hRpn13 Pru domain, or UCHL5 impacts cellular response to RA190 treatment. ΔhRpn13, trRpn13, ΔUCHL5, or WT cells were treated with various quantities of RA190 or DMSO (vehicle control), and cellular metabolism was monitored by an MTT assay as described above for . RA190 concentration-dependent metabolic loss was observed in all cell lines (). RA190 demonstrated reduced potency for ΔhRpn13 cells compared to the WT (), consistent with a previous study (Citation29), with a similarly dampened effect for trRpn13 (). The latter finding validates the importance of the Cys88-containing Pru domain. In contrast to trRpn13, ΔUCHL5 cells responded similarly to WT cells following RA190 treatment (). Consistent with the MTT assay, morphological analyses by bright-field microscopy indicated greater detachment and increased numbers of floating cells with membrane blebbing, a hallmark of apoptosis, following RA190 treatment for WT and ΔUCHL5 cells compared to ΔhRpn13 and trRpn13 cells ().
FIG 5 RA190-triggered cell death is reduced in trRpn13 but not UCHL5 cells. (A) Viability of HCT116 (WT), ΔhRpn13, trRpn13, or ΔUCHL5 cells treated for 48 h with the indicated concentration of RA190 or DMSO (as a control), as assessed by MTT assays. (B) WT, ΔhRpn13, trRpn13, or ΔUCHL5 cells were exposed for 24 h to RA190 (1 μM) or DMSO (as a control) and monitored for morphological changes by bright-field microscopy. Arrows indicate blebbing cells undergoing apoptosis. Images shown are representative of two independent experiments (scale bar, 20 μm). (C) WT, ΔhRpn13, trRpn13, or ΔUCHL5 cells treated for 24 h with RA190 (1 μM) or DMSO (as a control) were subjected to flow cytometry analyses after staining with annexin V-FITC and 7-aminoactinomycin D (7-AAD) (representative data are on the left). Population percentage of early and late combined apoptotic or viable cells across three independent experiments is plotted (center) and performed as described for the left. A plot of the ratio of RA190-treated cells to corresponding DMSO control following normalization to the WT is also included for the early apoptotic cell population. The plotted data represent the means and SEM (error bars); *, P < 0.05; ***, P < 0.001; Student's t test. (D) Whole-cell extract from WT, ΔhRpn13, trRpn13, or ΔUCHL5 cells treated for 24 h with RA190 (1 μM), carfilzomib (100 nM), or DMSO (control) was immunoprobed for apoptotic markers caspase 3 (Casp 3) and PARP, hRpn13, UCHL5, or GAPDH (as a loading control; representative image is on the left). Clvd, cleaved. The ratio of cleaved caspase 3 (Clvd-Casp3) to procaspase 3 (Pro-Casp3) or of cleaved PARP (Clvd-PARP) to pro-PARP (Pro-PARP) for RA190- or carfilzomib-treated ΔhRpn13, trRpn13, or ΔUCHL5 cells is plotted normalizing to the respective RA190- or carfilzomib-treated WT cells for three independent experiments, performed as shown on the left. The plotted data represent the means and SEM (error bars). Dashed lines are displayed at a value of 1.0.
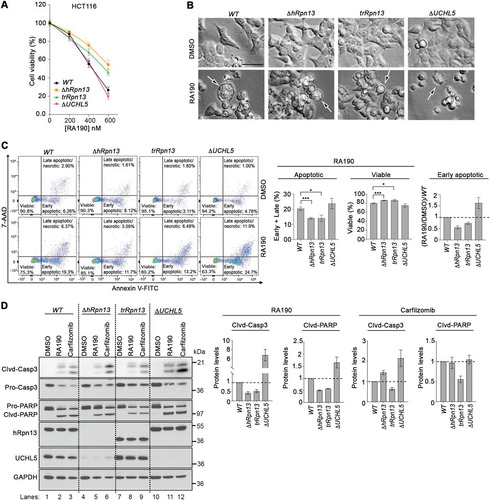
To test more directly the effect of RA190-induced apoptosis in ΔhRpn13, ΔUCHL5, and trRpn13 cells compared to WT cells, flow cytometric detection of apoptosis using annexin V-fluorescein isothiocyanate (FITC) and 7-aminoactinomycin D (7AAD) was performed for each cell line (in triplicate) following 24 h of treatment with 1 μM RA190 or DMSO (vehicle control). We observed a significant decrease in the number of early apoptotic cells for RA190-treated ΔhRpn13 compared to WT cells (P = 0.0002) (), in agreement with previous findings (Citation31), and with a similar effect in trRpn13 cells (P = 0.0167) (). This reduction correlated with an increase in the population of RA190-treated viable cells for both ΔhRpn13 and trRpn13 compared to WT cells (P = 0.0002 and P = 0.0167, respectively) (), which was consistent with the MTT data analyses (). In contrast, while the number of combined early and late apoptotic cells in RA190-treated ΔUCHL5 cells was similar to that of the WT (, middle), an increased population of early apoptotic cells was consistently observed for ΔUCHL5 cells (, right) across three independent experiments.
We further assessed and confirmed the effect of hRpn13 and UCHL5 for RA190-induced apoptosis by examining the status of caspase 3 and poly(ADP) ribose polymerase (PARP). Lysates from ΔhRpn13, trRpn13, ΔUCHL5, or WT cells treated for 24 h with 1 μM RA190, 100 nM carfilzomib (as a positive control), or DMSO (as a vehicle control) were immunoprobed for cleaved caspase 3 or PARP. The ratios of active (cleaved) to nonactive (pro)caspase 3 and PARP were calculated as a measure of apoptosis. As expected (Citation28), relative to WT cells, RA190-treated ΔhRpn13 cells exhibited decreased levels of cleaved caspase 3 and PARP (, lane 5 versus 2) consistently over three independent experiments (). Validating the importance of the hRpn13 Pru domain, this effect was also present in trRpn13 cells (). In contrast, increased levels of cleaved caspase 3 and PARP were observed for RA190-treated ΔUCHL5 cells compared to the WT (, lane 11 versus 2) consistently over three independent experiments (). We also observed an increase in levels of cleaved caspase 3 for carfilzomib-treated ΔUCHL5 compared to WT cells (, lane 12 versus 3), although this effect was not observed for PARP (). ΔhRpn13 cells behaved similarly to ΔUCHL5 cells following carfilzomib treatment (). Based on our cumulative data, we propose that this effect arises from a reduction of UCHL5 levels in this cell line (). In contrast, trRpn13 cells showed reduced effects compared to those of the WT following carfilzomib treatment (, lane 9 versus 3). Again, in consideration of the cumulative data, this effect may be due to reduced load of ubiquitinated proteins at the proteasome () coupled with UCHL5 presence in cells (). Altogether, these data indicate a requirement for hRpn13 and its Pru domain in RA190-induced apoptosis.
DISCUSSION
The proteasome contains multiple receptors for ubiquitinated proteins scattered throughout the RP (Citation51). Our data presented here demonstrate that loss of the hRpn13 Pru domain leads to reduced ubiquitinated proteins at the proteasome, indicating a nonredundant role compared to other RP substrate receptors. Despite the loss of ubiquitinated proteins at proteasomes from trRpn13 and ΔhRpn13 cells, a difference in bulk ubiquitin level was not observed in the whole-cell extract (), perhaps because the loss at the proteasome is compensated by correlative accumulation of ubiquitinated substrates that failed to be recruited or retained at proteasomes for degradation. Nonetheless, the data presented here do not preclude the possibility that loss of hRpn13 Pru enhances degradation efficiency, thereby causing less ubiquitinated substrates to be apparent at proteasomes. Evidence exists in yeast for Rpn13 playing an antagonistic role in an in vitro assay for the degradation of a model ubiquitinated proteasome substrate (Citation52). However, experiments using different substrates in yeast also indicate receptors Rpn1, Rpn10, and Rpn13 are required for substrate-mediated activation of unfolding by the proteasome, with the greatest contribution from Rpn13, which was also found to be required for maximal proteasome processivity (Citation53). In these experiments, mutations that abrogate ubiquitin binding by Rpn13 Pru result in an ∼5-fold reduction of proteasome degradation rate (Citation53).
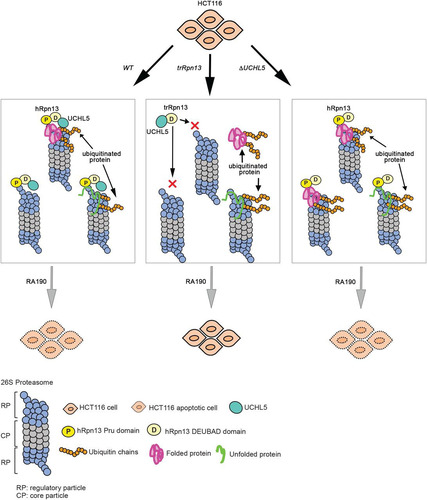
What makes hRpn13 unique? Similar to hRpn1 (Citation5) and hRpn10 (Citation12), hRpn13 prefers K48-linked ubiquitin chains (Citation13), but whereas hRpn1 and hRpn10 have two distinct ubiquitin-binding sites that can bind neighboring ubiquitin moieties of a chain simultaneously (Citation5, Citation54), hRpn13 has only one ubiquitin-binding location (Citation7, Citation8). We recently found that hRpn13 exchanges between the two ubiquitin moieties of K48-linked diubiquitin and maintains an extended conformational state for the ubiquitin chain (Citation55), which would facilitate further interactions with other ubiquitin-binding sites of weaker affinity, such as that in hRpn1. Moreover, hRpn13 is at an apical location of the RP (Citation56Citation–Citation59), which is likely ideal for recruitment of ubiquitinated proteins to the proteasome. Therefore, a reasonable model for reduced ubiquitinated proteins at the proteasome upon hRpn13 Pru domain loss is defective recruitment of ubiquitinated proteins to the proteasome ().
FIG 6 Model summarizing cellular contributions of hRpn13 or UCHL5. Shown is art depicting the impact of hRpn13 Pru domain loss (trRpn13) or UCHL5 loss (ΔUCHL5) on proteasome activity and RA190 targeting. Deletion of the hRpn13 Pru domain (trRpn13) reduces the population of proteasome-bound ubiquitinated proteins (indicated with orange ubiquitin molecules), most likely due to defective recruitment or retention with impact varying depending on substrate ease of unfolding (green or pink represents loosely or more stably folded substrates, respectively). Deletion of UCHL5 (ΔUCHL5) leads to accumulation of ubiquitinated proteins at proteasomes and does not interfere with RA190-triggered cell death.
Extending this model, ubiquitinated substrates must be maintained at the proteasome until the RP ATPase ring engages an unstructured sequence within substrates for initiation of degradation (Citation60Citation–Citation62). Single-molecule experiments have demonstrated degradation by the proteasome to occur over time scales of seconds (Citation60). hRpn13 Pru may play an important role in concert with hRpn1 and hRpn10 to maintain ubiquitinated substrates at the proteasome over the time course needed for substrate unfolding by the ATPase ring. The ubiquitinated proteins captured by our immunoprecipitation experiments may represent such substrates being held for unfolding by the ATPase ring. Future experiments will determine whether there are subsets of substrates, such as those difficult to unfold, with greater requirement for hRpn13, and others, perhaps more loosely folded, for which hRpn10 is sufficient, with little additional need for hRpn13.
Consistent with our previous findings in HeLa cells that implicate hRpn13 and UCHL5 in cell cycle progression (Citation32), transient knockdown of hRpn13 or UCHL5 in HCT116 cells results in G1/S transition arrest. We expect that the cell cycle effects observed following transient loss of hRpn13 or UCHL5 originate from defective clearance of ubiquitinated proteins from cells that is somehow compensated for in the CRISPR-edited cell lines, as described in Results; however, future studies are needed to test this hypothesis. Moreover, as mentioned above, it remains unknown whether the reduction of ubiquitinated proteins at proteasomes following hRpn13 Pru loss represents a broad defect in proteasomal recruitment or a subset of substrates that depend on hRpn13 (). Loss of hRpn13 or its Pru domain was associated with increased hRpn11 protein levels, which may be in response to defective recruitment of ubiquitinated proteins to the proteasome.
RA190-induced apoptosis is associated with caspase induction, endoplasmic reticulum stress, and p53-independent apoptosis (Citation28, Citation29, Citation63). Here, we show that RA190 induction of caspase 3 and PARP cleavage is reduced after loss of the hRpn13 Pru domain, as is the population of apoptotic cells measured by flow cytometry (). This effect is not observed following loss of UCHL5 (). Active caspase 3 is known to undergo rapid turnover mediated by ubiquitin signaling for proteasomal degradation (Citation64, Citation65). Loss of UCHL5 appears to interfere with degradation of targeted proteins ( and ), and this effect perhaps includes active caspase 3, given its increased levels in RA190-treated ΔUCHL5 cells compared to RA190-treated WT. Mammalian UCHL5 and USP14, as well as yeast USP14 ortholog Ubp6, can promote processivity at the proteasome by activating its ATPase activity upon binding of a loosely folded ubiquitinated substrate (Citation66). Altogether, these data suggest that loss of UCHL5 generally impairs substrate processing at the proteasome.
Humans have ∼90 DUBs (Citation67, Citation68), yet the loss of UCHL5 causes ubiquitinated proteins to accumulate sufficiently to be observed in the cell lysate (). Moreover, the proteasome has two other DUBs with unaltered protein levels in ΔUCHL5 cells. Our study indicates UCHL5 plays a nonredundant role in counteracting ubiquitination of proteasome substrates, but it is unclear whether this function occurs at the proteasome, as multiple and diverse cellular activities have been reported for this DUB. In particular, UCHL5 regulates transforming growth factor beta (Citation69, Citation70), Wnt (Citation71), and Hedgehog signaling pathways (Citation72), as well as adipogenesis (Citation73). It is also known to physically interact with INO80 (Citation74), a chromatin remodeling complex involved in transcription (Citation75) and DNA repair (Citation76), and to protect it from degradation (Citation77). UCHL5 functions in these complexes remain to be fully understood but could contribute to the accumulation of ubiquitinated proteins that we observe following its deletion. In ΔhRpn13 cells, UCHL5 protein levels are greatly reduced (), yet proteasomes and whole-cell lysate from these cells exhibit reduced () and unaltered () levels of ubiquitinated proteins, respectively, suggesting that either low levels of UCHL5 are required in cells to overcome the accumulation observed in ΔUCHL5 cells or that the effect requires hRpn13, which is known to activate UCHL5 (Citation22Citation–Citation24).
In conclusion, we demonstrate that the hRpn13 Pru domain and UCHL5 perform unique cellular roles that are not able to be compensated by other cellular factors and impact the clearance of ubiquitinated proteins by the proteasome. These results provide important physiological insights and have translational implications for the molecular targeting of these proteins.
MATERIALS AND METHODS
Cell culture.
HCT116 cells were purchased from the American Tissue Culture Collection (ATCC) (CCL-247); HCT116 ΔhRpn13 cells were a gift from Shigeo Murata (Citation33). All cell lines were grown in McCoy’s 5A modified medium (ATCC), supplemented with 10% fetal bovine serum (Atlanta Biologicals), at 37°C in a humidified environment of 5% CO2.
Gene editing by CRISPR targeting.
Single guide RNAs (sgRNAs) targeting early protein-coding sequence of Rpn13 and UCHL5 were designed using sgRNA Scorer 2.0 (Citation78). Oligonucleotides containing the 20-nucleotide spacer sequence (), along with appropriate 5′ overhangs, were annealed by mixing equal quantities (∼50 pmol) of the forward and reverse oligonucleotides, heating for 2 min at 95°C, and cooling in steps of 5°C for 2-min duration until a final temperature of 25°C. Each pair of annealed oligonucleotides was ligated into the BbsI site of the pX458 plasmid (Citation79). SpCas9(BB)-2A-GFP (pX458) was a gift from Feng Zhang (48138 Addgene plasmid; http://n2t.net/addgene:48138). Ligated plasmids then were transformed into the Stbl3 Escherichia coli strain, and colonies were grown out for large-scale plasmid preparation. Purified plasmids expressing ADRM1 guide 1a and 1b or UCHL5 guide 1a and 1b were cotransfected (∼1 μg) into HCT116 (WT) cells using Lipofectamine LTX (15338030; Thermo Fisher Scientific), and bulk green fluorescent protein-positive cells were then sorted using a flow cytometer and grown for approximately 5 days. After assaying for protein expression by immunoblotting, candidate clones were further subjected to single-cell sorting. Confirmation of gene editing for ADRM1 or UCHL5 was determined by Sanger sequencing, reverse transcription-PCR (RT-PCR), quantitative real-time PCR, and protein expression in whole-cell extract.
TABLE 1 Guide RNAs used for CRISPR/Cas9 gene editing
RNA sequencing.
Three total RNA sample replicates from HCT116 WT, trRpn13, or ΔUCHL5 edited cells were purified by using the RNeasy Plus minikit (74134; Qiagen). RNA samples were pooled and sequenced on one HiSeq run using an Illumina TruSeq stranded total RNA kit (RS-122-2201; Illumina) and paired-end sequencing. Reads of the samples were trimmed for adapters and low-quality bases using Trimmomatic software. Spliced Transcripts Alignment to a Reference (STAR) software (Citation80) was used to align trimmed reads to reference genome hg19. Gene counts were quantified by STAR using annotations from GenCode release 19 (Citation81). Transcript abundance was estimated using RSEM (Citation82) and then normalized using the voom algorithm (Citation83) and used for differential expression analysis using the limma package (version 3.38.3) (Citation84). Data for sashimi plots were generated using a modified version of the Python script provided with ggsashimi (Citation85) and visualized using the ggbio package (version 1.3.0) (Citation86). Genomic annotations for the sashimi plots were accessed using the EnsDb.Hsapiens.v75 package (Citation87). All analyses were performed using Python version 2.7.15 and R version 3.5.1 (Citation88).
RT-PCR.
Total RNA samples from WT or trRpn13 cell lines were purified by using the RNeasy Plus kit (74134; Qiagen). Complementary DNA (cDNA) was synthesized by using the Smarter RACE 5′/3′ kit (634860; Clontech). PCRs were performed with synthesized cDNA as the template, SeqAmp DNA polymerase (638509; Clontech), and PCR buffer (638526; Clontech). Primers for PCR amplification are reported in . Amplified DNA was resolved by 1% agarose gel and visualized with SYBR safe DNA gel stain (S33102; Invitrogen).
TABLE 2 Primer sequences used for PCR experiments
Sanger sequencing of ADRM1 cDNA from trRpn13 and WT cells.
Amplification of full-length ADRM1 cDNA from trRpn13 and WT cell lines was performed with the primers listed in and cDNA generated as described above. Products were then subjected to Sanger sequencing using the same primers, and the data were analyzed by using Geneious Prime 2020.1.2 (https://www.geneious.com).
TABLE 3 Primer sequences for full-length ADRM1 cDNA sequencing
Quantitative real-time PCR.
Total RNA samples from WT or ΔUCHL5 cells were purified by using the RNeasy Plus minikit (74134; Qiagen), and cDNA was synthesized with the Superscript III first-strand synthesis system (18080051; Thermo Fisher Scientific) according to the manufacturer’s instructions. UCHL5 and β-actin mRNA expression was measured on a quantitative RT-PCR (CFX384; Bio-Rad) instrument using TaqMan probes for UCHL5 (Hs01044470_m1; Thermo Fisher Scientific) and β-actin (Hs01060665_g1; Thermo Fisher Scientific). β-Actin was used as an internal standard. Fold change in gene expression normalized to the WT was calculated using the 2–ΔΔCT method (Citation89).
Crosslink-coupled immunoprecipitation.
Cells were washed with PBS, followed by a 30-min incubation with freshly prepared 0.5 mM 3,3′-dithiodipropionic acid di(N-hydroxysuccinimide ester) (DSP; 22585; Thermo Fisher Scientific). The DSP cross-linking reaction was quenched by a 15-min incubation with 20 mM Tris-HCl, pH 7.5. Cells were then collected, washed with PBS, lysed in radioimmunoprecipitation assay (RIPA) buffer (89901; Thermo Fisher Scientific) supplemented with a protease inhibitor cocktail (25765800; Roche), and briefly sonicated. Following a 30-min agitation at 4°C, cellular debris was removed by spinning at 16,000 × g. Protein concentration was determined by a bicinchoninic acid (BCA) protein assay kit (23227; Thermo Fisher Scientific). For immunoprecipitation (IP), lysates (∼1 mg total protein) were incubated overnight at 4°C with anti-Rpn13 antibodies, followed by a 3-h incubation with protein G-Sepharose (P3296-5ML; Sigma). The beads were washed with RIPA buffer, and bound proteins were resolved and visualized by SDS-PAGE and immunoblotting. A total of three independent experiments were performed.
Immunoblotting and immunoprecipitation.
WT, ΔhRpn13, trRpn13, and ΔUCHL5 cells were scraped, collected, and washed with PBS, followed by lysing in native IP buffer (1% Triton X-100, 50 mM Tris-HCl [pH 7.5], 150 mM NaCl) supplemented with protease inhibitor cocktail (25765800; Roche). Lysates were spun for 10 min at 4°C and 16,000 × g to remove cellular debris. Protein concentration was determined by a Pierce 660-nm protein assay reagent kit (22660; Thermo Fisher Scientific), and immunoblotting of cell lysates done with 10 to 20 μg of total protein. For Rpt3 immunoprecipitation, lysates (1 mg total protein) were incubated overnight at 4°C with anti-Rpt3 antibodies, followed by a 3-h incubation with protein G-Sepharose (P3295-5ML; Sigma) or Dynabead protein G (10004; Thermo Fisher Scientific). The beads were washed with native IP buffer, and bound proteins were resolved and visualized by SDS-PAGE. Immunoblotting was done by overnight incubation with primary antibodies in 5% skim milk (LP0031B; Thermo Fisher Scientific) made in Tris-buffered saline with 0.1% Tween 20 (TBST), washing, and then an hour of incubation with secondary antibodies. After washing and drying, blots were detected by an Amersham Typhoon 5 scanner (GE) for infrared-tagged secondary antibodies or by addition of Pierce ECL chemiluminescent substrates (32106; Thermo Fisher Scientific) for horseradish peroxidase (HRP)-conjugated secondary antibodies. A total of three independent experiments were performed.
siRNA knockdown experiments.
HCT116 WT cells were transfected for 48 h with 50 nM commercially available ON-TARGET plus siRNA against hRpn13 (LQ-012340-01-0005; Dharmacon) or UCHL5 (LQ-006060-00-0005; Dharmacon) or with a scrambled nontargeting pool siRNA as a negative control (D-001810-10-05, Dharmacon). Knockdown experiments were performed using Lipofectamine 3000 reagent (L3000015; Thermo Fisher Scientific) with Opti-MEM (31985070; Life Technologies) reduced serum medium according to the manufacturer’s instructions.
Antibodies for immunoblotting and immunoprecipitation.
Antibodies used include anti-Rpn13, anti-Rpt3, anti-Rpn2 (ab157185, ab140515, and ab2941, respectively; Abcam), anti-UCHL5 (AM2200a; Abgent), antiubiquitin (MAB1510; EMD Millipore), antiubiquitin/P4D1 (3936; Cell Signaling Technology), anti-Rpn1, anti-Rpn11, anti-USP14, anti-p53, anti-p21Cip1, anti-Wee1, anti-β-actin (25430, 4197, 11931, 9282, 2947, 13084, and 4970, respectively; Cell Signaling Technology), anti-Rpn10 (NBP2-19952, Novus biologicals), and anti-GAPDH (G8795; Sigma). Secondary antibodies used in this study include HRP-conjugated rabbit (A4914; Sigma or 31463; Thermo Fisher Scientific) or mouse (A9917; Sigma) antibody or IRDye 680LT (mouse or rabbit) and IRDye 800CW (mouse or rabbit) (LiCor).
Cell cycle assay.
Forty-eight hours after seeding in 6-well plates at a density of 0.4 million cells per well, WT, ΔhRpn13, trRpn13, or ΔUCHL5 cells were incubated for 2 h at 37°C and 5% CO2 humidity with 10 μM 5-ethynyl-2′-deoxyuridine (EdU). Cells then were harvested and stained according to the instructions of the manufacturer (Click-iT EdU flow cytometry assay kit; C10418; Invitrogen) and counterstained with propidium iodide/RNase staining solution (R37108; Invitrogen). Cells were analyzed by flow cytometry by using a BD FACSCanto II flow cytometer (BD Biosciences). Specifically, intact cells were gated using forward scatter-area (FSC-A) and side scatter-area (SSC-A) parameters to exclude debris from the evaluated events. The data were further gated for doublet discrimination by using first FSC-A and then forward scatter-height (FSC-H) parameters. Doublet events were further excluded with PE-W (width) by PE-H (height) parameters. Debris and doublet exclusion were performed with consistent gating applied to all samples within each experiment. A total of three independent experiments were performed and analyzed with FlowJo (version 10.6.0; BD Biosciences).
RA190 and carfilzomib treatment.
RA190 or carfilzomib dissolved in dimethyl sulfoxide (DMSO) was used to treat cells, as indicated, at 1 μM or 100 nM, respectively. An equal volume of DMSO was used as a negative control.
Metabolic and cell viability assays.
For metabolic activity analysis, WT, ΔhRpn13, trRpn13, or ΔUCHL5 cells were seeded at increasing cell density as indicated. Forty-eight hours later, metabolic activity was measured by MTT assay (M6494; Invitrogen). Briefly, MTT solution was added to cells for 3 h at 37°C, 5% CO2 and then solubilized with 100% DMSO for 2 h at room temperature before measurement at 570 nm. To measure RA190 effects, WT, ΔhRpn13, trRpn13, or ΔUCHL5 cells were treated with increasing concentrations of RA190 or DMSO (vehicle control) for 48 h. Cell viability then was measured by the MTT assay. A total of three independent experiments were performed.
Apoptosis assay.
WT, ΔhRpn13, trRpn13, or ΔUCHL5 cells were treated as indicated, and apoptosis was measured by an FITC-annexin V apoptosis detection kit with 7AAD (640922; BioLegend, Inc.). Cells were analyzed by flow cytometry on a BD LSRFortessa flow cytometer (BD Biosciences). Specifically, events were gated to exclude debris, based on FSC-A and SSC-A parameters, but to include apoptotic cells. This gating was followed by the exclusion of event doublets by FSC-A and FSC-H parameters. Eradication of spectral overlap was confirmed by using single-fluorochrome-stained control samples, and region gating was determined based on single-color fluorochrome and negative-control samples. Following acquisition, .fcs data files were analyzed by FlowJo software (BD Biosciences), with identical region and gating applied to all samples. A total of three independent experiments were performed.
Statistical analyses.
Protein band densities of immunoblots were quantified with Image Studio Lite (LiCor Biosciences software). Unless otherwise indicated, protein signal was normalized in two steps, first to the loading (β-actin or GAPDH) or positive (hRpn2) control protein and then to the control group (WT or WT DMSO). GraphPad Prism 8 was used to plot graphs as average fold changes ± standard errors of the means (SEM) for at least three independent experiments. Statistical significance with a P value of <0.05 was assayed by Student's t test and for comparisons among groups with three biological replicates by two-way analysis of variance (ANOVA) with Dunnett’s post hoc test.
ACKNOWLEDGMENTS
We are grateful to Gwen Buel, Hiroshi Matsuo, and Brandon Wright for critical reading of the manuscript. Sequencing was conducted at the Frederick National Laboratory for Cancer Research (FNLCR) at the CCR Sequencing Facility, and flow cytometry analysis was performed at the CCR Frederick Flow Core, NCI, NIH, Frederick, MD.
This work was supported by the Intramural Research Program through the CCR, NCI, and NIH (1 ZIA BC011490).
K.J.W. and V.O.-A. conceptualized the research. K.J.W., V.O.-A., V.S., and R.C. designed the experiments and, together with M.T., J.L., and C.N.E., analyzed the data. K.T.C. sorted cells by FACS (fluorescence-activated cell sorting). K.K. analyzed flow cytometry data. All other experiments were done by V.O.-A. and V.S. All authors contributed to writing the manuscript.
REFERENCES
- Finley D, Chen X, Walters KJ. 2016. Gates, channels, and switches: elements of the proteasome machine. Trends Biochem Sci 41:77–93. https://doi.org/10.1016/j.tibs.2015.10.009.
- Liu F, Walters KJ. 2010. Multitasking with ubiquitin through multivalent interactions. Trends Biochem Sci 35:352–360. https://doi.org/10.1016/j.tibs.2010.01.002.
- Dikic I, Wakatsuki S, Walters KJ. 2009. Ubiquitin-binding domains—from structures to functions. Nat Rev Mol Cell Biol 10:659–671. https://doi.org/10.1038/nrm2767.
- Ehlinger A, Walters KJ. 2013. Structural insights into proteasome activation by the 19S regulatory particle. Biochemistry 52:3618–3628. https://doi.org/10.1021/bi400417a.
- Shi Y, Chen X, Elsasser S, Stocks BB, Tian G, Lee BH, Shi Y, Zhang N, de Poot SA, Tuebing F, Sun S, Vannoy J, Tarasov SG, Engen JR, Finley D, Walters KJ. 2016. Rpn1 provides adjacent receptor sites for substrate binding and deubiquitination by the proteasome. Science 351:aad9421. https://doi.org/10.1126/science.aad9421.
- Young P, Deveraux Q, Beal RE, Pickart CM, Rechsteiner M. 1998. Characterization of two polyubiquitin binding sites in the 26 S protease subunit 5a. J Biol Chem 273:5461–5467. https://doi.org/10.1074/jbc.273.10.5461.
- Schreiner P, Chen X, Husnjak K, Randles L, Zhang N, Elsasser S, Finley D, Dikic I, Walters KJ, Groll M. 2008. Ubiquitin docking at the proteasome through a novel pleckstrin-homology domain interaction. Nature 453:548–552. https://doi.org/10.1038/nature06924.
- Husnjak K, Elsasser S, Zhang N, Chen X, Randles L, Shi Y, Hofmann K, Walters KJ, Finley D, Dikic I. 2008. Proteasome subunit Rpn13 is a novel ubiquitin receptor. Nature 453:481–488. https://doi.org/10.1038/nature06926.
- Hiyama H, Yokoi M, Masutani C, Sugasawa K, Maekawa T, Tanaka K, Hoeijmakers JH, Hanaoka F. 1999. Interaction of hHR23 with S5a. The ubiquitin-like domain of hHR23 mediates interaction with S5a subunit of 26 S proteasome. J Biol Chem 274:28019–28025. https://doi.org/10.1074/jbc.274.39.28019.
- Walters KJ, Kleijnen MF, Goh AM, Wagner G, Howley PM. 2002. Structural studies of the interaction between ubiquitin family proteins and proteasome subunit S5a. Biochemistry 41:1767–1777. https://doi.org/10.1021/bi011892y.
- Elsasser S, Gali RR, Schwickart M, Larsen CN, Leggett DS, Muller B, Feng MT, Tubing F, Dittmar GA, Finley D. 2002. Proteasome subunit Rpn1 binds ubiquitin-like protein domains. Nat Cell Biol 4:725–730. https://doi.org/10.1038/ncb845.
- Chen X, Ebelle DL, Wright BJ, Sridharan V, Hooper E, Walters KJ. 2019. Structure of hRpn10 bound to UBQLN2 UBL illustrates basis for complementarity between shuttle factors and substrates at the proteasome. J Mol Biol 431:939–955. https://doi.org/10.1016/j.jmb.2019.01.021.
- Chen X, Randles L, Shi K, Tarasov SG, Aihara H, Walters KJ. 2016. Structures of Rpn1 T1:Rad23 and hRpn13:hPLIC2 reveal distinct binding mechanisms between substrate receptors and shuttle factors of the proteasome. Structure 24:1257–1270. https://doi.org/10.1016/j.str.2016.05.018.
- Collins GA, Goldberg AL. 2020. Proteins containing ubiquitin-like (Ubl) domains not only bind to 26S proteasomes but also induce their activation. Proc Natl Acad Sci U S A 117:4664–4674. https://doi.org/10.1073/pnas.1915534117.
- Lam YA, Xu W, DeMartino GN, Cohen RE. 1997. Editing of ubiquitin conjugates by an isopeptidase in the 26S proteasome. Nature 385:737–740. https://doi.org/10.1038/385737a0.
- Leggett DS, Hanna J, Borodovsky A, Crosas B, Schmidt M, Baker RT, Walz T, Ploegh H, Finley D. 2002. Multiple associated proteins regulate proteasome structure and function. Mol Cell 10:495–507. https://doi.org/10.1016/s1097-2765(02)00638-x.
- Borodovsky A, Kessler BM, Casagrande R, Overkleeft HS, Wilkinson KD, Ploegh HL. 2001. A novel active site-directed probe specific for deubiquitylating enzymes reveals proteasome association of USP14. EMBO J 20:5187–5196. https://doi.org/10.1093/emboj/20.18.5187.
- Verma R, Chen S, Feldman R, Schieltz D, Yates J, Dohmen J, Deshaies RJ. 2000. Proteasomal proteomics: identification of nucleotide-sensitive proteasome-interacting proteins by mass spectrometric analysis of affinity-purified proteasomes. Mol Biol Cell 11:3425–3439. https://doi.org/10.1091/mbc.11.10.3425.
- Verma R, Aravind L, Oania R, McDonald WH, Yates JR, III, Koonin EV, Deshaies RJ. 2002. Role of Rpn11 metalloprotease in deubiquitination and degradation by the 26S proteasome. Science 298:611–615. https://doi.org/10.1126/science.1075898.
- Yao T, Cohen RE. 2002. A cryptic protease couples deubiquitination and degradation by the proteasome. Nature 419:403–407. https://doi.org/10.1038/nature01071.
- Lee MJ, Lee BH, Hanna J, King RW, Finley D. 2011. Trimming of ubiquitin chains by proteasome-associated deubiquitinating enzymes. Mol Cell Proteomics 10:e003871. https://doi.org/10.1074/mcp.R110.003871.
- Qiu XB, Ouyang SY, Li CJ, Miao S, Wang L, Goldberg AL. 2006. hRpn13/ADRM1/GP110 is a novel proteasome subunit that binds the deubiquitinating enzyme, UCH37. EMBO J 25:5742–5753. https://doi.org/10.1038/sj.emboj.7601450.
- Hamazaki J, Iemura S, Natsume T, Yashiroda H, Tanaka K, Murata S. 2006. A novel proteasome interacting protein recruits the deubiquitinating enzyme UCH37 to 26S proteasomes. EMBO J 25:4524–4536. https://doi.org/10.1038/sj.emboj.7601338.
- Yao T, Song L, Xu W, DeMartino GN, Florens L, Swanson SK, Washburn MP, Conaway RC, Conaway JW, Cohen RE. 2006. Proteasome recruitment and activation of the Uch37 deubiquitinating enzyme by Adrm1. Nat Cell Biol 8:994–1002. https://doi.org/10.1038/ncb1460.
- Jorgensen JP, Lauridsen AM, Kristensen P, Dissing K, Johnsen AH, Hendil KB, Hartmann-Petersen R. 2006. Adrm1, a putative cell adhesion regulating protein, is a novel proteasome-associated factor. J Mol Biol 360:1043–1052. https://doi.org/10.1016/j.jmb.2006.06.011.
- Buel GR, Chen X, Chari R, O’Neill MJ, Ebelle DL, Jenkins C, Sridharan V, Tarasov SG, Tarasova NI, Andresson T, Walters KJ. 2020. Structure of E3 ligase E6AP with a novel proteasome-binding site provided by substrate receptor hRpn10. Nat Commun 11:1291. https://doi.org/10.1038/s41467-020-15073-7.
- Cromm PM, Crews CM. 2017. The proteasome in modern drug discovery: second life of a highly valuable drug target. ACS Cent Sci 3:830–838. https://doi.org/10.1021/acscentsci.7b00252.
- Anchoori RK, Karanam B, Peng S, Wang JW, Jiang R, Tanno T, Orlowski RZ, Matsui W, Zhao M, Rudek MA, Hung CF, Chen X, Walters KJ, Roden RB. 2013. A bis-benzylidine piperidone targeting proteasome ubiquitin receptor RPN13/ADRM1 as a therapy for cancer. Cancer Cell 24:791–805. https://doi.org/10.1016/j.ccr.2013.11.001.
- Song Y, Ray A, Li S, Das DS, Tai YT, Carrasco RD, Chauhan D, Anderson KC. 2016. Targeting proteasome ubiquitin receptor Rpn13 in multiple myeloma. Leukemia 30:1877–1886. https://doi.org/10.1038/leu.2016.97.
- Trader DJ, Simanski S, Kodadek T. 2015. A reversible and highly selective inhibitor of the proteasomal ubiquitin receptor rpn13 is toxic to multiple myeloma cells. J Am Chem Soc 137:6312–6319. https://doi.org/10.1021/jacs.5b02069.
- Anchoori RK, Jiang R, Peng S, Soong RS, Algethami A, Rudek MA, Anders N, Hung CF, Chen X, Lu X, Kayode O, Dyba M, Walters KJ, Roden R. 2018. Covalent Rpn13-binding inhibitors for the treatment of ovarian cancer. ACS Omega 3:11917–11929. https://doi.org/10.1021/acsomega.8b01479.
- Randles L, Anchoori RK, Roden RB, Walters KJ. 2016. The proteasome ubiquitin receptor hRpn13 and its interacting deubiquitinating enzyme Uch37 are required for proper cell cycle progression. J Biol Chem 291:8773–8783. https://doi.org/10.1074/jbc.M115.694588.
- Lu X, Nowicka U, Sridharan V, Liu F, Randles L, Hymel D, Dyba M, Tarasov SG, Tarasova NI, Zhao XZ, Hamazaki J, Murata S, Burke TR, Walters KJ. 2017. Structure of the Rpn13-Rpn2 complex provides insights for Rpn13 and Uch37 as anticancer targets. Nat Commun 8:15540. https://doi.org/10.1038/ncomms15540.
- Lu X, Liu F, Durham SE, Tarasov SG, Walters KJ. 2015. A high affinity hRpn2-derived peptide that displaces human Rpn13 from proteasome in 293T cells. PLoS One 10:e0140518. https://doi.org/10.1371/journal.pone.0140518.
- Sanchez-Pulido L, Kong L, Ponting CP. 2012. A common ancestry for BAP1 and Uch37 regulators. Bioinformatics 28:1953–1956. https://doi.org/10.1093/bioinformatics/bts319.
- Chen X, Lee BH, Finley D, Walters KJ. 2010. Structure of proteasome ubiquitin receptor hRpn13 and its activation by the scaffolding protein hRpn2. Mol Cell 38:404–415. https://doi.org/10.1016/j.molcel.2010.04.019.
- Fejzo MS, Anderson L, von Euw EM, Kalous O, Avliyakulov NK, Haykinson MJ, Konecny GE, Finn RS, Slamon DJ. 2013. Amplification target ADRM1: role as an oncogene and therapeutic target for ovarian cancer. Int J Mol Sci 14:3094–3109. https://doi.org/10.3390/ijms14023094.
- Chen W, Hu XT, Shi QL, Zhang FB, He C. 2009. Knockdown of the novel proteasome subunit Adrm1 located on the 20q13 amplicon inhibits colorectal cancer cell migration, survival and tumorigenicity. Oncol Rep 21:531–537.
- Zheng X, Guo Y, Chen Y, Chen M, Lin Z, Wu Y, Chen Y. 2015. Knockdown of adhesion-regulating molecule 1 inhibits proliferation in HL60 cells. Acta Haematol 134:88–100. https://doi.org/10.1159/000369916.
- Jang SH, Park JW, Kim HR, Seong JK, Kim HK. 2014. ADRM1 gene amplification is a candidate driver for metastatic gastric cancers. Clin Exp Metastasis 31:727–733. https://doi.org/10.1007/s10585-014-9663-4.
- Al-Shami A, Jhaver KG, Vogel P, Wilkins C, Humphries J, Davis JJ, Xu N, Potter DG, Gerhardt B, Mullinax R, Shirley CR, Anderson SJ, Oravecz T. 2010. Regulators of the proteasome pathway, Uch37 and Rpn13, play distinct roles in mouse development. PLoS One 5:e13654. https://doi.org/10.1371/journal.pone.0013654.
- Hamazaki J, Hirayama S, Murata S. 2015. Redundant roles of Rpn10 and Rpn13 in recognition of ubiquitinated proteins and cellular homeostasis. PLoS Genet 11:e1005401. https://doi.org/10.1371/journal.pgen.1005401.
- VanderLinden RT, Hemmis CW, Yao T, Robinson H, Hill CP. 2017. Structure and energetics of pairwise interactions between proteasome subunits RPN2, RPN13, and ubiquitin clarify a substrate recruitment mechanism. J Biol Chem 292:9493–9504. https://doi.org/10.1074/jbc.M117.785287.
- Tonoki A, Kuranaga E, Tomioka T, Hamazaki J, Murata S, Tanaka K, Miura M. 2009. Genetic evidence linking age-dependent attenuation of the 26S proteasome with the aging process. Mol Cell Biol 29:1095–1106. https://doi.org/10.1128/MCB.01227-08.
- Niculescu AB, Chen X, Smeets M, Hengst L, Prives C, Reed SI. 1998. Effects of p21(Cip1/Waf1) at both the G1/S and the G2/M cell cycle transitions: pRb is a critical determinant in blocking DNA replication and in preventing endoreduplication. Mol Cell Biol 18:629–643. https://doi.org/10.1128/mcb.18.1.629.
- Waldman T, Kinzler KW, Vogelstein B. 1995. p21 is necessary for the p53-mediated G1 arrest in human cancer cells. Cancer Res 55:5187–5190.
- el-Deiry WS, Tokino T, Velculescu VE, Levy DB, Parsons R, Trent JM, Lin D, Mercer WE, Kinzler KW, Vogelstein B. 1993. WAF1, a potential mediator of p53 tumor suppression. Cell 75:817–825. https://doi.org/10.1016/0092-8674(93)90500-p.
- Zeng YX, el-Deiry WS. 1996. Regulation of p21WAF1/CIP1 expression by p53-independent pathways. Oncogene 12:1557–1564.
- Macleod KF, Sherry N, Hannon G, Beach D, Tokino T, Kinzler K, Vogelstein B, Jacks T. 1995. p53-dependent and independent expression of p21 during cell growth, differentiation, and DNA damage. Genes Dev 9:935–944. https://doi.org/10.1101/gad.9.8.935.
- Jiang H, Lin J, Su ZZ, Collart FR, Huberman E, Fisher PB. 1994. Induction of differentiation in human promyelocytic HL-60 leukemia cells activates p21, WAF1/CIP1, expression in the absence of p53. Oncogene 9:3397–3406.
- Greene ER, Dong KC, Martin A. 2020. Understanding the 26S proteasome molecular machine from a structural and conformational dynamics perspective. Curr Opin Struct Biol 61:33–41. https://doi.org/10.1016/j.sbi.2019.10.004.
- Martinez-Fonts K, Davis C, Tomita T, Elsasser S, Nager AR, Shi Y, Finley D, Matouschek A. 2020. The proteasome 19S cap and its ubiquitin receptors provide a versatile recognition platform for substrates. Nat Commun 11:477. https://doi.org/10.1038/s41467-019-13906-8.
- Cundiff MD, Hurley CM, Wong JD, Boscia JA, Bashyal A, Rosenberg J, Reichard EL, Nassif ND, Brodbelt JS, Kraut DA. 2019. Ubiquitin receptors are required for substrate-mediated activation of the proteasome's unfolding ability. Sci Rep 9:14506. https://doi.org/10.1038/s41598-019-50857-y.
- Zhang N, Wang Q, Ehlinger A, Randles L, Lary JW, Kang Y, Haririnia A, Storaska AJ, Cole JL, Fushman D, Walters KJ. 2009. Structure of the s5a:k48-linked diubiquitin complex and its interactions with rpn13. Mol Cell 35:280–290. https://doi.org/10.1016/j.molcel.2009.06.010.
- Lu X, Ebelle DL, Matsuo H, Walters KJ. 2020. An extended conformation for K48 ubiquitin chains revealed by the hRpn2:Rpn13:K48-diubiquitin structure. Structure 28:495–506. https://doi.org/10.1016/j.str.2020.02.007.
- Sakata E, Bohn S, Mihalache O, Kiss P, Beck F, Nagy I, Nickell S, Tanaka K, Saeki Y, Förster F, Baumeister W. 2012. Localization of the proteasomal ubiquitin receptors Rpn10 and Rpn13 by electron cryomicroscopy. Proc Natl Acad Sci U S A 109:1479–1484. https://doi.org/10.1073/pnas.1119394109.
- Dambacher CM, Worden EJ, Herzik MA, Martin A, Lander GC. 2016. Atomic structure of the 26S proteasome lid reveals the mechanism of deubiquitinase inhibition. Elife 5:e13027. https://doi.org/10.7554/eLife.13027.
- Lasker K, Förster F, Bohn S, Walzthoeni T, Villa E, Unverdorben P, Beck F, Aebersold R, Sali A, Baumeister W. 2012. Molecular architecture of the 26S proteasome holocomplex determined by an integrative approach. Proc Natl Acad Sci U S A 109:1380–1387. https://doi.org/10.1073/pnas.1120559109.
- Chen S, Wu J, Lu Y, Ma YB, Lee BH, Yu Z, Ouyang Q, Finley DJ, Kirschner MW, Mao Y. 2016. Structural basis for dynamic regulation of the human 26S proteasome. Proc Natl Acad Sci U S A 113:12991–12996. https://doi.org/10.1073/pnas.1614614113.
- Bard JAM, Bashore C, Dong KC, Martin A. 2019. The 26S proteasome utilizes a kinetic gateway to prioritize substrate degradation. Cell 177:286–298. https://doi.org/10.1016/j.cell.2019.02.031.
- Yu H, Kago G, Yellman CM, Matouschek A. 2016. Ubiquitin-like domains can target to the proteasome but proteolysis requires a disordered region. EMBO J 35:1522–1536. https://doi.org/10.15252/embj.201593147.
- Henderson A, Erales J, Hoyt MA, Coffino P. 2011. Dependence of proteasome processing rate on substrate unfolding. J Biol Chem 286:17495–17502. https://doi.org/10.1074/jbc.M110.212027.
- Chen S, Blank JL, Peters T, Liu XJ, Rappoli DM, Pickard MD, Menon S, Yu J, Driscoll DL, Lingaraj T, Burkhardt AL, Chen W, Garcia K, Sappal DS, Gray J, Hales P, Leroy PJ, Ringeling J, Rabino C, Spelman JJ, Morgenstern JP, Lightcap ES. 2010. Genome-wide siRNA screen for modulators of cell death induced by proteasome inhibitor bortezomib. Cancer Res 70:4318–4326. https://doi.org/10.1158/0008-5472.CAN-09-4428.
- Suzuki Y, Nakabayashi Y, Takahashi R. 2001. Ubiquitin-protein ligase activity of X-linked inhibitor of apoptosis protein promotes proteasomal degradation of caspase-3 and enhances its anti-apoptotic effect in Fas-induced cell death. Proc Natl Acad Sci U S A 98:8662–8667. https://doi.org/10.1073/pnas.161506698.
- Tawa P, Hell K, Giroux A, Grimm E, Han Y, Nicholson DW, Xanthoudakis S. 2004. Catalytic activity of caspase-3 is required for its degradation: stabilization of the active complex by synthetic inhibitors. Cell Death Differ 11:439–447. https://doi.org/10.1038/sj.cdd.4401360.
- Peth A, Kukushkin N, Bossé M, Goldberg AL. 2013. Ubiquitinated proteins activate the proteasomal ATPases by binding to Usp14 or Uch37 homologs. J Biol Chem 288:7781–7790. https://doi.org/10.1074/jbc.M112.441907.
- Ventii KH, Wilkinson KD. 2008. Protein partners of deubiquitinating enzymes. Biochem J 414:161–175. https://doi.org/10.1042/BJ20080798.
- Nijman SM, Luna-Vargas MP, Velds A, Brummelkamp TR, Dirac AM, Sixma TK, Bernards R. 2005. A genomic and functional inventory of deubiquitinating enzymes. Cell 123:773–786. https://doi.org/10.1016/j.cell.2005.11.007.
- Wicks SJ, Haros K, Maillard M, Song L, Cohen RE, Dijke PT, Chantry A. 2005. The deubiquitinating enzyme UCH37 interacts with Smads and regulates TGF-beta signalling. Oncogene 24:8080–8084. https://doi.org/10.1038/sj.onc.1208944.
- Wicks SJ, Grocott T, Haros K, Maillard M, ten Dijke P, Chantry A. 2006. Reversible ubiquitination regulates the Smad/TGF-beta signalling pathway. Biochem Soc Trans 34:761–763. https://doi.org/10.1042/BST0340761.
- Han W, Lee H, Han JK. 2017. Ubiquitin C-terminal hydrolase37 regulates Tcf7 DNA binding for the activation of Wnt signalling. Sci Rep 7:42590. https://doi.org/10.1038/srep42590.
- Zhou Z, Yao X, Pang S, Chen P, Jiang W, Shan Z, Zhang Q. 2018. The deubiquitinase UCHL5/UCH37 positively regulates Hedgehog signaling by deubiquitinating Smoothened. J Mol Cell Biol 10:243–257. https://doi.org/10.1093/jmcb/mjx036.
- van Beekum O, Gao Y, Berger R, Koppen A, Kalkhoven E. 2012. A novel RNAi lethality rescue screen to identify regulators of adipogenesis. PLoS One 7:e37680. https://doi.org/10.1371/journal.pone.0037680.
- Yao T, Song L, Jin J, Cai Y, Takahashi H, Swanson SK, Washburn MP, Florens L, Conaway RC, Cohen RE, Conaway JW. 2008. Distinct modes of regulation of the Uch37 deubiquitinating enzyme in the proteasome and in the Ino80 chromatin-remodeling complex. Mol Cell 31:909–917. https://doi.org/10.1016/j.molcel.2008.08.027.
- Cai Y, Jin J, Yao T, Gottschalk AJ, Swanson SK, Wu S, Shi Y, Washburn MP, Florens L, Conaway RC, Conaway JW. 2007. YY1 functions with INO80 to activate transcription. Nat Struct Mol Biol 14:872–874. https://doi.org/10.1038/nsmb1276.
- Wu S, Shi Y, Mulligan P, Gay F, Landry J, Liu H, Lu J, Qi HH, Wang W, Nickoloff JA, Wu C, Shi Y. 2007. A YY1-INO80 complex regulates genomic stability through homologous recombination-based repair. Nat Struct Mol Biol 14:1165–1172. https://doi.org/10.1038/nsmb1332.
- Nishi R, Wijnhoven P, Le Sage C, Tjeertes J, Galanty Y, Forment JV, Clague MJ, Urbé S, Jackson SP. 2014. Systematic characterization of deubiquitylating enzymes for roles in maintaining genome integrity. Nat Cell Biol 16:1016–1026. 1011–1018. https://doi.org/10.1038/ncb3028.
- Chari R, Yeo NC, Chavez A, Church GM. 2017. sgRNA Scorer 2.0: a species-independent model to predict CRISPR/Cas9 activity. ACS Synth Biol 6:902–904. https://doi.org/10.1021/acssynbio.6b00343.
- Ran FA, Hsu PD, Wright J, Agarwala V, Scott DA, Zhang F. 2013. Genome engineering using the CRISPR-Cas9 system. Nat Protoc 8:2281–2308. https://doi.org/10.1038/nprot.2013.143.
- Dobin A, Davis CA, Schlesinger F, Drenkow J, Zaleski C, Jha S, Batut P, Chaisson M, Gingeras TR. 2013. STAR: ultrafast universal RNA-seq aligner. Bioinformatics 29:15–21. https://doi.org/10.1093/bioinformatics/bts635.
- Harrow J, Frankish A, Gonzalez JM, Tapanari E, Diekhans M, Kokocinski F, Aken BL, Barrell D, Zadissa A, Searle S, Barnes I, Bignell A, Boychenko V, Hunt T, Kay M, Mukherjee G, Rajan J, Despacio-Reyes G, Saunders G, Steward C, Harte R, Lin M, Howald C, Tanzer A, Derrien T, Chrast J, Walters N, Balasubramanian S, Pei B, Tress M, Rodriguez JM, Ezkurdia I, van Baren J, Brent M, Haussler D, Kellis M, Valencia A, Reymond A, Gerstein M, Guigó R, Hubbard TJ. 2012. GENCODE: the reference human genome annotation for The ENCODE Project. Genome Res 22:1760–1774. https://doi.org/10.1101/gr.135350.111.
- Li B, Dewey CN. 2011. RSEM: accurate transcript quantification from RNA-Seq data with or without a reference genome. BMC Bioinformatics 12:323. https://doi.org/10.1186/1471-2105-12-323.
- Law CW, Chen Y, Shi W, Smyth GK. 2014. voom: precision weights unlock linear model analysis tools for RNA-seq read counts. Genome Biol 15:R29. https://doi.org/10.1186/gb-2014-15-2-r29.
- Smyth GK. 2004. Linear models and empirical Bayes methods for assessing differential expression in microarray experiments. Stat Appl Genet Mol Biol 3:Article3. https://doi.org/10.2202/1544-6115.1027.
- Garrido-Martín D, Palumbo E, Guigó R, Breschi A. 2018. ggsashimi: Sashimi plot revised for browser- and annotation-independent splicing visualization. PLoS Comput Biol 14:e1006360. https://doi.org/10.1371/journal.pcbi.1006360.
- Yin T, Cook D, Lawrence M. 2012. ggbio: an R package for extending the grammar of graphics for genomic data. Genome Biol 13:R77. https://doi.org/10.1186/gb-2012-13-8-r77.
- Rainer J. 2017. EnsDb.Hsapiens.v75: Ensembl based annotation package. R package version 2.99.0. https://doi.org/10.18129/B9.bioc.EnsDb.Hsapiens.v86.
- R Core Team. 2018. R: a language and environment for statistical computing. R Foundation for Statistical Computing, Vienna, Austria.
- Livak KJ, Schmittgen TD. 2001. Analysis of relative gene expression data using real-time quantitative PCR and the 2(-delta delta C(T)) method. Methods 25:402–408. https://doi.org/10.1006/meth.2001.1262.