Abstract
Chromatin structure plays a key role in regulating gene expression and embryonic differentiation; however, the factors that determine the organization of chromatin around regulatory sites are not fully known. Here we show that HMGN1, a nucleosome-binding protein ubiquitously expressed in vertebrate cells, preferentially binds to CpG island-containing promoters and affects the organization of nucleosomes, DNase I hypersensitivity, and the transcriptional profile of mouse embryonic stem cells and neural progenitors. Loss of HMGN1 alters the organization of an unstable nucleosome at transcription start sites, reduces the number of DNase I-hypersensitive sites genome wide, and decreases the number of nestin-positive neural progenitors in the subventricular zone (SVZ) region of mouse brain. Thus, architectural chromatin-binding proteins affect the transcription profile and chromatin structure during embryonic stem cell differentiation.
INTRODUCTION
Embryonic stem cell (ESC) pluripotency and differentiation are controlled by the coordinated action of multiple epigenetic factors that affect the structure of chromatin and regulate gene expression. These include transcription factors, chromatin remodeling complexes, and additional proteins that alter the properties of chromatin such as linker histone H1 variants and members of the high-mobility-group (HMG) protein superfamily (Citation1Citation–Citation5).
Histone H1 variants and HMG protein are ubiquitously found in the nuclei of all vertebrate cells. These structural proteins bind dynamically to nucleosomes without any known DNA sequence specificity (Citation6, Citation7), modulate the local and global structures of chromatin, and affect gene expression. Histone H1 represents the most abundant family of chromatin-binding proteins; most nuclei contain sufficient H1 molecules to bind to all the nucleosomes. The interaction of H1 with nucleosomes stabilizes the compact, higher-order chromatin structure (Citation8). Vertebrate nuclei contain 3 families of HMG proteins, named HMGA, HMGB, and HMGN, each of which induces specific alterations in DNA or chromatin structure (Citation9, Citation10).The dynamic binding of HMGs to nucleosomes reduces the interaction of H1 with chromatin and can counteract the chromatin-condensing activity of H1 (Citation7, Citation11). Thus, the interplay between H1 and HMG proteins could play a role in chromatin dynamics and function (Citation12). Although extensively studied, the cellular function and mechanism of action of these chromatin architectural proteins, and the extent to which they can affect the properties of ESCs, are not fully elucidated.
Here we examine the role of HMGN1, a major variant of the HMGN protein family, in regulating the chromatin structure and properties of mouse embryonic stem cells (ESCs) during their differentiation along the neuronal pathway. HMGNs could affect chromatin structure and ESC differentiation because they bind specifically to nucleosome core particles (CPs) (Citation13, Citation14), affect the levels of histone modifications (Citation15), and have been linked to the generation of DNase I-hypersensitive sites (DHS) (Citation16), the hallmark of chromatin regulatory sites. HMGNs counteract the activity of certain nucleosome remodeling complexes (Citation17) and thus could affect nucleosome positioning (Citation18, Citation19). In human T cells, HMGN1 preferentially localizes to chromatin regulatory regions such as promoters, enhancers, and nucleosomes bordering CTCF sites (Citation20); in tissue culture cells, either up- or downregulation of HMGN1 levels alters the cellular transcription profile (Citation21). Furthermore, the expression of HMGN genes is related to differentiation processes such as erythropoiesis, myogenesis, osteoblast differentiation, kidney organogenesis, preimplantation development of early mouse embryo, and Xenopus embryogenesis (Citation22). Transient depletion of HMGN proteins from one- or two-cell mouse embryos slowed the progression of preimplantation development (Citation23), and altered HMGN expression during Xenopus embryogenesis led to malformed tadpole embryos (Citation24). Taken together, these results suggest a link between regulated expression of HMGN proteins and cellular differentiation.
To test whether HMGN1 could affect ESC differentiation in the biological context of a whole organism, we first verified that the protein is expressed during preimplantation development (Citation23). We found robust HMGN1 expression throughout all these developmental stages and therefore generated ESCs from Hmgn1−/− mice, induced them to differentiate along the neuronal pathway, and compared their chromatin structure and transcription profiles to those of Hmgn1+/+ ESCs. We found strong preferential binding of HMGN1 to promoters containing CpG islands (CGI), especially when these were transcriptionally active. Significantly, using limiting micrococcal nuclease digests, we detected an unstable nucleosome positioned at the transcription start sites (TSS) of CGI promoters, in a region considered to be “nucleosome depleted” (Citation25Citation–Citation27). The stability of these nucleosomes is related to transcription and affected by HMGN1. Likewise, we found that HMGN1 colocalizes with and affects the hypersensitivity of DHS at the CGI promoters of ESCs. Loss of functional HMGN1 did not noticeably affect ESC differentiation but led to changes in the cellular transcription profiles of neural progenitor cells (NPCs) and neurons. In mouse brain, loss of HMGN1 led to a decrease of nestin-positive NP cells in the subventricular stem cell zone.
Our report provides additional information on the chromatin landscape of ESCs and NPCs and identifies HMGN1 as a protein that affects chromatin structure at the transcription start sites of promoters containing CpG islands of ESCs and that modulates the number of nestin-positive cells in mouse brain.
MATERIALS AND METHODS
ES cell culture and in vitro differentiation.
Hmgn1+/+ and Hmgn1−/− ESC lines were derived from littermate 3.5-day blastocytes obtained from Hmgn1+/− and Hmgn1+/− mice matings (Citation28). In Hmgn1−/− cells, we deleted exons II to IV, which code for the nucleosome-binding domain of the protein (Citation29). The ES cells were cocultured with mitomycin C-treated primary mouse embryonic fibroblast (MEF) feeders (Millipore) or cultured under feeder-free conditions; they were maintained in Knockout Dulbecco's modified Eagle's medium (KO-DMEM; Invitrogen), with 20% serum replacement (SR; Invitrogen), 0.055 mM β-mercaptoethanol (Sigma), 2 mM l-glutamine (Invitrogen), 0.1 mM MEM nonessential amino acid (Invitrogen), 5,000 U/ml penicillin-streptomycin (Invitrogen), and 1,000 U/ml leukemia inhibitory factor (LIF) (Millipore). Cells were passaged every 2 days using 0.05% trypsin–EDTA. In vitro differentiation of ES cells according to neural lineage was performed using a mouse dopaminergic neuron differentiation kit (R&D Systems) according to the manufacturer's instruction.
RNA and cDNA preparation.
Equal amounts of cells were used for total RNA isolation by the use of an RNeasy Mini kit (Qiagen) followed by “on-column” DNase I treatment. RNA (500 ng) was used for cDNA synthesis by iScript kit (Bio-Rad). Equal amounts of cDNA were applied for real-time PCRs with Power SYBR green mix (Applied Biosystems). β-Actin served as an internal control. Reactions and measurements were performed using an AB 7900HT Fast real-time PCR system and software.
Antibodies, Western blotting, and immunostaining.
Rabbit affinity pure polyclonal anti-mouse HMGN1 antibodies were generated in our laboratory (Citation29). Antiactin antibody was from Sigma (A5316). Anti-Oct3/4 antibody was from Santa Cruz (sc-5279), antinestin antibody was from Millipore (MAB-353), and anti-tyrosine hydroxylase (anti-Th) antibody was from Tel-Freez (P40101). Horseradish peroxidase (HRP)-conjugated secondary antibodies for Western blots were from Pierce. Fluorescence secondary antibodies were Alexa Fluor 488–donkey anti-rabbit IgG and Alexa Fluor 568–donkey anti-mouse IgG (Invitrogen). For Western blots, whole-cell lysates were prepared in 1× SDS-PAGE sample buffer (Bio-Rad) supplemented with protease inhibitors (Roche Applied Science). The samples were fractionated on 15% precast Criterion gels, transferred by the semidry method to a polyvinylidene difluoride (PVDF) membrane, blocked with nonfat milk in Tris-buffered saline–Tween 20 (TBST), and probed with antibodies. Chemiluminiscent detection using ECL Plus has been performed according to Amersham recommendations.
For immunostaining, ES cells, neural progenitors, and neurons were grown on coverslips under the conditions described above. Frozen brain sections (30 μm thick) were prepared from 2-week-old Hmgn1+/+ and Hmgn1−/− mice. Immunofluorescence staining was performed using the corresponding antibodies showed in the figures as previously described (Citation30). The images from cultured cells were taken using a Nikon Eclipse E800 fluorescence microscope and processed using NIS-Elements software (Nikon). The images from the brain sections were taken using a Zeiss LSM 710 confocal system and were processed using Zeiss software.
Dissection of mouse SVZ region.
The whole brains of 2-week-old male Hmgn1+/+ and Hmgn1−/− mice were collected. Sections (1 mm thick) were cut using a mouse brain mold and snap-frozen on glass slides on dry ice. The subventricular zone (SVZ) regions from all corresponding sections were dissected using no. 5 tweezers (Dumont) under a dissection microscope and pooled.
Transcription profiling.
Microarray expression analysis of total RNA from ES cells, neural progenitors, and neurons was performed using Affymetrix Mouse GeneChips 430 2 (430V2) as described previously (Citation21). Three replicates of Hmgn1+/+ and Hmgn1 −/− ESCs, NPCs, and neurons were generated. All analysis was performed using R and BioConductor (Citation31). The quality of the arrays were evaluated with R package version 1.18.0 “affy” (Citation32) and “simpleaffy” (Citation33). Expression levels were derived using the Robust Multichip Average (RMA) protocol (Citation34) with default settings. Differentially expressed genes were identified using an empirical Bayes method implemented in the R package “Limma” (Citation34). P values were corrected for multiple testing using a false-discovery-rate method. Genes that have a |log2 (fold change)| value ≥ 1 and for which the adjusted P value is ≤0.01 are considered differentially expressed between two conditions (i.e., between Hmgn1+/+ and Hmgn1−/−) or between two differentiation states (i.e., NP versus ES or neuron versus NP).
ChIP-Seq.
About 2 × 10⁷ cells (feeder-free ES cells or neural progenitors) were cross-linked directly in culture medium with 1% formaldehyde solution for 10 min at room temperature. Chromatin was fragmented to 200 to 500 bp by sonication (Bioruptor). Chromatin immunoprecipitation (ChIP) experiments were performed using Dynabeads (Invitrogen) and affinity-purified anti-HMGN1. For preparation of sequencing libraries, 20 ng ChIP DNA or input DNA (samples reserved before ChIP) were end repaired using an End-It DNA end repair kit (Epicentre), and then an “A” was added to the 3′ end using Klenow (3′–5′ exo-) (NEB). After ligation with Illumina adaptors, 200-to-300-bp DNA fractions were size selected on a 2% E-gel (Invitrogen), extracted, and then amplified by 18 cycles of PCR using Illumina primers and Phusion DNA polymerase (NEB). Libraries were purified by the use of Agencourt Ampure beads (Beckman Coulter) and then sequenced on Illumina Genome Analyzer IIx with 36-bp single-end reads.
DNase I hypersensitivity assays.
For genome-wide analysis, intact nuclei were isolated from trypsinized cells by incubation on ice for 10 min in buffer containing 0.02% IGEPAL CA-630 (Sigma), 1 mM EDTA, 0.5 mM EGTA, 0.5 mM spermidine, and protease inhibitor (Roche Applied Science). DNase I digestion was carried out by incubation of 2 × 10⁷ nuclei with 40 U/ml DNase I (Roche Applied Science) at 37°C for 3 min. After treatment by RNase A and proteinase K, DNA was recovered by phenol-chloroform extraction. DNA fragments with sizes between 150 and 500 bp were isolated by 9% sucrose gradient centrifugation. Construction of libraries and sequencing were performed the same way as described above for the ChIP-Seq samples. DNase I accessibility assays were performed to validate the genome-wide analysis. DNase I digestions were done using 40, 60, or 80 U/ml DNase I. The digested DNA was precipitated, and equal amounts of DNA were analyzed by quantitative real-time PCR as described previously. Primers are available upon request.
Genome-wide nucleosome-positioning assay.
Mononucleosomal DNAs from wild-type and Hmgn1−/− ES cells and neural progenitors were isolated by micrococcal nuclease digestion using an EZ Nucleosomal DNA Prep kit (Zymo Research) according to the manufacturer's instruction. In brief, nuclei were isolated from trypsinized cells by incubation on ice for 5 min in Nuclei Prep buffer. Nuclei (1.5 × 10⁶) were then digested using 0.05 to 0.5 unit of micrococcal nuclease in 100 μl MN Digestion buffer at room temperature for 10 min. Nucleosomal DNA was purified using the columns supplied with the kit and then was then processed on 2% agarose gel to check the size. Mononucleosomal DNA was selected for construction of Illumina sequencing libraries. Library preparation and sequencing were performed as described above for ChIP-Seq.
Bioinformatic ChIP-Seq, DNase I-Seq, and MNase-Seq analyses.
The Mouse Genome 430 2.0 array has 45,101 probe sets associated with 19,824 Mouse Genome Informatics (MGI) gene identifiers. Of these, 17,392 are experimentally validated and are listed in the NCBI RefSeq “NM” gene database. We used these coordinates for TSS analysis. Probe sets were mapped to MGI identifiers using information provided by the Jackson Laboratory (http://www.informatics.jax.org/). Unfiltered sequencing reads (from ChIP-Seq, DNase I-Seq, or MNase-Seq) were aligned to the mouse reference genome (NCBI build 37, mm9) using Bowtie (Citation35). Up to 1 mismatch was allowed for each aligned read. Only uniquely aligned reads were collected for further analysis. Binding regions were identified using SICER (Citation36) with the following parameters: effective genome size, 0.787 (78.7% of the mouse genome is mappable); window size, 100 bp for HMGN ChIP-Seq and 50 bp for DNase I-Seq; gap size, 100 bp for HMGN ChIP-Seq and 50 bp for DNase I-Seq. The SICER score in the graph can be viewed as an indication of peak intensity. Calculation of coverage and identification of overlapping binding regions were performed with the “chipseq” and “GenomicRanges” packages in BioConductor (Citation31). Specifically, in analyzing MNase-seq data, since the reads are from the ends of the mononucleosome particle, to best visualize the nucleosome positions, all the reads were shifted to the middle of the corresponding nucleosome core. The average sizes of mononucleosome fragments purified from a 2% agarose gel were determined by Bioanalyzer (Agilent). For normalization, the calculation of coverage at any regions and the comparisons between different data sets were preceded by library size normalization. Control subtraction was carried out in the following way: coverage (exp)/N1 − coverage (control)/N2, in which “exp” is the data set (in .bam format) to be examined, N1 is the library size of the experimental data (“exp”), and N2 is the library size of the control. In this study, input sequences (DNA sequences after sonication only without immunoprecipitation) were used as a control. The function coverage that calculates genome coverage from .bam files is from the “chipseq” package in BioConductor (Citation31).
RESULTS
Differentiation of Hmgn1−/− embryonic stem cells along the neural lineage.
To test whether HMGN1 could affect ESC differentiation, we first reexamined the HMGN1 expression pattern during mouse early embryonic differentiation (Citation23). We found robust HMGN1 expression in oocytes and throughout all preimplantation stages, including the blastocyst stage (), raising the possibility that HMGN1 affects the chromatin structure and differentiation potential of ESCs. We therefore established ESCs from Hmgn1+/+ and Hmgn1−/− mice. Western blots () and immunofluorescence () verified that the Hmgn1−/− ESCs lacked intact HMGN1 protein. Loss of HMGN1 did not affect the viability or morphology of the ESCs. The Hmgn1−/− ESC colonies, just like the Hmgn1+/+ colonies, remained undifferentiated, as indicated by staining for alkaline phosphatase (), immunostaining for Oct3/4 (), and reverse transcription-PCR (RT-PCR) analysis of Nanog levels ().
Fig 1 Effects of Hmgn1 depletion on in vitro ES cell differentiation. (A) HMGN1 protein expression during mouse embryonic preimplantation. Immunofluorescence images at the stages indicated above each panel are shown. (B) Morphology of Hmgn1+/+ and Hmgn1−/− ES cell colonies during differentiation along the neuronal pathway. (C) Genotyping (Citation29) and Western analysis of the ES cells used. (D) Immunofluorescence of Oct3/4, an ES cell marker, in the ES cell colonies. (E) Both Hmgn1+/+ and Hmgn1−/− ES cell colonies express the pluripotency marker alkaline phosphatase. (F) Immunofluorescence of the neural progenitor nestin. (G) Immunofluorescence of the dopaminergic neuron marker tyrosine hydroxylase (Th). (H) Quantitiative RT-PCR analysis of the expression of Hmgn1, Nanog, Nestin, and tropomyosin-related kinase B (TrkB) during Hmgn1+/+ and Hmgn1−/− ES cell neural differentiation. The values obtained in ES cells were set to 100%.
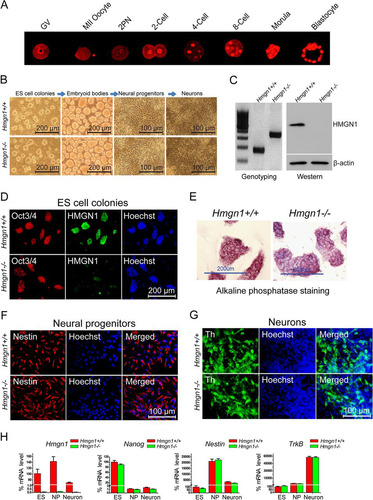
To test whether loss of HMGN1 affects the differentiation potential of the ESCs, we induced differentiation along the neuronal pathway (). Upon removal of LIF, both the Hmgn1−/− and Hmgn1+/+ ESCs formed embryoid bodies which could be further induced to differentiate into nestin-expressing NPCs as indicated by immunofluorescence and quantitative RT-PCR ( and ). Further differentiation toward dopaminergic neurons resulted in cultures in which most cells developed axons and dendrites, a morphology characteristic of adult neurons (; see also Fig. S1 in the supplemental material). Immunostaining for tyrosine hydroxylase (TH) revealed that about half of the neurons were dopaminergic neurons (). The mRNA expression patterns of Nanog, Nestin, and tropomyosin-related kinase B (TrkB), which serve as differentiation markers for ESCs, NPCs, and adult neurons, respectively, further confirmed that the Hmgn1−/− ESCs differentiated properly along the neuronal pathway ().
HMGN1 depletion affects gene expression during ES cell differentiation.
Alterations in HMGN levels can affect gene expression, leading to phenotypes that are not immediately obvious (Citation22, Citation29, Citation37Citation–Citation39). Therefore, we compared the transcription profiles of Hmgn1+/+ ESCs, NPCs, and neurons to those of Hmgn1−/− cells at the same three differentiation stages. Loss of HMGN1 altered significantly the expression of 19, 169, and 85 genes in ESCs, NPCs, and neurons, respectively ( and ; see also Table S1A in the supplemental material). Quantitative RT-PCR (Q-PCR) analysis of 9 upregulated and 9 downregulated genes (the 3 that were most changed, 3 that were moderately changed, and the 3 that were least changed) at each differentiation stage verified the microarray results (see Table S2 in the supplemental material). Gene ontology analysis performed using DAVID (Citation40) for all the genes with altered expression revealed that genes involved in developmental processes, especially in organ morphogenesis, vasculature development, and tissue development, were the genes most severely affected (see Table S3 in the supplemental material).
Fig 2 HMGN1 depletion affects gene expression during ES cell differentiation along the neuronal pathway. (A) Transcription analysis of Hmgn1+/+ and Hmgn1−/− cells in the ES, NP, and neuron stages. Red dots mark genes (listed in Table S1A in the supplemental material) that were significantly affected by loss of HMGN1. (B) Clustering of genes (represented in panel A) across three differentiation states based on expression values. (C) Comparison of fold changes in gene expression during differentiation processes from ESCs to NPCs or NPCs to neurons in Hmgn1+/+ and Hmgn1−/− cells. The difference between red and blue visualizes the effects of HMGN1 loss on gene expression during differentiation.
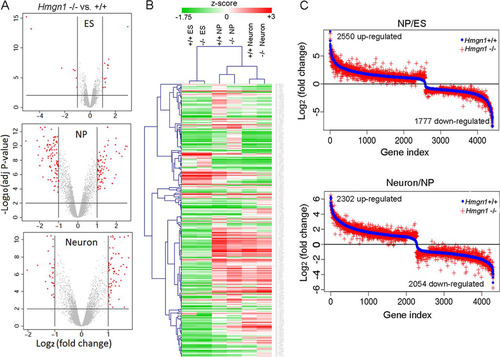
Progression through the differentiation stages leading from ESCs to neurons involves major changes in the expression of numerous genes. In both Hmgn1+/+ and Hmgn1−/− cells, close to 4,000 genes showed expression level changes during the switch either from ESCs to NPCs or from NPCs to neurons. Over 85% of these changes involved the same genes in both Hmgn1+/+and Hmgn1−/− cells. In Table S1B and C in the supplemental material, we list the gene names and their fold change values in both Hmgn1+/+ or Hmgn1−/− cells. In the experiment represented by , we first sorted the genes based on their fold changes in expression levels in Hmgn1+/+ cells and then plotted these sorted genes versus the corresponding fold changes in both Hmgn1+/+ (blue) and Hmgn1−/− (red) cells. The differences between red crosses and blue dots indicate that the magnitude of the differentiation-related changes in gene expression was affected by loss of HMGN1 (). These changes are not due to variations between microarray replicates, because each point represents the fold change calculated from 3 replicates from each cell type, whereas separate control analyses of all the possible versions of the 2 replicates revealed that the variations within the Hmgn1−/− or Hmgn1+/+ groups were very small (see Fig. S2 in the supplemental material). The mean variation between Hmgn1+/+ and Hmgn1−/− cells was more than 4-fold bigger than the variation within duplicates (0.327 versus 0.067 [P value < 2.2e–16; Wilcoxon rank sum test]). Thus, HMGN1 modulates and fine tunes the general fidelity of the cellular transcription profile and does not serve as a specific transcription factor that regulates the expression of a select subset of genes.
Reduced nestin-positive cells in the SVZ of Hmgn1−/− mice.
The Allen Brain Atlas database reveals prominent Hmgn1 expression in the SVZ, in the hippocampus, and in the olfactory bulbs (), three regions enriched in neural stem/progenitor cells and active in neurogenesis. Indeed, immunofluorescence staining of brain sections from a 2-week-old mouse indicated that HMGN1 protein was most prominently expressed in the SVZ and the hippocampus, where the cells are tightly packed, as indicated by Hoechst staining (). Double immunofluorescence analysis of the SVZ regions revealed that nuclei of nestin-expressing cells contained significant amounts of HMGN1, an indication that HMGN1 was expressed in mouse NPCs ().
Fig 3 Decreased nestin-positive cells in the brain of Hmgn1−/− mice. (A) High Hmgn1 expression in the subventricular zone (SVZ), hippocampus, and olfactory bulbs of mouse brain (from www.brain-map.org with permission). The inset shows the corresponding Nissl image. (B) Immunofluorescence staining in 2-week-old Hmgn1+/+ brain reveals high HMGN protein levels in mouse hippocampus and SVZ (outlined by dashes). (C) Double immunofluorescence reveals colocalization of nestin in the cytoplasm of cells expressing HMGN1 in the SVZ region. A magnified image of the area outlined by dashed lines is shown under each panel. (D) Decreased nestin immunofluorescence staining in the SVZ (outlined) of 2-week-old Hmgn1−/− mice. (E) Decreased Nestin expression in the SVZ of Hmgn1−/− mice detected by RT-PCR (*, P < 0.01).
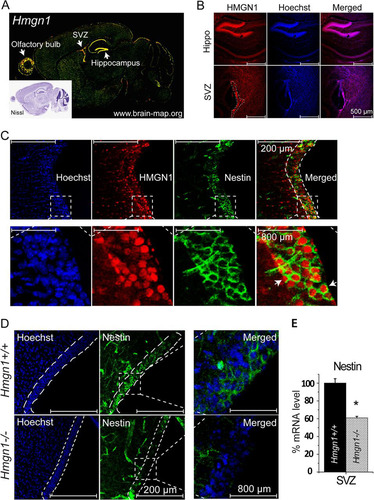
To test whether loss of HMGN1 affects NPC characteristics in the biological context of the entire organism, we compared the levels of nestin-positive cells in Hmgn1−/− and Hmgn1+/+ littermates. Immunofluorescence analysis indicated that loss of HMGN1 reduced the number of nestin-positive cells in the SVZ region (), and quantitative RT-PCR analysis of RNA isolated from the SVZ regions verified that the expression of Nestin mRNA in the Hmgn1−/− SVZ was reduced by 40% compared to that seen in the Hmgn1+/+ SVZ (). Thus, loss of HMGN1 reduces the number of nestin-positive cells in the SVZ region of mouse brain.
HMGN1 preferentially binds to promoters containing CpG islands.
To gain insights into the mechanisms whereby HMGN1 affects transcriptional fidelity, we examined the genome-wide distribution of HMGN1 in ESCs and NPCs. Chromatin immunoprecipitation sequencing (ChIP-Seq) failed to yield reliable data on the localization of HMGN1 in ESCs, most likely because their chromatin is hyperdynamic (Citation41, Citation42) and the chromatin residence time of many nuclear proteins, including HMGN1 (see Fig. S3 in the supplemental material), is relatively short. In NPCs, however, we were able to determine the genome-wide distribution of HMGN1.
In NPCs, 72% of the HMGN1-binding regions were located at gene promoter regions and within gene bodies (). The HMGN1 peaks in the promoter regions were significantly more intense (P value < 2.2e–16; Wilcoxon rank sum test), an indication of preferential association with these regions (). Significantly, we found a striking overlap between HMGN1-binding promoters and CGI-containing promoters. Among all 24,303 annotated promoters in the NCBI Mouse mm9 Refseq database (http://hgdownload.soe.ucsc.edu/goldenPath/mm9/database/), there are 15,112 CGI promoters, 10,892 (72%) of which are bound by HMGN1. Conversely, 10,892 (92%) of all 11,881 promoters bound by HMGN1 also contain CGI. In contrast, among the 9,181 non-CGI promoters, only 989 (11%) bind HMGN1 ().
Fig 4 Genome-wide distributions of HMGN1 in neural progenitor cells. (A) Global distribution of HMGN1 throughout the genome. (B) Enhanced HMGN1-binding strength at promoters. (C) HMGN1 binds to promoters containing CpG islands. Note that 92% of the HMGN1-binding promoters are CpG island promoters and that 70% of the CpG island promoters bind HMGN1, regardless of expression levels. (D) Average HMGN1 signals near the transcription start site (TSS) of different groups of genes. Black line, Top40 genes with CpG island promoters; red line, Top40 genes with non-CpG island promoters; blue line, Bot40 genes with CpG island promoters; green line, Bot40 genes with non-CpG island promoters. RPM, reads per million. The inset indicates average expression values (in log2) in the four groups of genes. (E) An example of colocalization of HMGN1, CpG island promoters, and H3K4Me3 histone mark. (F) Overlapping of HMGN1-binding promoter and H3K4Me3-positive promoters.
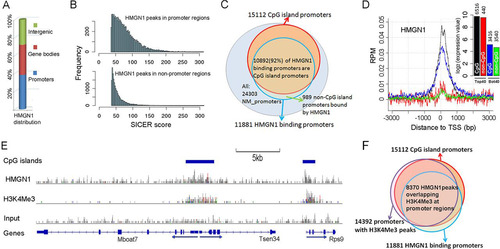
The Mouse genome transcription arrays contain 45,101 probes which identify 17,392 experimentally validated genes annotated in the Mouse Genome Informatics (MGI) database (Citation43) and listed in the NCBI Refseq database (Citation44). The HMGN1 signal strength at the promoters of the 6,956 most actively transcribed (40% of total genes [Top40]) genes is significantly stronger than at those of the 40% least-transcribed genes (Bot40) (t test P value < 2.2e–16), an indication that HMGN1 preferentially associates with transcriptionally active genes (see Fig. S4 in the supplemental material).
In the Top40 and Bot40 groups, 6,516 (94%) and 3,416 (46%) genes, respectively, contain CGI in their promoters. As shown in , in the Top40 gene group, the average HMGN1 binding level was 4-fold higher at CGI promoters (black) than at non-CGI promoters (red) (t test P value < 2.2e–16). Furthermore, even in the Bot40 group, the HMGN1 binding to CGI promoters (blue) was 3-fold higher than to the non-CGI promoters (t test P value < 2.2e–16). This distribution pattern was not related to transcription level since, in either the Top 40 or the Bot40 group, the gene expression levels were not related to the CGI content in their promoters (, inset). Thus, the major driving force of HMGN1 binding to promoters is the presence of CGI, rather than the gene expression level. In agreement, HMGN1-binding sites colocalized with H3K4Me3 ( and ), a histone mark associated with transcription initiation at CGI promoters (Citation45).
HMGN1 affects nucleosome organization at TSS of CpG island-containing promoters in ESCs.
The organization of nucleosomes in promoters plays an important role in regulating gene expression levels. Given that HMGN1 binds specifically to nucleosomes (Citation13, Citation14), we mapped the nucleosome organization in Hmgn1+/+ and Hmgn1−/− ESCs and NPCs by deep sequencing of mononucleosomal DNA isolated from micrococcal nuclease digests. In these digests, the most accessible nucleosomes are released first and then further digested, and the corresponding DNA may not be included in the mononucleosomal fraction of an extensive digest. Therefore, we mapped the genome-wide positions of nucleosomes present in either limited or extensive digests when, respectively, either only ∼5% or more than ∼80% of the chromatin was converted to mononucleosomes. In these experiments, we ensured that the wild-type and knockout cells were digested to the same extent ().
Fig 5 Nucleosome positioning at gene transcription start sites (TSS) in ES and NP cells. (A) MNase digestions of ESCs and NPCs; the sizes of the isolated monomers from limited and extensive digests are shown in the bottom panels. (B) Occupancy of nucleosome isolated from limited and extensive digests at the TSS. (C and D) Nucleosome occupancy at TSS of Top40 and Bot40 (Bottom40) genes that either do or do not contain CpG islands after extensive digestion (C) and limited digestion (D). (E and F) Correlation between nucleosome positioning at TSS and gene expression levels at ESCs (E) and NPCs (F). Genes were divided into 8 groups based on expression values (log2) as shown at the top of panels E and F. (G and H) Effects of HMGN1 depletion on nucleosome occupancy in the promoters of ESCs and NPCs. Arrows point to the position of the 0 nucleosome, located just upstream of the TSS.
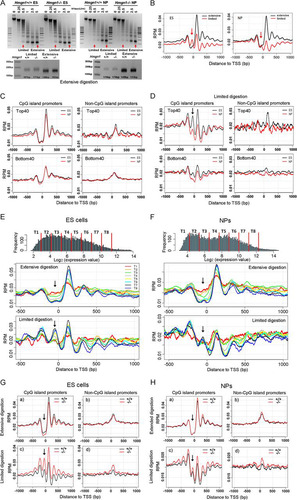
The nucleosome positions seen in extensive digestion of both Hmgn1+/+ ESCs and NPCs were very similar to those seen in other cells and revealed a region depleted of nucleosome at the TSS and flanked by nucleosomes up- and downstream (). The +1 nucleosome is the best positioned, as manifested by the highest peak at that site. However, analysis of the limited MNase digestions clearly reveals the presence of a nucleosome positioned at the TSS in the “nucleosome-free” regions seen in extensive digestions (arrows, ). The linker DNA regions flanking these nucleosomes are likely the most accessible to the enzyme, and therefore these nucleosomes are the first to be released from the chromatin fiber. Since these nucleosomes may contain histone variants that render them unstable (Citation46), the corresponding DNA fragment is rapidly digested by MNase, resulting in the “nucleosome-free valley” typically seen at the TSS in extensive MNase digests.
In view of the extensive localization of HMGN1 at CGI promoters, we examined the nucleosome organization at both CGI and non-CGI promoters in the Top40 and Bot40 gene groups. We found that in both ESCs and NPCs, the nucleosomes in the TSS regions containing CGI were significantly better positioned than in non-CGI promoters in both extensive and limited digests ( and ). The nucleosome at the TSS (position 0) is clearly seen in the limited digests but not in the extensive digests of CGI promoters of the Top40 group (, arrow).
We separated the CGI promoter genes of ESC and NPC into 8 groups based on their expression values and mapped the nucleosome positions around the TSS in each group ( and ). In the least-expressed group (T1; red line) the signal from the unstable nucleosome at TSS was highest in the extensive digestion but lowest in the limited digestion. Conversely, the signal from the most-expressed genes was highest in the limited digestions and lowest in the extensive digestion ( and ), a finding that is fully compatible with the notion that the DNA signal at this position is related to transcription level. The nucleosome at position +1 became more stable or better positioned as gene expression levels increased. In summary, in TSS regions of the promoters containing CGI, the stability of the nucleosomes is related to transcription levels; enhanced transcription destabilizes the nucleosomes at the TSS (position 0) but stabilizes the nucleosome at the +1 site.
Loss of HMGN1 increased the peak height of all nucleosomes (from −3 to +5) around the TSS of CGI promoters but only in limited digests. The effects were not seen in extensive digests or at non-CGI promoters ( and ). The increased peak height may reflect changes in nucleosome occupancy or accessibility, perhaps due to effects of HMGN1 on chromatin remodeling activities (Citation17) and/or on the binding of linker histone H1 to chromatin (Citation47). Thus, HMGN1 affects the position or stability of the nucleosomes that are most susceptible to micrococcal nuclease digestion, i.e., the nucleosomes located in CGI-containing promoters of transcriptionally active genes.
HMGN1 modulates the DNase I hypersensitivity in the CGI promoters of ESCs.
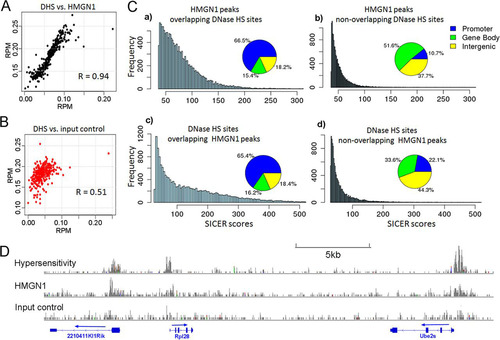
Changes in nucleosome occupancy may affect the locations and strengths of the DNase I-hypersensitive sites (DHS) which are hallmarks of regulatory regions in chromatin. In NPCs, we identified 30,199 DHS and found significant overlap between the locations of DHS and HMGN1 ( and ). The HMGN1-binding signal at HMGN1-DHS overlapping sites was significantly stronger than that at nonoverlapping sites (P value < 2.2e–16; Wilcoxon rank sum test) (bar graph, , panels a and b), and the HMGN1-DHS overlapping sites were preferentially located at promoters (pie chart, , panels a and b). Thus, 66.5% of the HMGN1 peaks that overlap DHS but only 10.7% of the HMGN1 sites that do not overlap DHS localize to promoters. Likewise, DHS that overlap HMGN1 have significantly more intense peaks (P value < 2.2e–16; Wilcoxon rank sum test) and localize to promoter regions with a 3-fold higher frequency (65.4% versus 22.1%) than DHS that do not overlap HMGN1 ( panels c and d).
Fig 6 Colocalization of HMGN1 and DNase I hypersensitivity sites (DHS) in neural progenitor cells. (A) Correlation between HMGN1 intensity and DNase I hypersensitivity at all DHS. Average coverage depths (of HMGN1 or hypersensitivity) were calculated at all DNase I-hypersensitive regions. Data, including the corresponding DNase I hypersensitivity data points, were sorted by HMGN coverage depth and then grouped into 100 data point bins and averaged. The Pearson correlation coefficient (R) was calculated for the binned data. (B) Correlation between input signal and DNase hypersensitivity at the same regions. (C) Distributions of HMGN1 peaks that either do or do not overlap DNase HS sites (top two panels) and DNase HS sites that either do or do not overlap HMGN1 peaks (bottom). Note that the overlapping regions have stronger signal intensities and are mostly located in gene promoters. (D) An example of colocalization between HMGN1, DNase I hypersensitivity, and gene promoters.
In Hmgn1+/+ ESCs, we identified 56,156 DHS; 67% of these overlapped with the sites in CJ7 mouse ES cells mapped by the Mouse Encode Project (see Fig. S5 in the supplemental material). In Hmgn1−/− ESCs, however, we identified only 17,017 sites; 12% of the DHS are new and were not detected in Hmgn1+/+ ESC, and 88% (15,042) of the sites overlapped the sites detected in wild-type ESCs (). The DHS retained in Hmgn1−/− ESCs were preferentially located in CGI promoters: 58% of the 15,022 DHS that were located in the CGI promoters in Hmgn1+/+ ESCs were retained in Hmgn1−/− ESCs. In contrast, only 15% of 41,156 DHS that were not in CGI promoters were retained. Importantly, the intensity of the DHS retained in Hmgn1−/− ESCs was significantly lowered (t test P value < 2.2e–16) ( and ), especially at the sites located in CGI promoters ().Quantitative PCR analysis of the kinetics of DNase I digestion of 5 promoters verified that loss of HMGN1 decreases the DNase I hypersensitivity of these regions (; see also Table S4 in the supplemental material). The DNase I hypersensitivity of two (Actb and Gapdh) housekeeping gene promoters, which served as controls, was not affected by loss of HMGN1. In NPC, we found that loss of HMGN1 reduced the number of DHS from 30,199 to 23,320 (). Within the 23,320 DHS identified in Hmgn1−/− NPCs, 11% were new and 89% overlapped the sites present in Hmgn1+/+. Loss of HMGN1 did not significantly alter the DHS sensitivity of the retained, overlapping sites ( and ).
Fig 7 Reduced DNase I hypersensitivity in Hmgn1−/− ES cells. (A) DHS in Hmgn1+/+ and Hmgn1−/− ESCs. (B) Decreased DNase I in Hmgn1−/− ESCs. Data represent intensities measured at sites that overlap that are present in both Hmgn1+/+ and Hmgn1−/− cells. (C) Loss of HMGN1 decreases the DNase I sensitivity at CpG promoters of ESCs. (D) DHS in Hmgn1+/+ and Hmgn1−/− NP cells. (E) HMGN1 does not affect the DHS in NP cells. (F) HMGN1 does not affect the DHS at the CpG promoters in NP cells. (G) Quantitative PCR validation of DNase I-seq results in ES cells. The results determined with a control taken from a region that is not digested by DNase I verify that equal amounts of DNA were loaded for Hmgn1+/+ and Hmgn1−/− cells. (H) A genome browser view of DNase I hypersensitivity of Hmgn1+/+ and Hmgn1−/− ES cells.
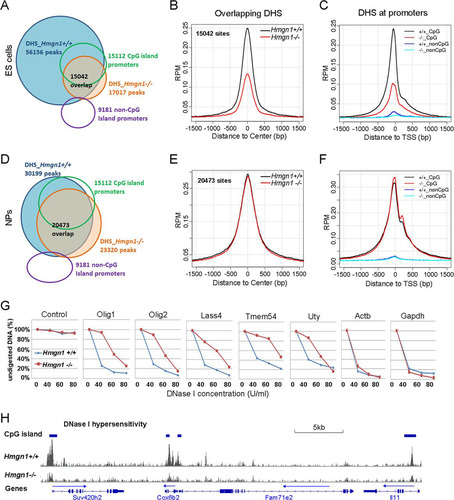
Thus, loss of HMGN1 affects the structure of the hyperdynamic chromatin of ESCs to a larger extent than that of the developmentally committed chromatin of NPC, a finding fully compatible with increased nucleosome occupancy seen in limited micrococcal nuclease digests in ESCs. Loss of HMGN1 reduces the DHS located in intergenic region and gene bodies to a larger extent than the sites located at CGI promoters, providing a partial explanation for the moderate effects on transcription levels.
DISCUSSION
Our studies of ESC chromatin reveal that HMGN1, one of the few nuclear proteins that bind specifically to nucleosome cores but not to isolated histones or DNA, affects the organization of nucleosomes and the DNase I hypersensitivity at active promoters containing CGI. Loss of HMGN1 has only slight effects on the ESC cellular transcription profile and their potential to differentiate into neuronal cells; however, in the brain of Hmgn1−/− mice, the levels of neural progenitors in the SVZ region are reduced.
Nucleosome positioning around the TSS of active promoters plays a key role in gene expression. In limited micrococcal nuclease digests, in which only 5% of the genome is converted to nucleosome core particles (CPs), we detect a well-positioned nucleosome at the TSS in a region considered to be nucleosome depleted. The presence of this nucleosome is especially obvious in the CGI promoters of transcriptionally active genes in ESCs (). The nucleosomes at the TSS of transcribed genes are likely to be relatively unstable (Citation46) and most accessible to micrococcal nuclease; they are rapidly released and then further digested, leading to nucleosome-free regions which are most clearly delineated at TSS of genes containing CGI (Citation25). Our analysis of the limit digests reveals a correlation between transcription levels and nucleosome occupancy at the TSS. The occupancy is highest in the most transcribed genes and lowest in the least transcribed genes, suggesting that the nucleosomes from the most transcriptionally active genes are the most rapidly released during digestion. However, once released, these nucleosomes, which may contain H2Az variants, are unstable; they are rapidly digested and, therefore, in the extensive micrococcal nuclease digests, the promoters of the most active genes show the most prominent nucleosome-free region. Thus, our studies reveal that the stability of nucleosomes at the TSS is inversely related to transcription levels, since the nucleosomes from the most active genes are most abundant in limit digests and least abundant in extensive digests, while the nucleosomes from the least transcribed genes are most abundant in extensive digests and least abundant in limit digests (compare T1 to T8 in and ).
Loss of HMGN1, which preferentially binds to TSS containing CGI (), stabilizes the position of the nucleosomes at these TSS—an unexpected finding, since HMGN proteins stabilize the structure of isolated nucleosomes (Citation48) and loss of the protein would therefore be expected to sensitize the released nucleosomes to further digestion. Several mechanisms could account for the effects of HMGN1 on nucleosome positioning and stability. First, because HMGN1 competes with histone H1 (Citation47), loss of HMGN1 would increase H1 binding, thereby decreasing the ability of micrococcal nuclease to access its initial digestion sites in the linker DNA (Citation8) and subsequently further degrade the released nucleosome (Citation49). Second, because HMGN1 reduces the chromatin interaction of nucleosome remodeling complexes (Citation17), loss of HMGN1 could enhance the ability of these complexes to position nucleosomes at the TSS. Third, HMGN1 can transiently enhance the levels of histone acetylation and destabilize nucleosomes during transcription activation (Citation50); therefore, its loss could enhance the stability of a nucleosome at the TSS. Fourth, because HMGN1 is found in metastable multiprotein complexes (Citation51) and interacts with chromatin modifiers such as PCNA (Citation52) and procyclic acidic repetitive protein 1 (PARP1) (Citation53), loss of HMGN1 could affect the binding of these proteins to chromatin. Since nucleosome positioning is determined by the coordinated action of several factors, including DNA-binding proteins (Citation18), it remains to be seen whether one or several of these factors are most specifically affected by HMGN1.
A possible link between the presence of HMGN and the generation of DHS in globin genes has been previously suggested (Citation16); however, the extent to which HMGN proteins shape regulatory sites in chromatin is not known. We now find that in NPCs, HMGN1 colocalizes extensively with DHS genome wide in a fashion similar to that seen in human T cells (Citation20). In both NPCs and human T cells, the hypersensitivity of the DHS that colocalize with HMGN1 is stronger than that of the sites that do not colocalize with HMGN1 (). Furthermore, in both NPCs and T cells, the positional overlap of HMGN1 with DHS is especially striking in the promoter region. In NPCs, 65% of the DHS that overlap HMGN1 but only 22% of the sites that do not overlap are located in the promoter region (, panels c and d). Likewise, in the promoter region of human T cells, the frequency of DHS that overlap HMGN1 is 3-fold higher than that of sites that do not overlap HMGN1 (28% versus 10%) (Citation20). The preference for HMGN1 to colocalize with the DHS in promoters is even more striking. In NPCs, 66% of the HMGN1 sites that overlap DHS but only 11% of the sites that do not overlap DHS localize to promoter regions. In T cells, the ratio is 32% versus 2% (Citation20). These studies raise the possibility that preferential colocalization of HMGN1 with DHS in promoter regions is a general characteristic of vertebrate chromatin.
Loss of HMGN1 leads to a significant reduction in DHS, especially in the hyperdynamic chromatin of ESCs, where the number of sites is reduced from 56,156 in Hmgn1+/+ to 17,017 in Hmgn1−/− ESCs. The DHS retained in Hmgn1−/− ESCs preferentially localize at promoters containing CGI, providing a partial explanation for the relative small changes in transcription seen in these cells. Loss of HMGN1 reduces not only the number but also the hypersensitivity of the retained DHS (), suggesting that HMGN1 plays a role in maintaining their DNase I sensitivity. Likewise, in NPCs, loss of HMGN1 reduces the number of DHS (), an expected finding given their extensive colocalization and the observation that the presence of HMGN1 at a site affects its DNase I sensitivity (). Similarly to ESCs, the retained sites localize to CGI promoters; however, in contrast to ESCs, the DNase I hypersensitivity at these sites is not markedly changed, perhaps because their chromatin is less malleable.
Thus, loss of HMGN1 in ESCs affects two important aspects of chromatin organization: nucleosome positioning at the TSS and DNase I hypersensitivity. These effects are moderate, perhaps because HMGN1 functions within a dynamic framework of chromatin-binding proteins that compete for similar sites on nucleosomes. Thus, the absence of HMGN1 could facilitate the binding of another HMGN variant, especially to sites with high affinity for HMGN proteins, thereby minimizing changes in chromatin structure and activity. Indeed, preliminary experiments suggest that loss of HMGN1 induces reorganization in the chromatin binding of the closely related variant HMGN2.
Given that HMGN1 is expressed in most vertebrate cells, binds specifically to nucleosomes, localizes to DHS, and affects the binding of linker H1 to chromatin, its loss would be expected to have significant effects on transcription and the cellular phenotype. Yet our present experiments and analysis of MEFs from mice lacking HMGN variants indicate that loss of a single HMGN has only minor effects on the cellular transcription profile (Citation21). As elaborated above, functional redundancy among HMGN variants and other compensatory events in chromatin may minimize the deleterious effects of a lack of any specific variant, including HMGN1. Yet several types of experiments, including analysis of Hmgn−/− mice, reveal that lack of a single HMGN variant may lead to specific phenotypes. Thus, Hmgn3−/− mice are diabetic (Citation54) and Hmgn1−/− mice are hypersensitive to DNA damage and have an increased incidence of certain cancers (Citation29, Citation55). The emerging data suggest that each HMGN variant contributes to the maintenance of the fidelity of the cellular transcription profile and that loss of a variant is deleterious, especially under stress condition such as exposure to heat shock (Citation50) or DNA-damaging agents (Citation29, Citation53, Citation55). Indeed, we now find that even though the Hmgn1−/− ESCs seem to grow and differentiate normally, they are hypersensitive to the DNA-damaging agent doxorubicin (Adriamycin) (see Fig. S6 in the supplemental material). Likewise, the decrease in nestin-positive cell numbers in the SVZ region of Hmgn1−/− mice suggests that while the Hmgn1−/− ESCs are not visibly affected in tissue culture, in the context of the entire organism, loss of HMGN1 impedes the differentiation or the survival of NP cells. Loss of HMGN1 also alters the behavior of mice, most likely by changing expression of MeCp2, a protein that is highly expressed in neurons (Citation37). Our studies link these phenotypic changes to HMGN1-mediated alterations in chromatin structure.
tmcb_a_12274881_sm0001.xlsx
Download MS Excel (489.7 KB)tmcb_a_12274881_sm0002.pdf
Download PDF (77 KB)tmcb_a_12274881_sm0003.pdf
Download PDF (24 KB)tmcb_a_12274881_sm0004.pdf
Download PDF (77.4 KB)tmcb_a_12274881_sm0005.pdf
Download PDF (231 KB)tmcb_a_12274881_sm0006.pdf
Download PDF (386.3 KB)tmcb_a_12274881_sm0007.pdf
Download PDF (162.3 KB)tmcb_a_12274881_sm0008.pdf
Download PDF (179.4 KB)tmcb_a_12274881_sm0009.pdf
Download PDF (273.7 KB)tmcb_a_12274881_sm0010.pdf
Download PDF (188.6 KB)ACKNOWLEDGMENTS
This research was supported by the Intramural Research Programs of the CCR, NCI, and NIH and of the National Library of Medicine, NIH.
SUPPLEMENTAL MATERIAL
Supplemental material for this article may be found at http://dx.doi.org/10.1128/MCB.00435-13.
REFERENCES
- Li M, Liu GH, Izpisua Belmonte JC. 2012. Navigating the epigenetic landscape of pluripotent stem cells. Nat. Rev. Mol. Cell Biol. 13:524–535.
- Mattout A, Meshorer E. 2010. Chromatin plasticity and genome organization in pluripotent embryonic stem cells. Curr. Opin. Cell Biol. 22:334–341.
- Shah SN, Kerr C, Cope L, Zambidis E, Liu C, Hillion J, Belton A, Huso DL, Resar LM. 2012. HMGA1 reprograms somatic cells into pluripotent stem cells by inducing stem cell transcriptional networks. PLoS One 7:e48533. doi:10.1371/journal.pone.0048533.
- Young RA. 2011. Control of the embryonic stem cell state. Cell 144:940–954.
- Zhang Y, Cooke M, Panjwani S, Cao K, Krauth B, Ho PY, Medrzycki M, Berhe DT, Pan C, McDevitt TC, Fan Y. 2012. Histone h1 depletion impairs embryonic stem cell differentiation. PLoS Genet. 8:e1002691. doi:10.1371/journal.pgen.1002691.
- Catez F, Hock R. 2010. Binding and interplay of HMG proteins on chromatin: lessons from live cell imaging. Biochim. Biophys. Acta 1799:15–27.
- Catez F, Ueda T, Bustin M. 2006. Determinants of histone H1 mobility and chromatin binding in living cells. Nat. Struct. Mol. Biol. 13:305–310.
- Woodcock CL, Skoultchi AI, Fan Y. 2006. Role of linker histone in chromatin structure and function: H1 stoichiometry and nucleosome repeat length. Chromosome Res. 14:17–25.
- Bianchi ME, Agresti A. 2005. HMG proteins: dynamic players in gene regulation and differentiation. Curr. Opin. Genet. Dev. 15:496–506.
- Bustin M. 1999. Regulation of DNA-dependent activities by the functional motifs of the high-mobility-group chromosomal proteins. Mol. Cell. Biol. 19:5237–5246.
- Rochman M, Postnikov Y, Correll S, Malicet C, Wincovitch S, Karpova TS, McNally JG, Wu X, Bubunenko NA, Grigoryev S, Bustin M. 2009. The interaction of NSBP1/HMGN5 with nucleosomes in euchromatin counteracts linker histone-mediated chromatin compaction and modulates transcription. Mol. Cell 35:642–656.
- Bustin M, Catez F, Lim JH. 2005. The dynamics of histone H1 function in chromatin. Mol. Cell 17:617–620.
- Alfonso PJ, Crippa MP, Hayes JJ, Bustin M. 1994. The footprint of chromosomal proteins HMG-14 and HMG-17 on chromatin subunits. J. Mol. Biol. 236:189–198.
- Kato H, van Ingen H, Zhou BR, Feng H, Bustin M, Kay LE, Bai Y. 2011. Architecture of the high mobility group nucleosomal protein 2-nucleosome complex as revealed by methyl-based NMR. Proc. Natl. Acad. Sci. U. S. A. 108:12283–12288.
- Pogna EA, Clayton AL, Mahadevan LC. 2010. Signalling to chromatin through post-translational modifications of HMGN. Biochim. Biophys. Acta 1799:93–100.
- Weisbrod S, Weintraub H. 1979. Isolation of a subclass of nuclear proteins responsible for conferring a DNase I-sensitive structure on globin chromatin. Proc. Natl. Acad. Sci. U. S. A. 76:630–634.
- Rattner BP, Yusufzai T, Kadonaga JT. 2009. HMGN proteins act in opposition to ATP-dependent chromatin remodeling factors to restrict nucleosome mobility. Mol. Cell 34:620–626.
- Dutta A, Workman JL. 2012. Nucleosome positioning: multiple mechanisms toward a unifying goal. Mol. Cell 48:1–2.
- Yen K, Vinayachandran V, Batta K, Koerber RT, Pugh BF. 2012. Genome-wide nucleosome specificity and directionality of chromatin remodelers. Cell 149:1461–1473.
- Cuddapah S, Schones DE, Cui K, Roh TY, Barski A, Wei G, Rochman M, Bustin M, Zhao K. 2011. Genomic profiling of HMGN1 reveals an association with chromatin at regulatory regions. Mol. Cell. Biol. 31:700–709.
- Rochman M, Taher L, Kurahashi T, Cherukuri S, Uversky VN, Landsman D, Ovcharenko I, Bustin M. 2011. Effects of HMGN variants on the cellular transcription profile. Nucleic Acids Res. 39:4076–4087.
- Hock R, Furusawa T, Ueda T, Bustin M. 2007. HMG chromosomal proteins in development and disease. Trends Cell Biol. 17:72–79.
- Mohamed OA, Bustin M, Clarke HJ. 2001. High-mobility group proteins 14 and 17 maintain the timing of early embryonic development in the mouse. Dev. Biol. 229:237–249.
- Körner U, Bustin M, Scheer U, Hock R. 2003. Developmental role of HMGN proteins in Xenopus laevis. Mech. Dev. 120:1177–1192.
- Fenouil R, Cauchy P, Koch F, Descostes N, Cabeza JZ, Innocenti C, Ferrier P, Spicuglia S, Gut M, Gut I, Andrau JC. 2012. CpG islands and GC content dictate nucleosome depletion in a transcription-independent manner at mammalian promoters. Genome Res. 22:2399–2408.
- Sadeh R, Allis CD. 2011. Genome-wide “re”-modeling of nucleosome positions. Cell 147:263–266.
- Teif VB, Vainshtein Y, Caudron-Herger M, Mallm JP, Marth C, Hofer T, Rippe K. 2012. Genome-wide nucleosome positioning during embryonic stem cell development. Nat. Struct. Mol. Biol. 19:1185–1192.
- Bryja V, Bonilla S, Cajanek L, Parish CL, Schwartz CM, Luo Y, Rao MS, Arenas E. 2006. An efficient method for the derivation of mouse embryonic stem cells. Stem Cells 24:844–849.
- Birger Y, West KL, Postnikov YV, Lim JH, Furusawa T, Wagner JP, Laufer CS, Kraemer KH, Bustin M. 2003. Chromosomal protein HMGN1 enhances the rate of DNA repair in chromatin. EMBO J. 22:1665–1675.
- Cherukuri S, Hock R, Ueda T, Catez F, Rochman M, Bustin M. 2008. Cell cycle-dependent binding of HMGN proteins to chromatin. Mol. Biol. Cell 19:1816–1824.
- Gentleman RC, Carey VJ, Bates DM, Bolstad B, Dettling M, Dudoit S, Ellis B, Gautier L, Ge Y, Gentry J, Hornik K, Hothorn T, Huber W, Iacus S, Irizarry R, Leisch F, Li C, Maechler M, Rossini AJ, Sawitzki G, Smith C, Smyth G, Tierney L, Yang JY, Zhang J. 2004. Bioconductor: open software development for computational biology and bioinformatics. Genome Biol. 5:R80. doi:10.1186/gb-2004-5-10-r80.
- Gautier L, Cope L, Bolstad BM, Irizarry RA. 2004. affy—analysis of Affymetrix GeneChip data at the probe level. Bioinformatics 20:307–315.
- Wilson CL, Miller CJ. 2005. Simpleaffy: a BioConductor package for Affymetrix quality control and data analysis. Bioinformatics 21:3683–3685.
- Bolstad BM, Irizarry RA, Astrand M, Speed TP. 2003. A comparison of normalization methods for high density oligonucleotide array data based on variance and bias. Bioinformatics 19:185–193.
- Langmead B, Trapnell C, Pop M, Salzberg SL. 2009. Ultrafast and memory-efficient alignment of short DNA sequences to the human genome. Genome Biol. 10:R25. doi:10.1186/gb-2009-10-3-r25.
- Zang C, Schones DE, Zeng C, Cui K, Zhao K, Peng W. 2009. A clustering approach for identification of enriched domains from histone modification ChIP-Seq data. Bioinformatics 25:1952–1958.
- Abuhatzira L, Shamir A, Schones DE, Schaffer AA, Bustin M. 2011. The chromatin-binding protein HMGN1 regulates the expression of methyl CpG-binding protein 2 (MECP2) and affects the behavior of mice. J. Biol. Chem. 286:42051–42062.
- Furusawa T, Cherukuri S. 2010. Developmental function of HMGN proteins. Biochim. Biophys. Acta 1799:69–73.
- Kim YC, Gerlitz G, Furusawa T, Catez F, Nussenzweig A, Oh KS, Kraemer KH, Shiloh Y, Bustin M. 2009. Activation of ATM depends on chromatin interactions occurring before induction of DNA damage. Nat. Cell Biol. 11:92–96.
- Huang DW, Sherman BT, Lempicki RA. 2009. Systematic and integrative analysis of large gene lists using DAVID bioinformatics resources. Nat. Protoc. 4:44–57.
- Melcer S, Hezroni H, Rand E, Nissim-Rafinia M, Skoultchi A, Stewart CL, Bustin M, Meshorer E. 2012. Histone modifications and lamin A regulate chromatin protein dynamics in early embryonic stem cell differentiation. Nat. Commun. 3:910. doi:10.1038/ncomms1915.
- Meshorer E, Yellajoshula D, George E, Scambler PJ, Brown DT, Misteli T. 2006. Hyperdynamic plasticity of chromatin proteins in pluripotent embryonic stem cells. Dev. Cell 10:105–116.
- Bult CJ, Eppig JT, Blake JA, Kadin JA, Richardson JE. 2013. The mouse genome database: genotypes, phenotypes, and models of human disease. Nucleic Acids Res. 41:D885–D891.
- Pruitt KD, Tatusova T, Brown GR, Maglott DR. 2012. NCBI Reference Sequences (RefSeq): current status, new features and genome annotation policy. Nucleic Acids Res. 40:D130–D135.
- Guenther MG, Levine SS, Boyer LA, Jaenisch R, Young RA. 2007. A chromatin landmark and transcription initiation at most promoters in human cells. Cell 130:77–88.
- Jin C, Zang C, Wei G, Cui K, Peng W, Zhao K, Felsenfeld G. 2009. H3.3/H2A.Z double variant-containing nucleosomes mark ‘nucleosome-free regions’ of active promoters and other regulatory regions. Nat. Genet. 41:941–945.
- Catez F, Brown DT, Misteli T, Bustin M. 2002. Competition between histone H1 and HMGN proteins for chromatin binding sites. EMBO Rep. 3:760–766.
- Bustin M. 2001. Chromatin unfolding and activation by HMGN(*) chromosomal proteins. Trends Biochem. Sci. 26:431–437.
- Ballaré C, Castellano G, Gaveglia L, Althammer S, Gonzalez-Vallinas J, Eyras E, Le Dily F, Zaurin R, Soronellas D, Vicent GP, Beato M. 2013. Nucleosome-driven transcription factor binding and gene regulation. Mol. Cell 49:67–79.
- Belova GI, Postnikov YV, Furusawa T, Birger Y, Bustin M. 2008. Chromosomal protein HMGN1 enhances the heat shock-induced remodeling of Hsp70 chromatin. J. Biol. Chem. 283:8080–8088.
- Lim JH, Bustin M, Ogryzko VV, Postnikov YV. 2002. Metastable macromolecular complexes containing high mobility group nucleosome-binding chromosomal proteins in HeLa nuclei. J. Biol. Chem. 277:20774–20782.
- Postnikov YV, Kurahashi T, Zhou M, Bustin M. 2012. The nucleosome binding protein HMGN1 interacts with PCNA and facilitates its binding to chromatin. Mol. Cell. Biol. 32:1844–1854.
- Masaoka A, Gassman NR, Kedar PS, Prasad R, Hou EW, Horton JK, Bustin M, Wilson SH. 2012. HMGN1 protein regulates poly(ADP-ribose) polymerase-1 (PARP-1) self-PARylation in mouse fibroblasts. J. Biol. Chem. 287:27648–27658.
- Ueda T, Furusawa T, Kurahashi T, Tessarollo L, Bustin M. 2009. The nucleosome binding protein HMGN3 modulates the transcription profile of pancreatic beta cells and affects insulin secretion. Mol. Cell. Biol. 29:5264–5276.
- Birger Y, Catez F, Furusawa T, Lim JH, Prymakowska-Bosak M, West KL, Postnikov YV, Haines DC, Bustin M. 2005. Increased tumorigenicity and sensitivity to ionizing radiation upon loss of chromosomal protein HMGN1. Cancer Res. 65:6711–6718.