Abstract
The DNA transposon piggyBac is widely used as a tool in mammalian experimental systems for transgenesis, mutagenesis, and genome engineering. We have characterized genome-wide insertion site preferences of piggyBac by sequencing a large set of integration sites arising from transposition from two separate genomic loci and a plasmid donor in mouse embryonic stem cells. We found that piggyBac preferentially integrates locally to the excision site when mobilized from a chromosomal location and identified other nonlocal regions of the genome with elevated insertion frequencies. piggyBac insertions were associated with expressed genes and markers of open chromatin structure and were excluded from heterochromatin. At the nucleotide level, piggyBac prefers to insert into TA-rich regions within a broader GC-rich context. We also found that piggyBac can insert into sites other than its known TTAA insertion site at a low frequency (2%). Such insertions introduce mismatches that are repaired with signatures of host cell repair pathways. Transposons could be mobilized from plasmids with the observed noncanonical flanking regions, indicating that piggyBac could generate point mutations in the genome.
INTRODUCTION
DNA transposons are DNA segments that can mobilize in a host genome autonomously. Their mobilization is catalyzed by a transposase enzyme which recognizes the transposon inverted terminal repeats (ITRs), cuts the DNA transposon from where it resides, and pastes it into a new location. The transposase can be supplied in trans, catalyzing the mobilization of DNA transposons harboring any DNA cargo. These properties have stimulated the development and use of these molecular vehicles in a wide range of organisms. However, the use of DNA transposons in mammalian genomes was impeded for many years due to the lack of active elements. The reactivation of a Tc1/mariner-like element, Sleeping Beauty, initiated the development of transposon technologies in mammalian systems (Citation1). The repertoire of transposons for mammalian applications has been expanded by the discovery and development of several other elements from different transposon superfamilies. piggyBac (PB), originally isolated from the cabbage looper moth Trichoplusia ni (Citation2) and a founder member of the PB superfamily, consistently exhibits high transposition efficiency in different cell lines and organisms (Citation3). Among all the known DNA transposons, PB is unique in its ability to transpose with a cargo of up to 100 kb (Citation4), in mobilizing without leaving so-called footprint mutations at the excision site (Citation2), and in the tolerance of the transposase to engineering (Citation5, Citation6). By utilizing these unique characteristics, PB has been developed into an invaluable tool for a wide range of applications, such as stable gene delivery and removal to generate transgene-free induced pluripotent stem cells (Citation7, Citation8), genome engineering (Citation9), and insertional mutagenesis in cell culture and mice (Citation10Citation–Citation16).
The increasingly broad applications of PB in both genetic and genomic research and gene therapy demand a deep understanding of PB mobilization characteristics. Several studies have investigated the genome-wide integration patterns of PB in different cell types, by mobilizing PB from a donor plasmid into a host genome. It has been shown that PB integration requires a TTAA recognition sequence and exhibits a bias toward insertions in genes, promoter regions, and DNase I-hypersensitive sites (Citation17Citation–Citation19). However, relatively little is known about the kinetics of the transposition process and the integration characteristics when a preintegrated transposon is mobilized from the genome (intragenomic mobilization). Rare insertion of PB into noncanonical (i.e., not TTAA) sites has recently been observed (Citation20), but PB excision, reintegration, and postintegration repair from such sites have not been investigated in vivo.
To address these questions, we developed an inducible PB intragenomic mobilization system in mouse embryonic stem (ES) cells. We also established a customized and multiplexed sequencing platform to identify many PB integration sites in parallel. The combination of the two technologies enabled us to fully characterize the PB genomic mobilization profiles and to illuminate novel features of PB transposition and transposon-host interactions.
MATERIALS AND METHODS
Plasmid construction.
The generation of Rosa26-LSL-mPB-L3-ERT2, Gdf9PB, and HprtPB targeting vectors is described in the supplemental material. To construct the plasmid-borne PB transposons flanked by non-TTAA sites, PB-PuroΔTK was constructed by cloning the Pgk-puroΔTK cassette from pFlexible (Citation21) into pA1 (Citation15). Point mutations were generated using QuikChange II site-directed mutagenesis (Agilent) with the primers shown in Table S5 in the supplemental material. Plasmids with two variant ends were constructed by conventional cloning methods from the single-end variants.
ES cell culture and cell line generation.
Mouse ES cells were cultured and transfected by electroporation as described in reference Citation22. Briefly, AB1 ES cells (129S7/SvEvBrd-Hprt+; Hprt+/Y) were cultured on gamma-irradiated SNLP76/7-4 feeder cells in M15 medium (knockout Dulbecco modified Eagle medium, 15% fetal bovine serum, 2 mM l-glutamine, 0.1 mM 2-mercaptoethanol). For gene targeting, 1 × 10⁷ cells were electroporated with 25 μg of a linearized vector. Drug-resistant colonies were picked and screened by PCR and verified by Southern blotting. The primer sequences are shown in Table S5 in the supplemental material.
Upon completion of R26mPBERT2 targeting, the LoxP-Stop-LoxP cassette was subsequently removed by electroporation of 1 × 10⁷ cells with 10 μg CAG-Cre plasmid (gift from Haydn Prosser, Wellcome Trust Sanger Institute) to give rise to R26-mPBERT2 cells (R26mPBERT2; Hprt+/Y). One thousand cells were plated postelectroporation in 10-cm culture dishes and cultured in M15 medium. Twenty-four colonies were picked and validated by PCR and Southern blotting (see Fig. S1 in the supplemental material).
For selection of spontaneously inactivated Hprt in R26-mPBERT2 cells, 20 10-cm dishes with 2 × 10⁵ R26-mPBERT2 cells per dish were selected with 10 μM 6-thioguanine (6-TG). Five clones were obtained and one clone was expanded, giving rise to R26-mPBERT2-Hprt− cells (R26mPBERT2/+ Hprt−/Y). The Hprt-PB and Gdf9-PB cell lines were generated by gene targeting of R26-mPBERT2 cells and R26-mPBERT2-Hprt− cells with HprtPB and Gdf9PB targeting vectors, respectively.
4-OHT time course experiment.
For mPBaseERT2 induction, 5 × 10⁵ Hprt-PB and Gdf9-PB cells were plated per one well of a six-well plate and were treated with 1 μM 4-hydroxytamoxifen (4-OHT; H7904; Sigma) for the appropriate time. Upon completion of the treatment, the cells were washed twice with phosphate-buffered saline (PBS). For Western blot analysis, the cells were harvested for further nuclear extraction. For colony formation and Illumina sequencing, the cells were returned to M15 medium for 3 days, and one-eighth of the cells were replated in a 10-cm dish and selected with hypoxanthine-aminopterin-thymidine (HAT) and puromycin (3 μg/ml) for 7 days. In order to obtain a similar number of integration sites for each time point, four independent experiments were conducted for the 0.5-, 1-, 2-, and 4-h treatments and two experiments were performed for the 8- and 24-h time points. The colonies were counted prior to trypsinization. Pooled colonies for each time point were lysed overnight at 55°C in lysis buffer (50 mM Tris-HCl [pH 8.0], 5 mM EDTA [pH 8.0], 200 mM NaCl, 1% [wt/vol] SDS, 0.1 mg/ml proteinase K), and the genomic DNA was extracted by isopropanol precipitation. For the mPBaseERT2 nucleus clearance experiment, 5 × 10⁵ cells were treated with 1 μM 4-OHT for 24 h, washed twice with PBS, and returned to M15 medium for 1, 2, 4, 8, or 24 h before harvest for nuclear extraction.
Plasmid-borne transposon integration.
To generate plasmid-to-genome PB integrations, NN5 ES cells (Citation23) were electroporated with a PB donor (TNP, Pgk-puroΔ TK flanked by PB ITRs, 100 ng [Citation12]) and CMV-mPBase expression plasmids (10 μg). NN5 cells are Blm deficient; however, we did not observe any effect of Blm deficiency on the integration profile (data not shown). Cells with PB integrations were selected using puromycin, and colonies were pooled and sequenced as described above.
For non-TTAA-flanking PB integration, 2.5 × 10⁶ JM8A3 ES cells (Citation24) were electroporated with 5 μg donor plasmid and either 10 μg CMV-hyPBase (Citation25) or 10 μg control CAGGS-green fluorescent protein and selected under puromycin at 24 h postelectroporation. For insertion site mapping, 1 μg of non-TTAA-flanking transposon plasmid was used to increase the proportion of single-copy insertions (Citation12). DNA fragments were amplified by Splinkerette PCR from DNA prepared from individual puromycin-resistant colonies (Citation14).
Nuclear protein extraction and Western blot analysis.
After 4-OHT treatment, the nuclear protein was extracted using an NE-PER nuclear protein extraction kit (78835; Thermo Scientific). The nuclear protein was separated using a 4 to 12% gradient gel (Invitrogen) and transferred onto a nitrocellulose membrane. Duplicate blots were analyzed with anti-ERT2 (sc-56846; Santa Cruz) or anti-lamin B1 (332000; Invitrogen) antibody.
Transposon integration site mapping.
Transposon-genome junction fragments with Illumina sequencing adaptors were prepared and specifically amplified using a modified TraDIS protocol (Citation4). Briefly, genomic DNA was sheared by focused sonication (Covaris) with fragment sizes of about 200 to 400 bp. Illumina adaptors were ligated after end repair and PCR amplified with transposon- and adaptor-specific primers. We sequenced 76 bp at each end of the resulting fragments. The sequencing primers are as previously described (Citation4).
We processed sequences by checking for a genuine transposon-genome junction and removing PCR duplicates prior to mapping to the NCBIM37 mouse genome assembly using SSAHA2 (Citation26) or Smalt (www.sanger.ac.uk/resources/software/smalt) software. The number of reads mapped to the identical insertion site is represented as coverage. For genomic mobilization, transposon-genome junctions at both the PB 5′ and PB 3′ ITRs were sequenced. As we have observed low-level cross-contamination (typically, <10 reads) between bar-coded sequencing libraries, we assigned insertion sites to the sample with the highest average coverage at both ends.
Association with genomic features.
The exon, intron, gene, and intergenic region data were obtained from Ensembl NCBIM37. The genomic region representing a gene is defined as the coordinates from the first base of exon 1 to the last base of the final exon. For each gene, only the longest isoform was used to avoid duplicative counts. The extended coding region was defined as the region extending 5 kb upstream and downstream of a gene. The intergenic region was defined as the genome interval between genes.
Chromatin domain and Hi-C data were obtained from Dixon et al. (Citation27). DNase I hypersensitivity data were obtained from Ensembl, histone modification and PolII occupancy data were obtained from Mikkelsen et al. (Citation28), lamina-associated domain (LAD) data were obtained from Peric-Hupkes et al. (Citation29), transcription factor binding data were obtained from Marson et al. (Citation30), and replication timing data were obtained from www.replicationdomain.org (Citation31). For replication timing analysis, we used the DNAcopy program (Citation32) to split the genome into discrete replication domains, as described, and defined early- and late-replicating regions as having log2 early and log2 late values of >0.5 and <−0.5, respectively. We obtained ES cell gene expression level categories based on single-cell RNA sequencing from Tang et al. (Citation33). To obtain the locations of TTAA sites, we used the NestedMICA program (Citation34) with a TTAA position weight matrix. To ensure that any observed differences from this distribution were not due to differences in mappability in different regions, we simulated paired end fragments at 100,000 of these TTAA sites and confirmed that the association with chromatin features was the same as that for randomly chosen TTAAs after mapping.
RESULTS
Generation of inducible mPBaseERT2 cell lines containing a single copy of transposon.
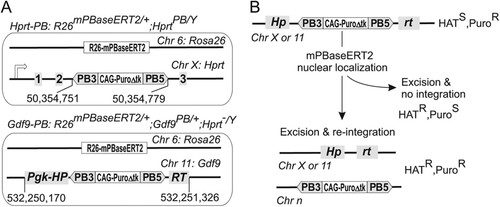
To investigate PB intragenomic mobilization, we engineered mouse ES cells with an inducible mammalian codon-optimized PB transposase (mPBaseERT2 [Citation5]) targeted to the Rosa26 locus, referred to as R26-mPBaseERT2 (; see Fig. S1 in the supplemental material). The ERT2 domain controls the nuclear localization of the mPBase protein. Upon exposure to 4-hydroxytamoxifen (4-OHT), mPBaseERT2 translocates from the cytoplasm to the nucleus (Citation35), where it catalyzes the transposition reaction. A PB transposon was further introduced by gene targeting to two genomic loci, Hprt and Gdf9, to give rise to the Hprt-PB and Gdf9-PB cell lines (see Fig. S2 in the supplemental material). For the Hprt-PB cell line (R26mPBaseERT2/+ HprtPB/Y), the targeted PB transposon resides in intron 2 of Hprt and disrupts its transcription (Citation25). Consequently, these cells are sensitive to HAT medium. Excision of the PB transposon from the donor site restores Hprt activity; thus, the resulting cells become HAT resistant. The PB transposon contains a promoter-driven puromycin-resistant cassette (CAG-PuroΔtk), allowing selection for reintegration events (). Therefore, HAT and puromycin dual selection recovers cells with the PB transposon excised and subsequently reintegrated elsewhere in the genome. In order to engineer a Gdf9-PB cell line with the same selection strategy, we isolated R26-mPBaseERT2 cells with a spontaneous inactivating mutation in the endogenous Hprt locus by 6-TG selection. Subsequently, the PB transposon flanked by a Pgk-HPRT cassette was targeted to the Gdf9 locus, giving rise to the Gdf9-PB cell line (R26mPBaseERT2/+ Gdf9PB/+ Hprt−/Y). PB transposon excision brings together the 5′ and 3′ parts of the Pgk-HPRT minigene, leading to hypoxanthine phosphoribosyltransferase (HPRT) expression and HAT resistance (; see Fig. S2 in the supplemental material). These cell lines enable us to investigate the kinetics and integration behaviors of a single-copy PB transposon residing in the host genome, following temporally controlled exposures to PB transposase.
Fig 1 Single-copy PB genomic mobilization system (A) and selection principle for PB reintegration (B). The genome coordinates in panel A are based on mouse genome assembly version NCBI37/mm9. Chr, chromosome; HATS, HAT susceptible; PuroR, puromycin resistant; HATR, HAT resistant; PuroS, puromycin susceptible.
PB chromosomal mobilization with different lengths of exposure to mPBase activity.
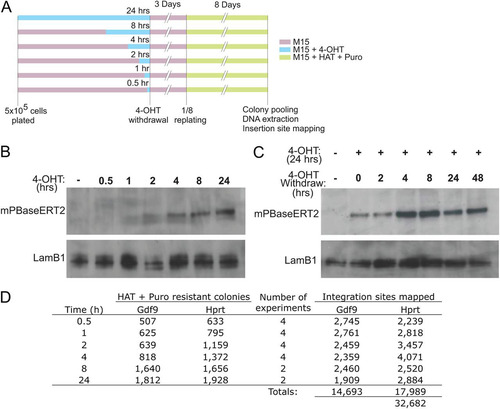
To characterize the mode of PB chromosomal transposition, we used the Hprt-PB and Gdf9-PB cell lines to conduct a time course experiment of mPBase exposure, in which the nuclear localization of the transposase is controlled by 4-OHT administration. We treated 5 × 10⁵ Hprt-PB and Gdf9-PB cells with 1 μm 4-OHT for 0, 0.5, 1, 2, 4, 8, and 24 h (). After 3 days of culture in a nonselective medium, we applied HAT and puromycin dual selection to enrich for ES cells with PB excised from the donor locus and reintegrated into a new genomic location. The presence of the mPBaseERT2 protein in the nuclear fraction could be observed by Western blotting within 2 h of 4-OHT treatment and onwards, suggesting a fast induction of mPBaseERT2 nuclear translocation (). However, we found that mPBase nuclear clearance upon 4-OHT removal occurred much more slowly. After 24 h of 4-OHT treatment, the mPBase protein persisted in the nucleus beyond 48 h after 4-OHT removal (). HAT and puromycin double-resistant colonies formed at all time points. With increasing length of 4-OHT treatment, the number of double-resistant colonies increased, indicating a growing number of donor-site excision events with prolonged mPBase activity (). In the absence of 4-OHT, no double-resistant colonies were obtained, thus demonstrating the tight regulation of the inducible system.
Fig 2 Transposition controlled by nuclear PBase accumulation. (A) 4-OHT treatment time course design; (B) accumulation of mPBase-ERT2 protein in the nucleus after 4-OHT treatment; (C) mPBase-ERT2 persists in the nucleus after 4-OHT withdrawal; (D) number of colonies and PB integration sites obtained from multiple experiments.
PB preferentially integrates close to the donor site.
Using the 4-OHT induction and dual selection scheme described above, we generated over 2,000 HAT- and puromycin-resistant colonies with both Hprt-PB and Gdf9-PB cell lines for each 4-OHT time point in several independent experiments (). The double-resistant colonies obtained from each time point were pooled, and the genomic DNA was extracted and subjected to Illumina sequencing. Fragments of DNA containing junctions between the genome and both PB 5′ and PB 3′ inverted terminal repeats (ITRs) were specifically amplified in the genomic library preparation and subsequently sequenced using a paired-end protocol (see Fig. S3 in the supplemental material) (Citation4). In total, we identified 63,240 transposon insertion sites. A set of high-confidence insertion sites (32,682 sites) comprised insertion sites with junction fragments from both ITRs of the transposon identified (; see Table S1 in the supplemental material). Insertion sites for which we could not identify both junction fragments were represented by fewer than 10 reads.
The genomic reintegration profiles for each cell line (Gdf9-PB and Hprt-PB) for all the 4-OHT time points showed similar global integration profiles, with a striking feature of local hopping on the donor chromosome (; see Fig. S4 in the supplemental material). The proportions of PB integrations mapping to the donor chromosome were 28% and 23% for the Gdf9 and Hprt loci, respectively. As male ES cells were used, all of the X chromosome insertions for Hprt must have been on the donor chromosome (in cis). However, since there are two copies of chromosome 11, only one of which is the transposon donor, transposons mobilized from Gdf9 that map to chromosome 11 could be in cis or trans. To estimate the frequency of reintegration on the trans chromosome 11, we used half of the frequency of reintegration observed on chromosome 11 from the Hprt donor (5.6%, i.e., 2.8% on each copy of chromosome 11). Applying this correction, we estimated that 90% of the reintegration events that mapped to chromosome 11 were in cis (4,128/4,543); hence, 28% of all Gdf9-mobilized transposons reintegrated on the same chromosome.
Fig 3 Local hopping behavior of PB. (A) Histogram showing the difference in integrations observed from each donor locus on chromosomes 11 and X. Results for chromosome 1, which did not contain a PB donor locus, are shown for comparison. y axis, number of insertions from Hprt minus number from Gdf9 in 50-kb windows; red arrows, PB donor sites. (B) Percentage of local reintegrations. (C) Gdf9 local reintegration profile with chromatin interaction domain boundaries annotated from Hi-C data (red). Black bars, number of PB reintegrations; blue horizontal bars, locations of genes, with the height indicating the expression level represented by the RNA sequence (RNA-seq) read number on a log10 scale.
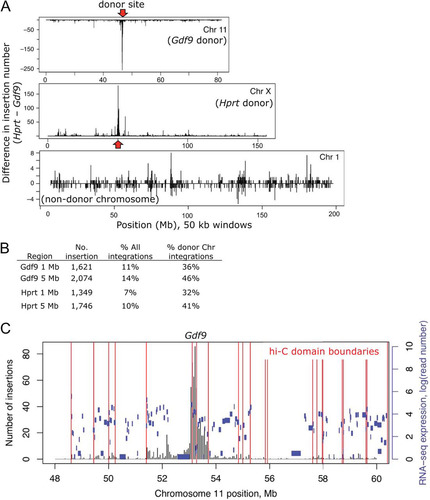
Of all donor chromosome reintegration events, 46% and 41% were within 5 Mb immediately surrounding the donor site for Gdf9 and Hprt, respectively (). The rest of the donor chromosome reintegrations were not uniformly distributed, with several peaks further away from the donor locus for both Gdf9 and Hprt transposition ().
To investigate whether higher-order organization of the donor chromosome might affect the distribution of transposon reintegration, we used a recently published Hi-C data set for mouse ES cells (Citation27). Hi-C is a method that probes the chromosomal conformation in three dimensions using proximity-based ligation coupled with massively parallel sequencing. This study showed that along the chromosome, discrete blocks of cis interactions can be mapped into domains on the basis of the high frequency of Hi-C interactions of the DNA sequences within, whereas interdomain DNA interactions occur at a lower frequency. In the case of Gdf9 transposition, we discovered that a discontinuity in the PB local hopping profile coincided with the positions of an interdomain boundary (). It is known that PB preferentially integrates into active genes (Citation3, Citation17), but genes in the adjacent domains had broadly similar expression levels (). For Hprt, the donor site was further from a domain boundary, and most local hopping was also confined to a single chromatin interaction domain (see Fig. S5A in the supplemental material).
For both Gdf9 and Hprt cases, we did not observe a strong correlation between observed interactions and the more distant peaks of cis reintegration on the donor chromosomes (see Fig. S5B and C in the supplemental material). Other than the donor chromosomes, the genome-wide reintegration profiles did not show any chromosome preferences, nor did observed Hi-C interactions correlate with insertion density (data not shown; see Fig. S5A in the supplemental material).
Regions with a high density of PB insertions.
With over 30,000 PB insertion sites mapped, we asked whether PB has preferential sites of integration in the host genome. Plotting the distribution of the number of insertions per 50-kb window across the genome revealed a tail in which some windows contained many insertions (). To refine this, we defined a hot spot as a region with an insertion density of greater than one per kilobase, with at least five insertions in total, and with the maximum distance between adjacent insertions being less than 5 kb. The donor chromosomes were excluded in this analysis. As our data set consisted of multiple independent mobilization experiments, we could also exclude secondary local hopping events as the cause of these hot spots. We identified 218 hot-spot regions in the mouse ES cell genome using these criteria, comprising a total of 1,876 sites (). Interestingly, the hot spot with the most insertion sites was located in the promoter region of the most highly expressed ES cell-specific microRNA (miRNA) cluster, mmu-miR-290∼295, which comprises 60 to 70% of total miRNAs in mouse ES cells (Citation30) (). Therefore, we investigated whether PB preferentially inserts into especially active regions of the genome.
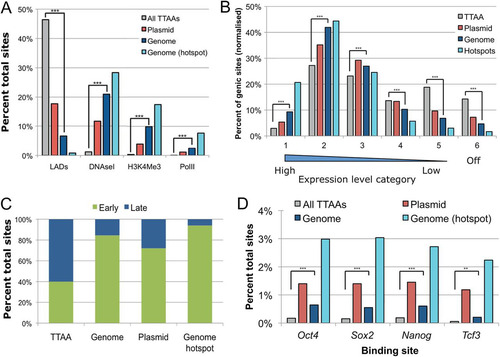
Fig 4 PB integration characters. (A) Histogram showing number of PB insertions per 50-kb window (excluding regions with no PB insertions). (Inset) The region with the most insertions close to the mmu-miR-290∼295 cluster on chromosome 7. Red marks denote insertion sites. (B) Association of PB insertions and TTAA sites with genes. ***, P < 2.2 × 10⁻¹⁶; the comparison shown is for random TTAA versus the genome donor, although the comparison with the plasmid donor is also significant in all cases. (C and D) Associations with exons and introns, respectively. *, P < 0.001; ***, P < 2.2 × 10⁻¹⁶; n.s., not significant.
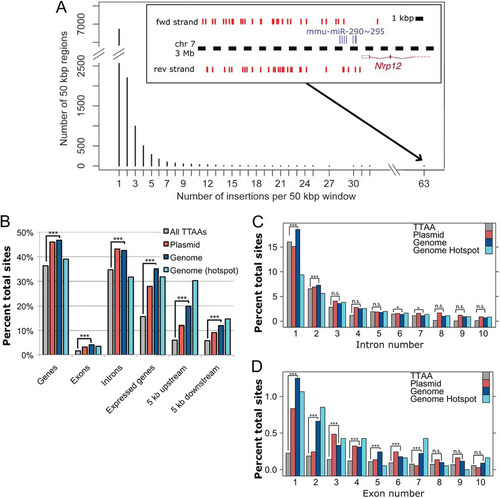
Table 1 Top 10 hits of PB insertion hot spotsTable Footnotea
PB integrations associate with markers of open chromatin.
To further characterize the insertion preferences, we investigated the PB insertions with respect to genes and chromatin structures. In addition to the genome mobilization data described above, we also conducted a plasmid-genome mobilization assay for comparison. We mapped a total of 3,714 integration sites from pooled puromycin-resistant colonies generated by cotransfection of ES cells with a PB donor plasmid containing a Pgk-puroΔ TK gene (TNP; 100 ng) (Citation12) and a CMV-mPBase plasmid (10 μg). We also generated a list of all TTAA positions in the reference genome to be used as a null distribution, which is the distribution that would be expected if there was no insertion preference beyond the primary sequence of TTAA.
More PB insertions than would be expected if the choice of TTAA site was random were present in coding regions, in particular, expressed genes and extended regions of genes (up to 5 kb both up- and downstream from the coding region) (). PB integration hot spots were particularly concentrated in the 5′ upstream regions of genes. When investigating the intragenic integrations further, we observed that integrations in exons were more frequent than would be expected by chance (P < 2.2 × 10⁻¹⁶, binomial test), with 5′ exons harboring more integrations than exons toward the 3′ end of a gene (). For introns, there was no pronounced preference for 5′ or 3′ introns ().
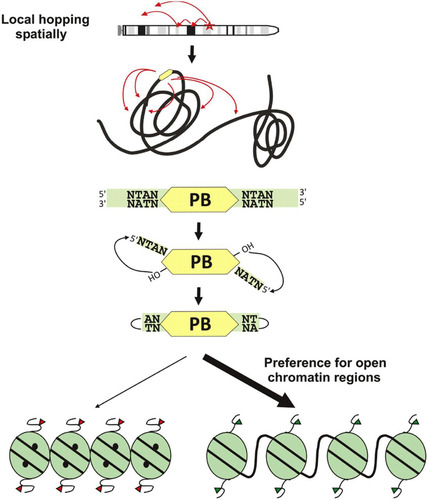
We next characterized the PB integration pattern with respect to mouse ES cell chromatin states. Compared to the control TTAA set, PB integration sites generated with both methods showed prominent enrichment within regions of the genome associated with DNase I-hypersensitive sites and with trimethylation of histone H3 lysine 4 (H3K4Me3) and within RNA polymerase II (PolII)-bound regions (). Insertions in hot spots showed an even greater association with these features representing open chromatin. PB also integrated more frequently into genes with higher expression levels in ES cells, and genes in PB hot spots were more likely to be highly expressed (). The reverse was also true: PB integration sites were largely depleted in lamina-associated domains (LADs), which are heterochromatic regions of the genome located at the nuclear periphery () (Citation29). At the Hprt donor locus, PB insertions were excluded from a cluster of unexpressed genes in a region of otherwise high insertion density due to the local hopping (see Fig. S4b in the supplemental material). PB insertions showed a strong preference for early-replicating regions of the genome, with over 85% of total PB insertions generated from the genomic mobilization falling in these regions (). Early-replicating regions correlate with cytological observations of euchromatin and are high in gene density and CpG islands (Citation31, Citation36). In addition, regions of the genome bound by active transcription factors, such as the core pluripotency factors in ES cells (Oct4, Sox2, Nanog, and Tcf3), also showed marked enrichment (P < 10−12, binomial test) (). These effects were all magnified for insertions in hot-spot regions. The preference was less pronounced in the PB plasmid-to-genome data set than the intragenomic mobilization data set. The fraction of PB insertions in each feature type was reproducible between independent experiments in the time course, irrespective of the donor locus, and was not due to mapping bias (see Fig. S6 in the supplemental material). Taken together, these results show that PB integration is not random. It has an affinity for open chromatin and avoids closed chromatin structures, irrespective of the method of transposon delivery.
Fig 5 PB integration preferences for chromatin features. Association of PB insertions with chromatin features (A) and with expressed genes (B). PB insertions are enriched in early-replicating regions of the genome (C) and at binding sites of transcription factors regulating ES cell pluripotency (D). ***, P < 2.2 × 10⁻¹⁶; **, P < 10−12, binomial test; the comparison shown is for random TTAA versus the genome donor.
Implications for genome coverage of PB insertions.
As PB has become a widely used insertional mutagen, we used our data to investigate how the hit rate for new genes varies as more insertions are analyzed. This would allow an estimation of the number of mutants required to saturate the genome to be made more accurately. We calculated the cumulative frequency of genes hit for the entire genome-mobilized data set (excluding donor chromosomes), assuming that all insertions are independent. We also analyzed the data at individual time points where insertion sites were independent of each other. Both analyses produced similar results (see Fig. S7 in the supplemental material).
For our 23,875 insertions that were not on the relevant donor chromosome (of which 12,203 were in genes), 6,112 unique genes were hit (see Fig. S7 in the supplemental material). The rate of hitting new genes, expressed as the number of new genes trapped per insertion, was close to 1 for the first 1,500 insertions in genes but decreased to about 0.3 after 12,000 insertions in genes. As expected, expressed genes were hit at a higher rate than unexpressed genes. The decrease in the rate of hitting a new gene was observed only when large numbers of PB integrations were analyzed, as it could not be seen in the smaller plasmid-to-genome data set (see Fig. S7 in the supplemental material).
Non-TTAA insertion sites and neighboring genomic sequence preference of PB.
On close examination, we found that 1.5% of sequencing reads that contained the distal end of the transposon were followed by a non-TTAA site. This confirmed that PB can insert into sites other than TTAA, predominantly CTAA/TTAG and ATAA/TTAT. Other sites of the form xTAz, where x and z represent any two nucleotides, were also identified at very low frequencies (; see Table S2 in the supplemental material). As the central TA was conserved and the integration sites were confirmed by sequencing of both PB 5′ and PB 3′ ITR-genomic junctions, this observation is unlikely to be due to sequencing errors. Another recent study has also noted such non-TTAA integration sites (Citation20).
Fig 6 Identification of non-TTAA integration sites and integration site sequence context. (A) Distribution of TTAA and non-TTAA insertion sites mapped. (B) Low-GC environment of PB insertion sites. Average percent AT contents are shown for each base surrounding the insertion site for TTAA and CTAA insertion sites.
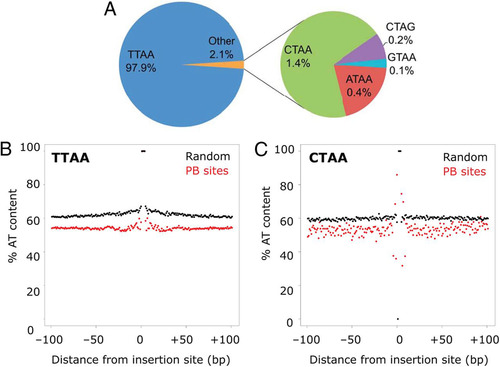
To test whether the local genomic sequence influences PB insertion sites, we compared the base compositions of 100 bp of sequence on either side of all the identified TTAA and CTAA insertion sites (the most common non-TTAA site observed; ). The AT content in the sequence immediately adjacent to the insertion site was higher than that in sequences at randomly chosen sites, although TTAA (but not CTAA) sites tended to be surrounded by AT-rich sequences. The overall GC content of the surrounding sequence was higher (50% compared to 40%; and ). This further suggests that PB target sites are in GC-rich regions, such as promoters or coding regions.
Noncanonical PB insertion repair.
On the basis of previous in vitro biochemical analysis, an excised PB transposon flanked by TTAA sites should have 5′ TTAA overhangs (Citation37) and non-TTAA site insertion of PB would result in mismatched bases at either end of the transposon. By analyzing the genome-PB ITR junction sequence from both ends of the transposon, the mismatch repair outcome upon transposon insertion into non-TTAA sites could be revealed (). We first identified reads from one end of the transposon where we observed non-TTAA insertion sites for an exact match to the reference genome. For this set of insertions, we can be confident that the transposon inserted into a non-TTAA site, ruling out the possibility of sequence variants between the reference genome (C57BL/6J) and the ES cells used (129S7). We subsequently identified the insertion site sequence in reads from the other end of the transposon mapping to the same genomic position. We also observed the reverse complement of the non-TTAA site (e.g., TTAG for CTAA sites, depending on the orientation of the insertion) and TTAA sites in these reads. This implies that a mismatch is introduced and can be repaired to either the genomic sequence (e.g., CTAA) or the transposon sequence TTAA ().
Fig 7 PB can insert into non-TTAA sites. (A) Excision and integration mechanism of PB, based on in vitro study. Insertion into CTAA, as identified in read A, is used as an example. Two repair possibilities seen in read B (TTAA and TTAG, read 5′ to 3′) are shown. (B) Mismatch repair outcome for CTAA and ATAA insertions. Repair outcome of the predicted mismatches, written as transposon base/genome base. Sequences are given 5′ to 3′ as they appear in the sequencing read. T/T and A/A mismatches are generated upon ATAA insertion, whereas T/G and A/C are generated for CTAA insertion. (C) Influence of PB ITRs on the repair outcome. Mismatch, the observed mismatch adjacent to the specified PB ITR; repair to, number of repairs to A·T (transposon sequence) and G·C (genomic sequence); % host, percentage of events repaired to genomic sequence; P value, P value determined by Fisher's exact test for statistical significance of influence of PB ITRs over each type of mismatch repair outcome.
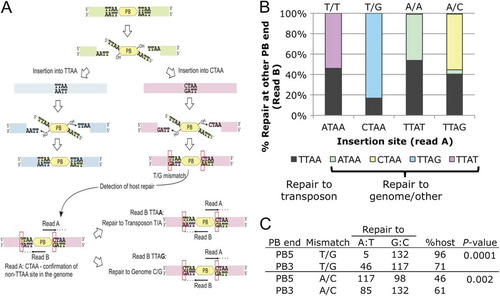
We decided to focus on investigating the repair outcome for integrations into CTAA and ATAA, as these two sites comprised the majority of non-TTAA integrations (). For transposons flanked by TTAA integrating into CTAA sites, T/G (transposon sequence/genomic sequence) and A/C mismatches were generated in the sequence flanking the transposon (). For integration into ATAA sites, T/T and A/A mismatches were generated. For CTAA insertion repair, we observed a striking bias of T/G repair to C·G (base pair) in 84% of cases, representing the repair to the genomic sequence (). No strong preference for the transposon or genome sequence was observed, either for A/C mismatches at TTAG sites (reverse complement of CTAA) or for T/T or A/A mismatches at ATAA and TTAT (reverse orientation of ATAA) sites (). For A/C mismatches at TTAG and CTAG sites, repair to T·A (base pair) was also seen at a low frequency. However, all of the 19 sites at which this occurred also showed reads mapping to the same position with repair to G·C (CTAX in read B) and in some cases also to A·T (see Table S3 in the supplemental material).
Since PB has distinct 5′ and 3′ ITRs, we investigated whether different PB integration orientations can affect the repair outcome. We separated the number of CTAA repair events to either the genomic sequence or transposon sequence for T/G and A/C mismatches on the basis of their adjacent PB ITRs. The nature of PB ITRs significantly affected whether the repair outcome was a genomic or transposon sequence ().
To test whether PB insertions at non-TTAA positions are mobile, we synthesized non-TTAA-flanking PB in various combinations (see Fig. S8 in the supplemental material). Surprisingly, all the combinations tested were mobile in ES cells when cotransfected with a PBase plasmid (). The frequencies were comparable to those observed for a transposon mobilized from a TTAA site, except for PB mobilization from plasmids NC3 and NC6 (). To investigate the insertion site preference of the transposons excised from the non-TTAA flanking sequences, we identified the genomic integration sites for individual colonies and found that all insertion sites analyzed (n = 89) were TTAA, except for one TTAG site from the PB 5′ ITR-TTAG plasmid (NC2).
Fig 8 Mobilization and mismatch repair of PB transposons flanked by non-TTAA sites. (A) Plasmid mobilization of non-TTAA-flanked PB transposons with the indicated ends in wild-type cells. The predicted mismatches upon PB insertion into a TTAA site are shown below each plasmid sequence. Colonies were counted from separate low-density platings (n = 4). Error bars show SEMs. ns, not significant; *, **, and ***, P < 0.05, 0.01, and 0.001, respectively (two-tailed t test). (B) Repair outcome of mismatches caused by transposition of variant plasmids in wild-type (W.T.; plasmids NC2 to NC6) and Msh2 mutant (plasmid NC5 only) ES cells. Mismatches are written as transposon base/genome base. Mixed, number of mixed insertion site traces observed as shown in panel C, which are counted in the GC repair column. (C) Example of a sequencing trace (C and T coexist at position 11) showing two different repair outcomes mapping to the same genome position.
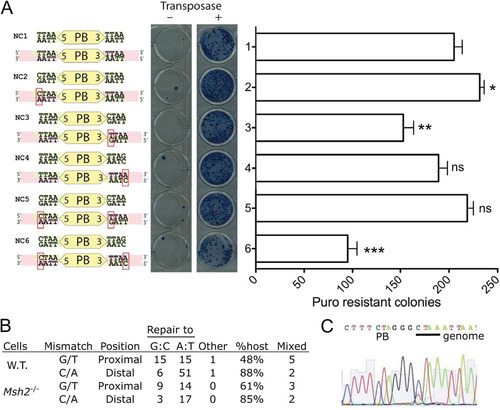
The non-TTAA PB integration experiment described above also allowed us to observe the repair outcome of C/A and G/T mismatches in the context of plasmid-to-genome transposition. For G/T mismatches, for which only the PB3′ ITR was tested, there was no preference for repair to either T·A (genomic sequence) or G·C (transposon sequence) (). C/A mismatches were repaired to T·A (genomic sequence) in 88% of cases (). In eight cases of repair to the plasmid variant, we saw evidence from the sequencing trace that the genomic repair product was also present (); thus, some mismatches may remain unrepaired until DNA replication.
In a similar experiment using Msh2−/− ES cells (Citation38) cotransfected with plasmid NC5, which causes both C/A and G/T mismatches (), and PBase, we observed a similar pattern of repair with no statistical significance by Fisher's exact test (C/A, P = 0.69; G/T, P = 0.58), indicating that repair of these lesions is not governed by the canonical mismatch repair pathway (). All insertion sites in this experiment were TTAA sites in the reference genome, and we did not observe any deletion or mutation relative to the sequence of the reference genome at these sites.
DISCUSSION
Kinetics of PB transposition.
We generated two mouse ES cell lines each containing a single-copy PB transposon at a different locus and investigated the resulting distribution of insertion sites when this transposon was mobilized. The integration pattern observed may be the result of one round of transposition or may reflect several rounds of excision and reintegration. These two modes of transposition can be distinguished by following the transposition kinetics. If ongoing transposition occurs after initial excision from the donor locus, transient exposure to the PBase will result in localized PB reintegration surrounding the donor site, with longer exposure leading to a wider distribution of insertions. However, if the random distribution pattern results from direct genome-wide integration, different lengths of exposure to mPBase will not alter this distribution profile. Although we observed the latter case in this experiment, the prolonged nuclear retention of mPBase-ERT2 in the absence of 4-OHT does not provide a PBase exposure sufficiently short to resolve the two possibilities.
PB integration site preferences.
Our results clearly demonstrate that PB displays local hopping extensively at the donor site and along the entire donor chromosome. Previous studies either have not observed PB local hopping at all in mammalian cells or have observed it only at certain loci (Citation17, Citation18). Interestingly, previous experiments investigating remobilization of a spontaneous PB integration at Hprt did not display severe local hopping, with only 8% of reintegrations being on the X chromosome (although three were within 1 Mb of Hprt [Citation18]). However, local hopping was observed when PB was introduced into the Rosa26 locus by gene targeting (Citation18). One explanation is that the mPBase-ERT2 fusion transposase used here was less active than the noninducible version used by Wang et al. (Citation18) and the transposase exposure time was restricted in our study. Therefore, transposons being mobilized by the ERT2 fusion in this work may undergo fewer rounds of repeated transposition than they did in previous studies. Another possibility is that introduction of transposons by targeting does not guarantee a permissive excision environment.
Comparison of the local hopping profile to published Hi-C chromatin domain data suggests that elements such as insulators at domain boundaries may contribute to the extent of local hopping. However, the preference for reintegration in cis extended throughout the donor chromosome and did not correlate with interactions observed by Hi-C. Therefore, general proximity (rather than specific interactions per se) combined with the preference for open chromatin appears to influence integration patterns.
Previous studies have shown that the genome-wide integration profile of PB excised from a transiently transfected plasmid donor is not random, with PB integration biased toward genes, transcription start sites, and DNase I-hypersensitive sites (Citation17Citation–Citation19, Citation39). We have confirmed this using the largest set of chromosomally mobilized PB integration sites mapped to date. Importantly, our data comprised multiple independent sets of integrations that allowed us to identify hot spots for PB integration. We found that PB integrations, particularly at hot spots, are excluded from heterochromatin-rich lamina-associated domains and late-replicating regions of the genome.
Correspondingly, PB integrations are enriched at sites of DNase I hypersensitivity and H3K4 trimethlyation, at active transcription factor binding sites, and in proximity to expressed genes. Many of these factors correlate with each other, but considered together, these data support PB integration being determined at least in part by the physical accessibility of chromatin (). Another point to note is that puromycin selection may recover only integration sites that permit sufficient puromycin resistance gene expression. However, as a similar selection strategy is used in most experimental applications of PB, the distribution obtained here will still be relevant to design of these studies. Although the two donor loci that we used differ in endogenous expression and position, the reintegration site environments that we observed are similar, and the hot spots identified are common to both data sets.
Fig 9 Schematic representation of PB genomic mobilization characteristics.
The characteristics of local hopping and preferred integration in open chromatin regions are features shared by other DNA transposons. Large-scale Drosophila transposon mutagenesis projects have revealed that the P element also displays local hopping. The DNA transposon Sleeping Beauty, a Tc1/mariner family member, also shows severe local hopping in mammalian cells (Citation17). Genome-wide insertion sites for the P element are highly biased toward promoter regions and underrepresented in regions of repressive chromatin, assessed by binding of polycomb group proteins (Citation39). In comparison to the Drosophila P element, the PB local hopping effect is less severe with a significantly reduced 5′ bias (Citation40). This study observed hot spots that were independent of the donor locus, as we also observed, and in addition, PB and P elements showed overlapping hot spots (Citation40). This further illustrates that hot spots are likely to represent particularly accessible regions of chromatin. However, Sleeping Beauty integration deviates from this common theme of preference for open chromatin and promoter regions (Citation41); therefore, analysis of Sleeping Beauty hot spots from chromosomal mobilization may provide more insight into the transposition mechanism. The complementary behaviors of Sleeping Beauty and PB provide a very useful tool kit for mammalian experimental genetics.
Noncanonical PB insertion sites.
We found a low frequency of non-TTAA insertion sites for PB. This suggests some flexibility in the insertion mechanism of PB, although the central TA appears to be absolutely required. We also showed that plasmid-borne transposons flanked by non-TTAA sequences are mobile. Therefore, the A·T base pairs at positions 1 and 4 in the flanking sequence are dispensable for transposition. Whether the decrease in efficiency observed in two of the six plasmids is at the excision or integration step could not be distinguished in the plasmid-to-genome integration assay that we conducted here.
A previous in vitro study showed defective excision of transposons with non-TTAA flanking sequences differing from TTAA by more than one nucleotide (Citation37). Transposons with GTAA ends (which we did not test, as the GTAA end is not a commonly observed non-TTAA integration site) could be excised, but an intermediate with hairpin ends accumulated, suggesting that reintegration may be blocked. As the in vitro study showed that PB transposase could join prenicked transposons flanked by non-TTAA sequences to target DNA, it is possible that a host DNA repair enzyme acts to resolve the hairpin intermediate and allow integration in vivo. This is the case in coding end resolution during V(D)J recombination, in which opening of a similar hairpin structure occurs in a process requiring Artemis and the DNA-dependent protein kinase catalytic subunit (DNA-PKcs). (Citation42).
The variant plasmids still inserted into TTAA sites regardless of the transposon flanking sequence. This in vivo result agrees with the previous in vitro finding that PB transposons flanked by free (not hairpin) non-TTAA tetranucleotide sequences can be directly joined to TTAA donor sites at the transposon 3′ end (Citation37). Contrary to the 3′-end joining, the 5′ end of the minimal PB element was not joined in vitro to the target even for a TTAA overhang. However, our non-TTAA PB transposon-to-genome mobilization experiments provide strong evidence that the 5′ end must be able to join with the genomic DNA in vivo, even if base pairing between the transposon overhang and the genomic TTAA site is not exact, as we observed repair products having the transposon (variant) sequence in all cases. If the mispaired overhang were removed prior to joining, we would expect to see only the genomic (TTAA) sequence in the repair product (). This joining may be mediated by a host DNA ligase or require the full-length PB element.
Fig 10 Models for PB integration-mediated mismatch repair. (A) Potential repair mechanisms to resolve mismatches generated by TTAA-flanking PB integration into non-TTAA sites; (B) PB cargo conformation may influence the mismatch repair outcome.
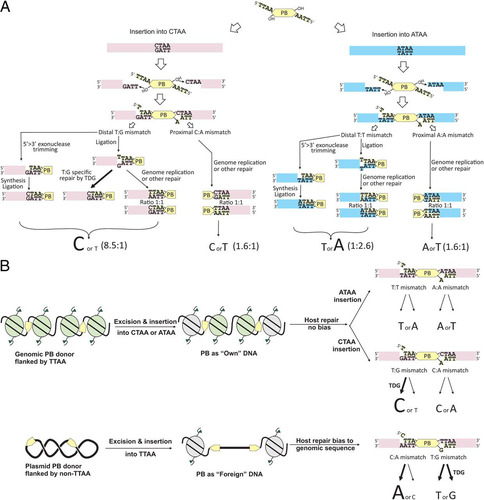
We observed biases in the repair products of transposon-induced mismatches. In the case of TTAA transposons integrating into non-TTAA target sites CTAA and ATAA (the two most common non-TTAA sites), a bias in the repair of T/G (transposon sequence/genome sequence) to C·G (base pairing) was observed. Thymine DNA glycosylase could be involved, as this is known to repair T/G mismatches and bias the outcome toward C·G (Citation43, Citation44). Other factors could also affect the repair outcome. For example, we detected different repair outcomes for T/G and A/C mismatches when the mismatch was adjacent to either PB 5′ or PB 3′ ITRs. PB ITRs have different spacer sequences; thus, the orientation of the PB transposon and transposase complex could affect the host repair machinery.
Which host repair mechanisms are involved in fixing the mismatches? We did not observe any difference in the repair products or transposition efficiency when using plasmids with non-TTAA transposon flanking sequences in Msh2-null cells compared to wild-type cells. This suggests that the mismatches produced are not dependent on the canonical mismatch repair pathway, which clearly differs from the case for transfected plasmids bearing mismatches, which do depend on Msh2 (Citation45). In addition, we observed mixed products in sequencing traces from the plasmid experiment and the observation of reads mapping to identical non-TTAA integration sites with both genome and transposon sequences (; see Table S3 in the supplemental material), suggesting that some mismatches may persist as a heteroduplex until DNA replication. Taken together, as summarized in , the repair outcome observed is independent of mismatch repair and instead is a product of replication or other DNA repair pathways.
When similar mismatches were tested in the variant plasmid experiments, however, we did not see the same repair bias as in the genomic mobilization. In this case, G/T mismatches were repaired without bias, but C/A mismatches were repaired almost exclusively to the genome sequence (which is T·A, since the variant plasmids insert into TTAA target sites). This suggests that base composition is not the sole determinant for the repair outcome. The position of the mismatch may have an effect: for example, mismatches in the flanking sequence distal to the transposon may be susceptible to exonuclease activity prior to joining of the backbone. This could bias repair to the genome sequence. There may also be differences in the choice of repair between plasmid- and genome-mobilized transposons. For example, plasmid transposons may not be completely chromatinized or methylated, which may affect the repair process in a way that biases repair to the genome sequence ().
One important point raised by this work is that PB could potentially cause point mutations in repeated rounds of transposition, for example, by insertion into a non-TTAA site followed by repair of these non-TTAA sites to TTAA after insertion and remobilization to another site.
Saturation mutagenesis using PB.
As PB is frequently used as a mutagen in genetic screens, the total number of PB mutants required to saturate the genome needs to be considered. The rate of disrupting new genes decreases as more are hit, such that after 12,000 insertions each new insertion in a gene has only a 30% chance of being in a gene that has not already been trapped. This effect is less severe for PB than for retroviral mutagenesis. For the Omnibank murine leukemia virus (MuLV) retroviral ES cell gene trap mutagenesis projects, about 100,000 insertions in genes were required to trap 6,000 genes (Citation46). The maximum number of PB insertions that we observed in a gene was 33, which is much lower than the number of MuLV retroviral hot spots. Some redundancy is desirable in a mutagenesis experiment to provide independent confirmation of hits, and our data indicate that PB mutagenesis produces a manageable amount.
Straightforward mapping of PB insertion sites on a large scale will further inform mutagenesis screens by enabling mutant libraries to be completely characterized with respect to insertion sites. As we have shown here, close examination of such sequencing data can also reveal properties of chromatin state and mismatch repair in the cell of interest.
tmcb_a_12274704_sm0001.pdf
Download PDF (7.1 MB)tmcb_a_12274704_sm0002.xls
Download MS Excel (3 MB)ACKNOWLEDGMENTS
This work was supported by the Wellcome Trust (grant WT077187).
We thank Frances Law and James Cooper for assistance with feeder cell preparation.
SUPPLEMENTAL MATERIAL
Supplemental material for this article may be found at http://dx.doi.org/10.1128/MCB.00670-12.
REFERENCES
- Ivics Z, Hackett PB, Plasterk RH, Izsvàk Z. 1997. Molecular reconstruction of Sleeping Beauty, a Tc1-like transposon from fish, and its transposition in human cells. Cell 91:501–510.
- Fraser MJ, Ciszczon T, Elick T, Bauser C. 1996. Precise excision of TTAA-specific lepidopteran transposons piggyBac (IFP2) and tagalong (TFP3) from the baculovirus genome in cell lines from two species of Lepidoptera. Insect Mol. Biol. 5:141–151.
- Ding S, Wu X, Li G, Han M, Zhuang Y, Xu T. 2005. Efficient transposition of the piggyBac (PB) transposon in mammalian cells and mice. Cell 122:473–483.
- Li MA, Turner DJ, Ning Z, Yusa K, Liang Q, Eckert S, Rad L, Fitzgerald TW, Craig NL, Bradley A. 2011. Mobilization of giant piggyBac transposons in the mouse genome. Nucleic Acids Res. 39:e148. doi:10.1093/nar/gkr764.
- Cadiñanos J, Bradley A. 2007. Generation of an inducible and optimized piggyBac transposon system. Nucleic Acids Res. 35:e87. doi:10.1093/nar/gkm446.
- Maragathavally KJ. 2006. Chimeric MosI and piggyBac transposases result in site-directed integration. FASEB J. 20:1880–1882.
- Woltjen K, Michael IP, Mohseni P, Desai R, Mileikovsky M, Hämäläinen R, Cowling R, Wang W, Liu P, Gertsenstein M, Kaji K, Sung H- K, Nagy A. 2009. piggyBac transposition reprograms fibroblasts to induced pluripotent stem cells. Nature 458:766–770.
- Yusa K, Rad R, Takeda J, Bradley A. 2009. Generation of transgene-free induced pluripotent mouse stem cells by the piggyBac transposon. Nat. Methods 6:363–369.
- Ivics Z, Li MA, Mátés L, Boeke JD, Nagy A, Bradley A, Izsvàk Z. 2009. Transposon-mediated genome manipulation in vertebrates. Nat. Methods 6:415–422.
- Bouwman P, Aly A, Escandell JM, Pieterse M, Bartkova J, Gulden H, Hiddingh S, Thanasoula M, Kulkarni A, Yang Q, Haffty BG, Tommiska J, Blomqvist C, Drapkin R, Adams DJ, Nevanlinna H, Bartek J, Tarsounas M, Ganesan S, Jonkers J. 2010. 53BP1 loss rescues BRCA1 deficiency and is associated with triple-negative and BRCA-mutated breast cancers. Nat. Struct. Mol. Biol. 17:688–695.
- Guo G, Huang Y, Humphreys P, Wang X, Smith A. 2011. A piggyBac-based recessive screening method to identify pluripotency regulators. PLoS One 6:e18189. doi:10.1371/journal.pone.0018189.
- Huang Y, Pettitt SJ, Guo G, Liu G, Li MA, Yang F, Bradley A. 2012. Isolation of homozygous mutant mouse embryonic stem cells using a dual selection system. Nucleic Acids Res. 40:e21. doi:10.1093/nar/gkr908.
- Kong J, Wang F, Brenton JD, Adams DJ. 2010. Slingshot: a piggyBac based transposon system for tamoxifen-inducible ‘self-inactivating’ insertional mutagenesis. Nucleic Acids Res. 38:e173. doi:10.1093/nar/gkq658.
- Li MA, Pettitt SJ, Yusa K, Bradley A. 2010. Genome-wide forward genetic screens in mouse ES cells. Methods Enzymol. 477:217–242.
- Rad R, Rad L, Wang W, Cadiñanos J, Vassiliou Rice S, Campos LS, Yusa K, Banerjee R, Li MA, de la Rosa J, Strong A, Lu D, Ellis P, Conte N, Yang FT, Liu P, Bradley A. 2010. PiggyBac transposon mutagenesis: a tool for cancer gene discovery in mice. Science 330:1104–1107.
- Wang W, Bradley A. 2007. A recessive genetic screen for host factors required for retroviral infection in a library of insertionally mutated Blm-deficient embryonic stem cells. Genome Biol. 8:R48. doi:10.1186/gb-2007-8-4-r48.
- Liang Q, Kong J, Stalker J, Bradley A. 2009. Chromosomal mobilization and reintegration of Sleeping Beauty and piggyBac transposons. Genesis 47:404–408.
- Wang W, Lin C, Lu D, Ning Z, Cox T, Melvin D, Wang X, Bradley A, Liu P. 2008. Chromosomal transposition of piggyBac in mouse embryonic stem cells. Proc. Natl. Acad. Sci. U. S. A. 105:9290–9295.
- Meir Y, Weirauch M, Yang H, Chung P, Yu R, Wu S. 2011. Genome-wide target profiling of piggyBac and Tol2 in HEK 293: pros and cons for gene discovery and gene therapy. BMC Biotechnol. 11:28. doi:10.1186/1472-6750-11-28.
- Wang H, Mayhew D, Chen X, Johnston M, Mitra RD. 2012. “Calling cards” for DNA-binding proteins in mammalian cells. Genetics 190:941–949.
- van der Weyden L, Adams DJ, Harris LW, Tannahill D, Arends MJ, Bradley A. 2005. Null and conditional semaphorin 3B alleles using a flexible puroDeltatk loxP/FRT vector. Genesis 41:171–178.
- Ramírez-Solis R, Davis AC, Bradley A. 1993. Gene targeting in embryonic stem cells. Methods Enzymol. 225:855–878.
- Guo G, Wang W, Bradley A. 2004. Mismatch repair genes identified using genetic screens in Blm-deficient embryonic stem cells. Nature 429:891–895.
- Pettitt SJ, Liang Q, Rairdan XY, Moran JL, Prosser HM, Beier DR, Lloyd KC, Bradley A, Skarnes WC. 2009. Agouti C57BL/6N embryonic stem cells for mouse genetic resources. Nat. Methods 6:493–495.
- Yusa K, Zhou L, Li MA, Bradley A, Craig NL. 2011. A hyperactive piggyBac transposase for mammalian applications. Proc. Natl. Acad. Sci. U. S. A. 108:1531–1536.
- Ning Z, Cox AJ, Mullikin JC. 2001. SSAHA: a fast search method for large DNA databases. Genome Res. 11:1725–1729.
- Dixon JR, Selvaraj S, Yue F, Kim A, Li Y, Shen Y, Hu M, Liu JS, Ren B. 2012. Topological domains in mammalian genomes identified by analysis of chromatin interactions. Nature 485:376–380.
- Mikkelsen TS, Ku M, Jaffe DB, Issac B, Lieberman E, Giannoukos G, Alvarez P, Brockman W, Kim T, Koche RP, Lee W, Mendenhall E, O'Donovan A, Presser A, Russ C, Xie X, Meissner A, Wernig M, Jaenisch R, Nusbaum C, Lander ES, Bernstein BE. 2007. Genome-wide maps of chromatin state in pluripotent and lineage-committed cells. Nature 448:553–560.
- Peric-Hupkes D, Meuleman W, Pagie L, Bruggeman SWM, Solovei I, Brugman W, Gräf S, Flicek P, Kerkhoven RM, van Lohuizen M, Reinders M, Wessels L, van Steensel B. 2010. Molecular maps of the reorganization of genome-nuclear lamina interactions during differentiation. Mol. Cell 38:603–613.
- Marson A, Levine SS, Cole MF, Frampton GM, Brambrink T, Johnstone S, Guenther MG, Johnston WK, Wernig M, Newman J, Calabrese JM, Dennis LM, Volkert TL, Gupta S, Love J, Hannett N, Sharp PA, Bartel DP, Jaenisch R, Young RA. 2008. Connecting microRNA genes to the core transcriptional regulatory circuitry of embryonic stem cells. Cell 134:521–533.
- Hiratani I, Ryba T, Itoh M, Yokochi T, Schwaiger M, Chang C-W, Lyou Y, Townes TM, Schübeler D, Gilbert DM. 2008. Global reorganization of replication domains during embryonic stem cell differentiation. PLoS Biol. 6:e245. doi:10.1371/journal.pbio.0060245.
- Olshen AB, Venkatraman ES, Lucito R, Wigler M. 2004. Circular binary segmentation for the analysis of array-based DNA copy number data. Biostatistics 5:557–572.
- Tang F, Barbacioru C, Bao S, Lee C, Nordman E, Wang X, Lao K, Surani MA. 2010. Tracing the derivation of embryonic stem cells from the inner cell mass by single-cell RNA-Seq analysis. Cell Stem Cell 6:468–478.
- Down TA. 2005. NestedMICA: sensitive inference of over-represented motifs in nucleic acid sequence. Nucleic Acids Res. 33:1445–1453.
- Feil R, Wagner J, Metzger D, Chambon P. 1997. Regulation of Cre recombinase activity by mutated estrogen receptor ligand-binding domains. Biochem. Biophys. Res. Commun. 237:752–757.
- Gilbert DM. 2002. Replication timing and transcriptional control: beyond cause and effect. Curr. Opin. Cell Biol. 14:377–383.
- Mitra R, Fain-Thornton J, Craig NL. 2008. piggyBac can bypass DNA synthesis during cut and paste transposition. EMBO J. 27:1097–1109.
- Abuin A, Zhang H, Bradley A. 2000. Genetic analysis of mouse embryonic stem cells bearing Msh3 and Msh2 single and compound mutations. Mol. Cell. Biol. 20:149–157.
- Bellen HJ, Levis RW, He Y, Carlson JW, Evans-Holm M, Bae E, Kim J, Metaxakis A, Savakis C, Schulze KL, Hoskins RA, Spradling AC. 2011. The Drosophila gene disruption project: progress using transposons with distinctive site specificities. Genetics 188:731–743.
- Bellen HJ, Levis RW, Liao G, He Y, Carlson JW, Tsang G, Evans-Holm M, Hiesinger PR, Schulze KL, Rubin GM, Hoskins RA, Spradling AC. 2004. The BDGP gene disruption project: single transposon insertions associated with 40% of Drosophila genes. Genetics 167:761–781.
- Ikeda R, Kokubu C, Yusa K, Keng VW, Horie K, Takeda J. 2007. Sleeping Beauty transposase has an affinity for heterochromatin conformation. Mol. Cell. Biol. 27:1665–1676.
- Ma Y, Pannicke U, Schwarz K, Lieber MR. 2002. Hairpin opening and overhang processing by an Artemis/DNA-dependent protein kinase complex in nonhomologous end joining and V(D)J recombination. Cell 108:781–794.
- Wiebauer K, Jiricny J. 1990. Mismatch-specific thymine DNA glycosylase and DNA polymerase beta mediate the correction of G.T mispairs in nuclear extracts from human cells. Proc. Natl. Acad. Sci. U. S. A. 87:5842–5845.
- Brown TC, Jiricny J. 1988. Different base/base mispairs are corrected with different efficiencies and specificities in monkey kidney cells. Cell 54:705–711.
- Tichy ED, Liang L, Deng L, Tischfield J, Schwemberger S, Babcock G, Stambrook PJ. 2011. Mismatch and base excision repair proficiency in murine embryonic stem cells. DNA Repair 10:445–451.
- Hansen G, Markesich D, Burnett M, Zhu Q, Dionne K, Richter L, Finnell R, Sands A, Zambrowicz B, Abuin A. 2008. Large-scale gene trapping in C57BL/6N mouse embryonic stem cells. Genome Res. 18:1670–1679.