Abstract
The transcriptional control circuitry in eukaryotic cells is complex and is orchestrated by combinatorially acting transcription factors. Forkhead transcription factors often function in concert with heterotypic transcription factors to specify distinct transcriptional programs. Here, we demonstrate that FOXK2 participates in combinatorial transcriptional control with the AP-1 transcription factor. FOXK2 binding regions are widespread throughout the genome and are often coassociated with AP-1 binding motifs. FOXK2 acts to promote AP-1-dependent gene expression changes in response to activation of the AP-1 pathway. In this context, FOXK2 is required for the efficient recruitment of AP-1 to chromatin. Thus, we have uncovered an important new molecular mechanism that controls AP-1-dependent gene expression.
INTRODUCTION
Combinatorial interactions between different classes of transcription factors are one of the key underlying principles used by eukaryotes to control gene expression (Citation15). This is particularly prevalent in mammalian systems where there are hundreds of transcription factors that can potentially interact. Many of these combinatorial interactions have been extrapolated from studies on one or a limited number of target genes. However, with the advent of genome-wide techniques for determining transcription factor occupancy, both the generality of known combinatorial interactions and new functional combinations of transcription factors can be identified. For example, the associations between ETS1 and RUNX1 and between ELK1 and SRF have been shown to be widespread throughout the genome (Citation2, Citation22) while novel functional interactions between the forkhead transcription factor FOXA1 and ERα have been uncovered (Citation5, Citation30).
In mammals, there are over 40 forkhead (FOX) transcription factors that all contain a forkhead winged helix-turn-helix DNA binding domain (Citation5, Citation18). These transcription factors are often expressed in a cell type-specific and temporally controlled manner. In vitro, these factors bind to sequences resembling the RYMAAYA (R = A or G; Y = C or T; M = A or C) core motif (Citation39; reviewed in reference Citation4) with GTAAACA often being the preferential binding motif. Although flanking sequences can influence the binding of FOX transcription factors, it is not clear how DNA binding sequence specificity and hence differential promoter/enhancer targeting is achieved between family members. Several ChIP-chip and ChIP-seq studies on FOX transcription factors have been performed and led to the identification of the binding regions occupied by these proteins within promoters and across the genome in several different cell types (Citation30, Citation34, Citation36, Citation44). Consistent with the in vitro results, the core GTAAACA motif is always revealed as overrepresented within these binding regions. However, combinatorial interactions with other transcription factors have also been revealed, including the coassociation of FOXA1 with the estrogen and androgen receptors in a large proportion of genomic binding regions (Citation5, Citation30). Here FOXA1 is thought to act as a pioneering factor to enable the recruitment of the nuclear hormones receptors to chromatin (Citation7, Citation24, Citation30). Thus, at least functionally, combinatorial interactions with other transcription factors partially explain how individual FOX transcription factors achieve specificity of action.
Forkhead transcription factors can be further grouped into subfamilies according to their degree of sequence similarity to each other (Citation4, Citation18). FOXK1 and FOXK2 are members of one such subfamily of forkhead transcription factors. In common with other family members, FOXK1 and FOXK2 contain a forkhead DNA binding domain, but in addition, they also contain a FHA domain in their N-terminal regions. The DNA binding specificity of FOXK2 is very similar to that of other FOX proteins, with GTAAACA being identified as the in vitro consensus binding sequence (Citation35). The mouse homologue of FOXK1, MNF, has been associated with regulating the proliferation of myogenic stem cells (Citation12, Citation19), and human FOXK1 was recently shown to associate with SRF and modulate its transcriptional activity (Citation9). However, comparatively little is known about the function of FOXK2. FOXK2 was identified as a regulator of IL-2 transcription (Citation28), and it has subsequently been shown to bind to transforming proteins adenoviral E1A and papillomavirus E6 (Citation27) and to DNA containing G/T mismatches (Citation10). More recently, we have shown that FOXK2 is linked to the cell cycle, as it is phosphorylated by cyclin-dependent kinase (CDK)–cyclin complexes (Citation33).
To begin to understand FOXK2 function in more detail, we performed genome-wide ChIP-seq analysis to identify where this transcription factor is bound in the context of chromatinized DNA in vivo. We identified thousands of sites for this transcription factor and found a close association with AP-1 binding motifs. In this context, FOXK2 plays an important role in AP-1 binding and in AP-1-mediated gene expression, thereby providing a new functionally relevant transcription factor combination that links the forkhead transcription factor FOXK2 to AP-1 signaling events.
MATERIALS AND METHODS
Plasmid constructs.
pAS2252 (encoding Flag-tagged FOXK2; Citation33) and pRL encoding Renilla luciferase (Promega) have been described previously. pSRα-HA-c-Jun (encoding hemagglutinin [HA]-tagged JUN), and pColI-Luc (containing the MMP1 promoter [−517/+63]) were kindly provided by Alan Whitmarsh and Olivier Kassel, respectively.
pAS1537-1545 and pAS1435 contain genomic regions with FOXK2 binding regions associated with the closest genes, CAPN2, GEM, KLF9, PDE7A, IGFIR, VEGFA, ITGA3, ATXN1, HBP1, and SERPINE1, respectively fused to a basal simian virus 40 (SV40) promoter and a luciferase reporter gene. Genomic DNA was extracted from U2OS cells by using the DNeasy blood and tissue kit (Qiagen). DNA fragments (600 bp) centered on the summit of the FOXK2 binding region and encompassing an associated AP-1 binding motif were amplified by PCR using 10 different primer pairs (see Table S8 in the supplemental material), and the fragments were then cloned into the pGL3 promoter vector plasmid (Promega) using SacI and XhoI sites or KpnI and XhoI (for HBP1) sites. All the constructs were verified by sequencing.
Tissue culture, cell transfection, reporter gene assays, and RNA interference.
U2OS and 293T cells were grown in Dulbecco modified Eagle medium (DMEM) supplemented with 10% fetal bovine serum (FBS). U2OS cells stably expressing FOXK2-HF (U2OS-FOXK2-HF), a control “empty vector” cell line (U2OS-HF), and HeLa cells containing a stably integrated doxycycline-inducible EGFP-FOXK2 (EGFP stands for enhanced green fluorescent protein) expression construct were made and propagated as described previously (Citation33).
Where indicated, the cells were serum starved for 24 h and either analyzed immediately or stimulated with phorbol myristate acetate (PMA) (25 nM) for 2 h.
For luciferase assays, U2OS or 293T cells were transfected with 250 ng of reporter plasmid. Transfections were carried out using Fugene HD (Roche). The Dual-Light luciferase reporter assay system (Applied Biosystems) was used according to the supplier's protocol. The relative luciferase activity was measured as a ratio of β-galactosidase control (from cotransfected pCH110) and presented relative to the activity of pGL3 parental vector (taken as 1).
Small interfering RNA (siRNA) against FOXK2 and a matched GAPDH control were obtained from Dharmacon. To carry out RNA interference (RNAi), the cells were transfected with 50 nM siRNA using Lipofectamine RNAiMAX (Invitrogen) following the manufacturer's instructions. Transfections were repeated 24 h later. The cells were serum starved for 24 h and then treated with 25 nM PMA for a further 2 h where required.
Western blot analysis and coimmunoprecipitation analysis.
Western blotting was carried out with the following primary antibodies: FOXK2 (ILF1, ab5298; Abcam), Flag (Sigma-Aldrich, F3165), JUN (H79, sc-1694; Santa Cruz), FOS (H-125, sc-7202; Santa Cruz), extracellular signal-regulated kinase 2 (ERK2) (sc-154; Santa Cruz), glyceraldehyde-3-phosphate dehydrogenase (GAPDH) (ab9485; Abcam), and hemagglutinin (HA) (12CA5; Cancer Research UK). The proteins were detected by chemiluminescence with SuperSignal West Dura substrate (Pierce) and visualized with a Fluor-S MultiImager (Bio-Rad).
For coimmunoprecipitation, U2OS cells were transfected with expression vectors encoding Flag-tagged FOXK2 and/or HA-tagged human c-JUN. Twenty-four hours after transfection, the cells were washed twice with ice-cold phosphate-buffered saline (PBS) and then lysed in buffer containing 20 mM Tris (pH 7.4), 137 mM NaCl, 25 mM β-glycerophosphate, 2 mM sodium pyrophosphate, 2 mM EDTA, 1% Triton X-100, 10% glycerol, and protease inhibitor cocktail (Roche). The lysates were centrifuged at 14,000 × g for 20 min to remove insoluble material. FOXK2 proteins were immunoprecipitated from lysates by incubation with anti-Flag antibodies overnight at 4°C and protein G-Sepharose beads (Amersham Biosciences) at 4°C for 1 h. The beads were washed four times in lysis buffer, and bound proteins were eluted by adding SDS loading buffer and subjected to Western blotting.
RT-PCR and expression microarray analysis.
mRNA was isolated, and real-time reverse transcription-PCR (RT-PCR) was performed essentially as described previously (Citation9). The primer pairs used for RT-PCR experiments are listed in Table S8 in the supplemental material. mRNA labeling and expression profiling using Affymetrix arrays (Human Genome U133 Plus 2.0 array) was performed as described previously (Citation37). Array experiments were performed in triplicate for each experimental condition. For knockdown experiments, RNAi treatment was performed for 48 h before harvesting, and for overexpression experiments, cells were grown in DMEM containing 10% FBS for 24 h and then treated with 1 μg/ml doxycycline for a further 24 h.
Technical quality control was performed with dChip (V2005) (www.dchip.org; Citation29) using the default settings. Background correction, quantile normalization, and gene expression analysis were performed using RMA in Bioconductor (Citation1). Principal component analysis (PCA) was performed with Partek Genomics Solution (version 6.5; Partek Inc., St. Charles, MO). Differential expression analysis was performed using Limma using the functions lmFit and eBayes (Citation41) in a paired model (triplicates of the microarray experiments were all performed in three batches). Gene lists of differentially expressed genes were controlled for false discovery rate (FDR) errors using the method of QVALUE (Citation42). Gene expression changes were considered significant if the changes were >1.25-fold or <1.25-fold and had a P value of <0.05. Experimental data are deposited in ArrayExpress under the following accession numbers: E-MEXP-3107 (expression profiling upon exposure to PMA and FOXK2 depletion with siRNA), E-MEXP-3106 (expression profiling upon FOXK2 depletion by siRNA), and E-MEXP-3040 (expression profiling upon FOXK2 induction).
ChIP and re-ChIP assays.
Chromatin immunoprecipitation (ChIP) assays using control IgG (Upstate), anti-Flag (Sigma-Aldrich, F3165), or antisera specific to FOXK2 (ILF1, ab5298; Abcam), JUN (H79, sc-1694; Santa Cruz), or FOS (H-125, sc-7202; Santa Cruz) were performed as described previously (Citation33). For re-ChIP assay, we used ∼3 × 10⁷ U2OS-FOXK2-HF cells. After the first round of immunoprecipitation with anti-Flag antibody, the beads were washed and then incubated as described in reference Citation14 with minor modifications: immunoprecipitates were subjected to two elutions in 110 μl elution buffer (50 mM Tris-Cl [pH 7.5], 10 mM EDTA, and 1% SDS) for 20 min at 65°C. After removal of the beads, the samples were pooled and 20 μl was used for analysis of the first ChIP. The remaining 200 μl of eluate was diluted 10 times using immunoprecipitation (IP) buffer (1 mM EDTA, 0.5 mM EGTA, 4 mM Tris-HCl, pH 8.0, 100 mM NaCl, 0.1% Na-deoxycholate, 17 mM N-lauryl sarcosine) and subjected to a second round of immunoprecipitation with Dynal beads cross-linked to JUN or FOS antibodies or no-antibody control. Washing, elution, and decross-linking were preformed as for standard ChIP assays. Bound promoters were detected by quantitative PCR (qPCR) (using primers listed in Table S8 in the supplemental material), at least in duplicate, from at least two independent experiments, using Quantitect SYBR green PCR reagent (Qiagen). Results were analyzed with Rotorgene 6.0 software (Corbett Research) relative to input using the standard curve method.
ChIP-chip and ChIP-seq assays.
The ChIP assay was performed as previously described (Citation33) using ∼8 × 10⁷ to 10 × 107 U2OS-FOXK2-HF cells stably expressing FOXK2 tagged with Flag and His (four 150-mm plates) or stable U2OS-HF cells containing an empty vector containing genes encoding the same tags. The ChIP-chip assay was performed using Affymetrix Human Promoter 1.0R arrays essentially as described previously (Citation2) except that ∼20 ng was taken for each random priming reaction and 7.5 μg of fragmented and labeled DNA targets was used in the hybridizations. For the ChIP-seq assay, ∼10 to 20 ng of immunoprecipitated DNA was sent for sequencing using the SOLiD platform according to the manufacturer's protocols (Life Technologies). Experimental data are deposited in ArrayExpress under the following accession numbers: E-MTAB-565 (FOXK2 ChIP-seq) and E-MEXP-3116 (FOXK2 ChIP-chip).
FAIRE and FAIRE-seq analysis.
Formaldehyde-assisted isolation of regulatory element (FAIRE) analysis was performed as described previously (Citation7, Citation16) with slight modifications. Approximately 5 × 10⁷ U2OS cells were cross-linked with 1% formaldehyde for 10 min at room temperature. The same amount of non-cross-linked cells was used as a control. Glycine was added to a final concentration of 125 mM, and the cells were rinsed with cold PBS and harvested by scraping into cold PBS containing protease inhibitors. The cells were then lysed with lysis buffer (2% Triton X-100, 1% SDS, 100 mM NaCl, 10 mM Tris-Cl at pH 8.0, 1 mM EDTA) containing a protease inhibitor cocktail (Roche) and sonicated for 15 min (30-s on/off cycles) using a Bioruptor (Diagenode) set at the highest intensity. After centrifugation at 13,000 × g for 10 min at 4°C to precipitate cellular debris, 50 μl lysate was taken as input control. The soluble chromatin was isolated and subjected to three consecutive phenol-chloroform extractions (Sigma, P3803). Each time, the aqueous phase was recovered and mixed with an equal volume of phenol-chloroform. After vortexing, the mixture was centrifuged at 13,000 × g for 5 min, and the aqueous phase was recovered. Samples were then incubated overnight at 65°C to reverse cross-linking. DNA was finally purified using a PCR purification kit (Qiagen). DNA was quantified using a Nanodrop, and 5 ng DNA was used as qPCR templates. For FAIRE-seq, 1 μg of FAIRE and input DNA was used to generate fragment DNA libraries. Templated beads were then prepared and sequenced using the SOLiD 4.0 platform according to the manufacturer's protocol (Life Technologies). Experimental data are deposited in ArrayExpress under the following accession number: E-MTAB-584 (FAIRE-seq).
Bioinformatics analysis.
For analysis of ChIP-chip data, acquired “.CEL” files were analyzed using MAT software (Citation25; http://chip.dfci.harvard.edu/∼wli/MAT/). The bandwidth, maxgap, and minprobe parameters were set at 300, 150, and 10, respectively. The threshold P value was set at 1 × 10⁻⁵. Two biological replicates of the FOXK2 ChIP and one control were analyzed together to determine significant binding regions. Affymetrix probes were mapped to the NCBI36 (hg18/March 2006) release of the human genome using a BPMAP file downloaded from the MAT website. Any binding regions flagged (by MAT) to contain >70% repeat sequence, simple repeats, and segmental duplications were removed from further analysis. Binding regions were sorted by P value significance. All of the binding regions were used for further analysis, as the maximum FDR was 7.66%. GALAXY (Citation17) was used to identify genes where a FOXK2 binding region overlapped with a region from kb −10 to +2.5 of an annotated RefSeq transcript transcriptional start site (TSS). For constructing random data sets of genomic regions to compare with the FOXK2 ChIP-chip binding regions, 2,286 sequences of 917 bp (corresponding to the mean length of FOXK2 ChIP-chip binding regions) that overlap probes on the ChIP-chip array were randomly selected.
For ChIP-seq analysis, 50-bp sequences from two biological replicates of the FOXK2 ChIP (Flag ChIP from U2OS-FOXK2-HF cells), control ChIP (Flag ChIP from U2OS-HF cells), and input DNA control were used. The FAIRE-seq analysis used 50-bp sequences from a single treatment ChIP sample and an input DNA control. In both experiments, reads were mapped to the NCBI36 (hg18/March 2006) release of the human genome using Corona-Lite version 4.2.1 (Life Technologies). Uniquely mapped reads with a maximum of 5 mismatches were converted into BED format for downstream analysis. The uniquely mapped reads were analyzed using the MACS version 1.3.7.1 software (Citation46; http://liulab.dfci.harvard.edu/MACS/) to identify binding regions. The summit of each binding region is defined as the location with the highest read pileup. For the FOXK2 ChIP-seq experiment, the bandwidth and mfold parameters were set at 150 and 20, respectively. For the FAIRE-seq experiment, mfold was set at 15. The threshold P value was set to P < 1 × 10⁻⁵. The final set of 8,600 binding regions was generated by identifying overlapping regions from the binding regions from experiment 1 controlled by comparison to both empty vector and by input DNA, in comparison to the binding regions from experiment 2 controlled by both empty vector and input DNA.
To associate FOXK2 binding regions with potential target genes, RefSeq transcript coordinates were downloaded from the UCSC table browser and associated, via GALAXY, with these regions. An association was made with one or more genes if the summit of the FOXK2 binding regions overlapped RefSeq transcripts or their promoter regions (defined as −10 kb to +2.5 kb of the TSS). If an overlap was not observed, then the closest gene (5′ or 3′ of the gene) was selected. Gene symbols associated with ChIP-chip, ChIP-seq, FAIRE-seq, and microarray probe sets were parsed and where necessary converted to official gene symbols, as defined by the Human Genome Nomenclature Committee (HGNC) at the European Bioinformatics Institute (http://www.genenames.org). To ensure the maximum rate of conversion, gene symbols were compared against synonyms and alias from Entrez Gene (Citation31) and HGNC data. The conversion was performed using a PERL script. The locations of FOXK2 binding regions, defined by their midpoint coordinates, relative to gene structure were determined using CEAS version 0.9.9.4 (Citation40; http://liulab.dfci.harvard.edu/CEAS/). The analysis was also performed using a data set containing the same number of random genome coordinates selected from mappable regions of the human genome. The “CRG Align 50” data (containing all 50-mers with no more than 2 mismatches relative to the human genome) were downloaded from the test version of the UCSC Genome Browser (http://genome-test.cse.ucsc.edu). This random set of regions was also used to compare against FAIRE-seq binding regions and those from other data sets.
For motif discovery, overrepresented sequence motifs were identified in 200-bp regions centered upon the summit of each binding region using Weeder version 1.4.2 (http://159.149.109.9/modtools/; Citation38). Matrices from the “Best Occurrences” output were compared against all TRANSFAC v11.3 matrices using the webtool STAMP (Citation32; http://www.benoslab.pitt.edu/stamp/). Weblogos of the discovered matrices were created using STAMP. Weeder was run using the following parameters: S = scan both strands of the supplied sequences; M = assume that there may be more than one discovered motif per sequence; “medium” = search for motifs of length 6 (1 degenerate position), 8 (2 degenerate positions), and 10 (3 degenerate positions). Background data sets were created by selecting 200-bp regions located 250 bp downstream of each binding region summit coordinate.
A PERL script was used to scan for motifs corresponding to the FOXK2 and AP-1 consensus binding sequences within 200 bp of FOXK2 binding region summits and in background sequences. The script identified matches to a supplied IUPAC consensus sequence in the forward and reverse strands of unmasked sequences. The background data sets were created by selecting 200-bp regions located 250 bp downstream (relative to the forward strand) of each binding region summit coordinate. The effect of single-nucleotide changes in the consensus sequences on motif occurrence used these same motif scanning methods. In order to partition the 200-bp summit regions relative to gene structure, the summit coordinate was compared against lists of coordinates from RefSeq transcripts downloaded from the UCSC table browser. Lists of coordinates were then prepared for the following groups: kb −10 to kb −1 from the transcript TSS, kb −1 to the TSS, and distal regions (determined as those not overlapping kb −10 of the TSS to kb +1 of the TSS of a transcript). Coordinate comparisons were performed using GALAXY.
Statistical analysis.
Z-scores for the comparison between microarray gene lists and FOXK2 ChIP-seq gene lists were determined automatically using a PERL script. Essentially 10,000 random gene lists of approved gene symbols from RefSeq (the total number of genes was equal to the size of each expression data set under consideration) were sequentially compared to the list of genes associated with FOXK2 binding regions (defined as those genes with promoters or transcripts that overlap with FOXK2 summit regions; otherwise the nearest genes was selected). The observed percentages of expression array genes shown to overlap with FOXK2 target genes were compared to the mean and standard deviation of the comparison of random genes using the equation: Z-score = (x − μ)/σ, where x is the observed percentage overlap, μ is the mean of percentage overlaps in the random sets, and σ is the standard deviation of percentage overlaps in the random sets.
Fisher's exact chi-square test for 2 × 2 contingency tables (using 2-tailed P values) was applied in a number of instances to determine whether the occurrence of FOXK2 or AP-1 consensus sequences (including those with one nucleotide mutations) were significantly different from background sequences. The chi-square test was also used to establish whether the overlap of FOXK2 summit regions to the same size regions from other ChIP-seq data sets was significantly different in comparison to randomly selected, mappable sequences from the genome. For DAVID analysis, the enrichment P value in the Functional Annotation Chart is calculated based on the EASE score and a modified Fisher exact test (Citation23). Statistical analysis for qRT-PCR studies and luciferase assays were performed using paired, 2-tailed Student's t test. The error bars in all graphs represent standard deviations.
RESULTS
Genome-wide identification of the FOXK2 binding regions.
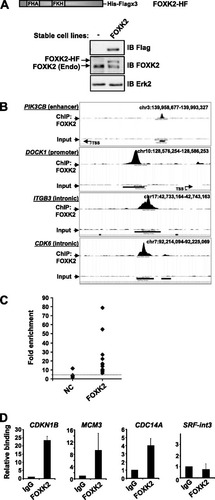
To begin to understand FOXK2 function, we used ChIP-seq analysis to identify regions in the genome occupied by FOXK2 in vivo. We created a human osteosarcoma (U2OS)-derived cell line that stably expresses FOXK2 fused to a hexahistidine and triple Flag tag (U2OS-FOXK2-HF cells) or contains the parental vector lacking the FOXK2 insert (U2OS-HF cells). A cell line that expressed FOXK2-HF at a level similar to that of the endogenous protein was chosen (A). ChIP was then performed on both U2OS-FOXK2-HF and U2OS-HF cells, and the precipitated material was sequenced using the SOLiD platform (ChIP-seq). Two independent ChIP experiments were performed giving 54,712,686 and 47,000,432 mappable reads for FOXK2-HF cells. Binding regions were then identified that were common to both experiments and not in the control ChIP from U2OS-HF cells or in the input control. This merged data set yielded a total of 8,600 peaks (P value < 1 × 10⁻⁵) corresponding to FOXK2 binding regions (see Table S1A in the supplemental material). Examples of binding region profiles are shown in B. We subsequently selected binding regions that were positioned approximately every 500 regions throughout the ranked list of binding regions for verification by qPCR (C; see Fig. S1 in the supplemental material). Of the 17 regions tested, 15 were verified by qPCR, indicating a false-positive rate of 12%. We also performed ChIP for several genes using an antibody against endogenous FOXK2 in parental U2OS cells. All the genes tested showed positive signals for FOXK2 binding except for the negative-control SRF-int3 (D; see also B in the supplemental material). Thus, the 8,600 binding regions identified in the merged data set represent a high-confidence set of FOXK2 binding regions.
Fig 1 Validation of FOXK2 targets identified by ChIP-seq. (A) Schematic illustration of the His-Flag (HF)-tagged FOXK2 construct. The Western blots show the expression of FOXK2-HF (using anti-Flag antibody) and total endogenous (Endo) and HF-tagged FOXK2 (using anti-FOXK2 antibody) in U2OS-HF (−) and U2OS-FOXK2-HF (FOXK2) cells. IB, immunoblotting. (B) MACS profiles of FOXK2 binding to the indicated genomic regions and input controls for the same regions. Where applicable, the transcriptional start site (TSS) is indicated. chr3, chromosome 3. (C and D) qPCR-ChIP validation of FOXK2 binding to genomic regions associated with the indicated genes using either anti-Flag antibody in U2OS-FOXK2-HF cells (C) or anti-FOXK2 antibody in U2OS cells (D). SRF intron 3 (int3) is a negative control (NC). Data are the averages plus standard deviations (error bars) of duplicate samples and are representative of 3 independent experiments and are shown relative to enrichment with Flag antibody in U2OS-HF cells (C) or nonspecific IgG (taken as 1) (D). The dotted line in panel represents the average of the negative controls (NC).
We also performed ChIP-chip analysis using Affymetrix Human Promoter 1.0R arrays in U2OS-FOXK2-HF and U2OS-HF cells and used these data to help validate our ChIP-seq data. A total of 2,286 binding regions were obtained from the ChIP-chip experiments (P value < 1 × 10⁻⁵) (see Table S2 in the supplemental material). A random selection of these binding regions was validated by qPCR; of the 16 regions tested, 14 were verified by qPCR, indicating a false-positive rate of 12.5% (see Fig. S2A in the supplemental material). Among the regions identified by ChIP-chip analysis, 525 (23%) overlapped the binding regions in the merged data set of 8,600 regions from the ChIP-seq experiments. A comparison of the two ChIP-seq experiments indicated that the first experiment was more sensitive than the second experiment based on the peak height profiles obtained (see Table S1B in the supplemental material). Indeed, the overlap with the ChIP-chip data increased to 1,780 (78%) when compared to the regions identified in the first ChIP-seq experiment alone (see Fig. S2B). When the same comparison was done on rank-ordered ChIP-chip binding regions, the higher-probability binding regions were more likely to also be found in the ChIP-seq data, and this correlation was substantially increased when considering all the regions from the first experiment alone (see Fig. S2C). To validate the overlap with binding regions found in experiment 1 alone and in the ChIP-chip data, we tested several regions for occupancy by FOXK2 by qPCR, and all these regions scored positive (see Fig. S2D). Thus, there are clearly more FOXK2 binding regions within the ChIP-seq data from experiment 1 alone than those contained in the high-confidence data set of 8,600 regions. We therefore consider these data to represent a lower-confidence data set which still contains many true FOXK2 binding regions. However, for further downstream analysis, we have subsequently focused on the higher-confidence merged data set of 8,600 binding regions.
Features of the FOXK2 binding regions.
The locations of the FOXK2 binding regions relative to the transcriptional start sites (TSSs) of annotated genes show a wide distribution which is substantially different from that expected at random (A). Only a small proportion of binding events are located in the proximal promoter (4.2%; up to 1 kb upstream from the TSS), rising to 13.6% located within the upstream 10-kb region. However, these associations were substantially larger than expected by chance. The majority of sites were either intronic (37.5%; with 40.3% of these sites in the first intron of a transcript) or in distal intergenic regions (40.9%). This distribution is broadly consistent with that observed for many other transcription factors, including other forkhead transcription factors (e.g., FOXA1, FOXA2, FOXA3) (Citation30, Citation34, Citation44) but differs from transcription factors like the ETS domain protein GABPα (Citation43), whose binding regions are mainly in the proximal promoter region (see Fig. S3A in the supplemental material).
Fig 2 Characterization of the FOXK2 binding events. (A) Genomic distribution of the FOXK2 binding events and a random set of genomic coordinates. 5′UTR, 5′ untranslated region. (B) Best octamer motif identified by Weeder analysis. The pie chart indicates the percentage of binding regions that contain matches to this motif. (C) Binding specificity of FOXK2. The occurrence of each of the indicated motifs in the FOXK2 binding regions compared to a background data set is shown. The dotted line represents the average number of motifs expected in the background data set based on an even distribution of each sequence. Statistically significant overrepresentation is indicated by asterisks as follows: ∗, P values < 0.05; ∗∗, P < 0.0001. A consensus binding region based on these preferences is shown below. (D) Occurrence of GTAAACA motifs depending on the locations of FOXK2 binding regions or an equivalently sized set of random background regions. A significant difference in the distribution of the motifs between the indicated genomic locations (P value = 0.0013) is indicated by the bracket and asterisk. (E) Comparison of the genomic regions bound by FOXK2 and those bound by the indicated FOX transcription factors. Percentage overlaps are relative to FOXK2. All 8,600 FOXK2 binding sites are used except for comparisons with FOXC2 ChIP-chip data where 1,603 sites are compared that are located within the same search space. (F) Top KEGG pathways identified as overrepresented among the genes associated with FOXK2 binding regions. MAPK, mitogen-activated protein kinase; TGF-beta, transforming growth factor β.
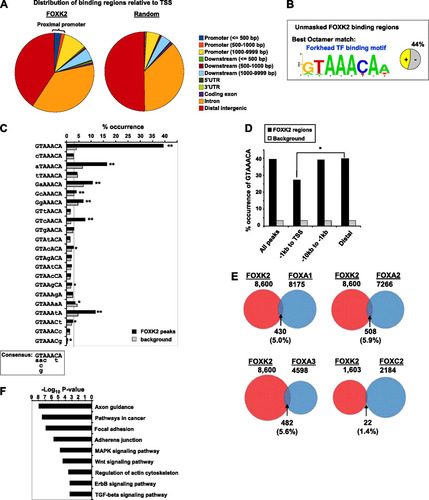
Next we searched for overrepresented DNA motifs within the regions centered on the summit of each binding region and uncovered a series of motifs that resembled consensus binding sites for other forkhead transcription factors, including the site identified for FOXK2 in vitro (Citation35) (B; see Fig. S3B in the supplemental material). Similar motifs were also found within the summit regions revealed by the first experiment alone (see Fig. S3C). The central core sequence from this motif GTAAACA is generally located toward the summit of the binding regions (see Fig. S3D) and is vastly overrepresented in the region surrounding the center of the binding regions compared to background data sets (C and D) with nearly 40% of all regions identified in the ChIP-seq experiments containing at least one such motif within 100 bp from the summit of the binding region compared to only 4% of the background regions. Importantly, only a small proportion (0.8%) of all GTAAACA motifs found in the genome are bound by FOXK2. This enrichment pattern was also evident when comparing the larger set of ChIP-seq regions, albeit to a lower extent (see Fig. S3E). To gain further insight into the DNA binding specificity of FOXK2 in vivo, we compared the frequency of occurrence of the GTAAACA motif in the ChIP-seq summit regions with a series of heptameric sequences, each containing a single nucleotide substitution within this motif (C). In the majority of cases, there was no significant enrichment of the motif over a background data set. However, enrichment in the ChIP-seq summit regions was still seen at position 1 where a G-to-A change could be tolerated and at position 6 where a C-to-T change was overrepresented. Weaker enrichment at position 2 was observed where a change from T to A, C, or G can occur. Thus, although the full GTAAACA core sequence is the most common and significant motif found, there are other overrepresented binding sites that differ slightly from this motif, indicating a broader binding specificity in vivo. We also examined the genomic distribution of the peaks containing GTAAACA motifs and found that these were relatively evenly distributed in the genome but were significantly underrepresented in peaks located in the proximal promoter region (1 kb upstream from the TSS) (D).
The high proportion of motifs identified corresponding to the core site recognized by other FOX transcription factors suggested that there might be a high degree of redundant binding with other FOX proteins. We therefore compared the binding regions for FOXK2 for overlap with those identified for other FOX proteins by ChIP-chip and ChIP-seq approaches (Citation34, Citation36). In all cases, there is an overlap in binding regions (ranging from an overlap of 1.4% with FOXC2 to 5.9% with FOXA2), but the majority of binding regions do not overlap (E). Interestingly, of the binding regions that do overlap with FOXA binding regions, between 61% and 62% of these regions contain matches to the GTAAACA core motif, which is substantially higher than the 40% occurrence seen in the overall population of FOXK2 binding peaks. Even when the 59,531 binding regions from experiment 1 alone were considered, the overlap in shared binding regions with other FOX proteins increased to only 20 to 34% (see Fig. S4 in the supplemental material). Together, these results indicate that FOXK2 occupies a significant number of unique binding sites, although a number of binding regions can also be bound by multiple different FOX transcription factors, suggesting redundancy of binding.
Having established that the overall binding profile of FOXK2 is unique among FOX transcription factors studied thus far, we asked whether the genes associated with FOXK2 binding regions defined any particular biological process(es). Using DAVID (Citation23), we identified a large number of pathways and processes which are enriched among FOXK2 target genes (see Table S3 in the supplemental material). The top Kyoto Encyclopedia of Genes and Genomes (KEGG) pathways can be grouped around several signaling pathways and in processes that are associated with cell-cell contacts, adhesion, and motility (F). The top gene ontology (GO) terms identified also mirrored these findings, with groups of genes associated with cell adhesion and motility being particularly prominent (see Fig. S5 in the supplemental material). Other broad categories, such as control of metabolic process, transcription, and apoptosis, are also present.
Coassociation of AP-1 binding motifs with FOXK2 binding regions.
To establish whether there are any transcription factors that potentially act combinatorially with FOXK2, we used Weeder to search for overrepresented DNA motifs within the FOXK2 binding regions after masking out the GTAAACA motif (A; see Fig. S6A in the supplemental material). Several motifs that weakly match other FOX binding motifs were identified and likely represent suboptimal binding sites based on the core GTAAACA sequence. However, other prominent binding motifs match the AP-1-like palindromic site TGA(G/C)TCA, and matches to this motif are found in 19% of the FOXK2 binding regions. In contrast, this motif exhibits a much lower frequency in ChIP-seq data sets for other transcription factors (presumed to be unrelated to the current biological network), such as those for GATA-1 and MAX (9.5% and 7.5%, respectively) (Citation8, Citation11). For an additional control, the occurrence of a similar palindromic motif ACTNAGT (where N = A, G, C, or T) was not significantly higher in the FOXK2 binding regions compared to a random set of genomic regions (see Fig. S6B). The TGANTCA motifs were located toward the summit of the FOXK2 binding regions, although the distribution was not as polarized as observed for the GTAAACA motifs. This centralized distribution within the summit regions was not observed for the inverted ACTNAGT motif (see Fig. S6C). Using the sequence TGANTCA as a starting point, the frequency of occurrence of heptameric sequences, each containing a single nucleotide substitution within this motif, in the FOXK2 binding regions was calculated (see Fig. S6B). A clear preference for the entire TGA(G/C)TCA motif was observed with a marked preference for a G·C base pair in the center of the palindrome. However, statistically significant overrepresentation of sites containing a relaxed sequence preference of either G to C or T at position 2 and A to T at position 3 are observed, although these are not as marked as the nucleotide preferences for the FOX binding motif. The distribution of FOXK2 binding regions containing the TGANTCA motif throughout the genome was also analyzed, and as observed for the FOX binding motif, these regions tended to be located in distal regions beyond the part of the genome 1 kb upstream of the TSS where underrepresentation of this motif was apparent (B). However, this underrepresentation is probably partially due to a bias in the overall distribution of TGANTCA motifs in the genome, as their frequency is much reduced in the proximal promoter regions of random control data sets (B).
Fig 3 Coassociation of AP-1 binding events with FOXK2 binding regions. (A) Best octamer motif identified by Weeder analysis following masking out the GTAAACA motif. The pie chart indicates the percentage of binding regions that contain matches to this motif. (B) Occurrence of TGANTCA motifs depending on the location of FOXK2 binding regions or an equivalently sized set of random background regions. Significant differences in the distribution of the motifs between the indicated genomic locations and a background data set are indicated by asterisks as follows: ∗, P < 0.05; ∗∗, P < 0.0001. (C) Comparison of the genomic regions bound by FOXK2 in U2OS cells (red circles) and those bound by the indicated transcription factors in K562 cells (blue circles). Percent overlap values are relative to FOXK2. All 8,600 FOXK2 binding sites are used. (D) Overlap of ChIP-seq-derived binding regions for the indicated transcription factors and the 1,600 FOXK2 binding regions that contain TGANTCA motifs. Percent overlap is given relative to the FOXK2 data set.
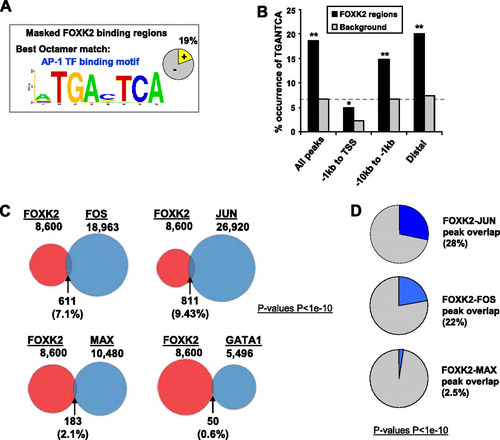
To establish the potential functional relevance of the coassociation with AP-1 binding motifs, we also investigated whether known AP-1 binding regions identified in other ChIP-seq studies overlapped with the FOXK2 binding regions. AP-1 is a dimeric transcription factor, and two of the best studied subunits are FOS and JUN (reviewed in reference Citation20). The binding regions for these two AP-1 components identified in K562 cells (Citation8) both overlapped significantly with the FOXK2 binding regions, despite the different cell types being studied (P values < 1 × 10⁻¹⁰) (C). In contrast, substantially lower overlap was observed with MAX (Citation8) or GATA-1 (Citation11) binding regions identified in the same cell type. Furthermore, when the FOXK2 binding regions that also contain an exact match to the TGANTCA AP-1 binding motif were analyzed, the overlap with the FOS and JUN ChIP-seq derived binding regions is even more pronounced (22 to 28% of FOXK2 binding regions) (D). Thus, in addition to the presence of AP-1 binding motifs, there is also a coassociation with AP-1 component binding events.
FOXK2 binding regions are associated with open chromatin.
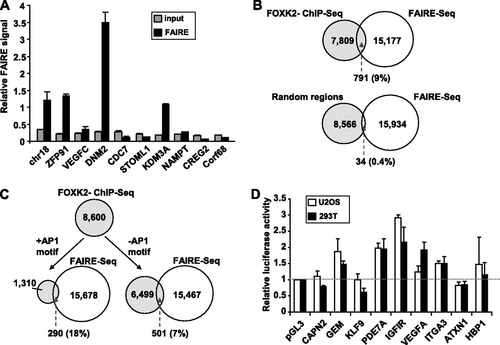
The majority of FOXK2 binding regions are not located in promoter regions, and it is therefore unclear what their role might be. Potentially, FOXK2 might control chromatin accessibility in an analogous manner to the FOXA subfamily of forkhead transcription factors (Citation7, Citation30). To address this possibility, we asked whether the FOXK2 binding regions are associated with open chromatin by using formaldehyde-assisted isolation of regulatory element (FAIRE) analysis. This method determines the relative enrichment of regions unoccupied by nucleosomes following removal of nucleosome-associated DNA from cross-linked total chromatin extracts. Of the nine regions tested, three showed high FAIRE signals (A), suggesting that a substantial proportion of the FOXK2 binding regions might be associated with open chromatin. We therefore extended this analysis to a genome-wide scale by performing FAIRE-seq analysis (Citation13) in U2OS cells. A total of 15,968 regions were identified as having a high FAIRE signal (see Table S4 in the supplemental material) (P value < 1 × 10⁻⁵). Of the FOXK2 binding regions, 791 (9%) overlapped with FAIRE-seq regions, compared to only 34 overlaps with an equivalently sized data set derived from random genome coordinates (B). Furthermore, upon partitioning the FOXK2 binding regions to those lacking or containing AP-1 motifs, a more substantial overlap was seen with the regions containing AP-1 motifs (18% compared to 7% in regions lacking the AP-1 motif) (C). Thus, the regions bound by FOXK2 and containing AP-1 motifs show a significant association with regions of open chromatin, suggesting that these regions may be functionally relevant and transcriptionally active. To test for the functionality of the FOXK2-bound regions, we cloned nine regions that also contained AP-1 motifs and that encompassed 600 bp surrounding the FOXK2 binding peaks into a luciferase reporter vector containing a basal SV40 promoter. Five of these regions exhibited enhancer activity in this context (D), indicating that they are potentially active areas of chromatin. However, although enhancer activity is detected, this is generally weak in these regions.
Fig 4 FOXK2 binding regions are associated with open chromatin. (A) qPCR analysis of FAIRE data. Data are normalized against uncross-linked genomic DNA for each primer pair (taken as 1). Signals obtained from FAIRE and input DNA are shown. FAIRE Chr18 represents a control region corresponding to a known FAIRE region found in pancreatic islet cells (Citation13). (B) Overlap of FAIRE-seq regions from U2OS cells (P value < 1 × 10⁻⁵) and regions bound by FOXK2. The overlap with a comparable number of random genomic regions is shown. (C) The overlap of FAIRE-seq regions with regions bound by FOXK2 is further partitioned into FOXK2 regions that contain the AP-1 motif TGANTCA and those that do not contain the AP-1 motif. (D) Reporter gene analysis of genomic fragments containing FOXK2 binding regions. The name represents the closest gene to the particular fragment. The dotted line represents the activity of the empty pGL3 vector. Data are the averages plus standard deviations (error bars) of duplicate samples from three independent experiments.
Together, these results indicate that FOXK2 binding events are often associated with open chromatin, which is particularly marked for sites containing the AP-1 binding motif.
FOXK2 binding correlates with FOXK2-regulated gene expression.
To establish whether FOXK2 binding events are associated with the functionality of FOXK2 in controlling gene expression, we first determined the effect of modulating FOXK2 levels on mRNA expression profiles. FOXK2 levels in U2OS cells were depleted by treatment with siRNA (see Fig. S7A in the supplemental material), and the resulting gene expression profiles were analyzed using microarrays. FOXK2 levels were efficiently depleted by this treatment (see Fig. S7A) and were decreased to an average of 9% of wild-type levels in the microarray experiments. In total, 1,131 genes showed at least a 1.25-fold increase in their expression and 952 showed a 1.25-fold decrease in their expression (P values < 0.05) following FOXK2 depletion (A; see Table S5 in the supplemental material). Next, we associated FOXK2 binding regions with a total of 5,152 target genes found on the expression arrays and compared FOXK2 binding events with FOXK2-mediated changes in gene expression (A). Importantly, both the upregulated and downregulated sets of genes showed highly significant overlap with the FOXK2 ChIP-seq data, with the highest Z-scores being associated with genes whose expression decreases following FOXK2 depletion (A). Thus, FOXK2 appears to directly influence the expression of a wide range of targets in both a positive and negative manner.
Fig 5 Association of FOXK2-regulated genes with regions occupied by FOXK2. (A) FOXK2 was depleted from U2OS cells with siRNA, and genes whose expression changed by at least 25% (up or down) are compared to the presence of a FOXK2 binding event in their vicinity. siFOXK2, siRNA against FOXK2. (B) FOXK2 was overexpressed in HeLa cells by doxycycline treatment for 24 h, and genes whose expression changed by at least 1.25-fold (up or down) are compared to the presence of a FOXK2 binding event in their vicinity. Z-scores are calculated from comparing the FOXK2 ChIP-seq data with equivalent sized randomly chosen RefSeq genes. (C) The ratio between the numbers of genes going up and down by 1.25-fold following FOXK2 depletion is plotted for the indicated data sets. “All genes” represents all genes that change on the array, whereas the genes that also contain FOXK2-associated binding regions (gray bars) are shown in their entirety (all regions) or split into those that contain an AP-1 binding motif.
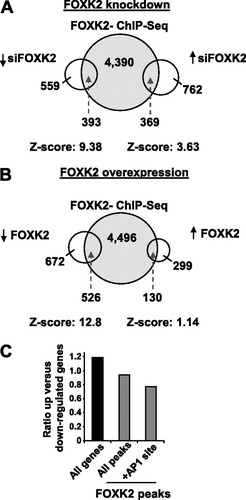
Next we performed the converse experiment, overexpressing FOXK2 in HeLa cells (see Fig. S7B in the supplemental material). In this case, microarray analysis revealed 1,198 genes whose expression decreases more than 1.25-fold and 429 whose expression increases by 1.25-fold (P values < 0.05) upon FOXK2 overexpression (B; see Table S6 in the supplemental material). In this case, however, only the gene set with decreased expression showed a significant overlap with the FOXK2 ChIP-seq data (B). Thus, when overexpressed, the predominant direct mode of action of FOXK2 appears to be repressive. This is consistent with the significant overlap of FOXK2 targets with genes whose expression increases upon FOXK2 depletion. Nevertheless, many direct FOXK2 targets show reciprocal behavior in the knockdown experiments, pointing to a potential activating role for FOXK2. We therefore further analyzed these data and compared the ratio of genes up- and downregulated by FOXK2 depletion, when partitioned according to either being associated with a FOXK2 binding region or with a FOXK2 binding region and an AP-1 binding motif. FOXK2 binding was associated with a decrease in the ratio of up- versus downregulated genes, which was further decreased when considering FOXK2 binding regions that contained AP-1 binding motifs (C). This indicates that downregulation of gene expression by FOXK2 depletion was more characteristic of direct FOXK2 targets that are also potentially coregulated by AP-1.
Collectively, these gene expression studies reveal that many FOXK2 binding events are functionally significant, with the predominant role of FOXK2 being repressive. However, FOXK2 appears to also directly influence gene expression in a positive manner, particularly when coassociated with AP-1 binding motifs.
FOXK2 and AP-1 coassociate on chromatin.
The coassociation of FOXK2 binding with AP-1 binding motifs suggests an intimate coregulatory activity between FOXK2 and AP-1 family members. To begin to probe whether this is the case, we first determined the expression of two AP-1 complex components, JUN and FOS in U2OS cells in the presence of the inducer of AP-1 activity, PMA. JUN was readily detected in serum-starved cells, whereas FOS was barely visible. However, both were rapidly induced 1 h following PMA stimulation and subsequently maintained over a 6-h time period (A). FOXK2 levels were unperturbed over this time course. Next, we tested a panel of FOXK2 binding regions located in the vicinity of KDM3A, KLF9, PDE7A, and CAPN2 for the binding of FOXK2 (B) and JUN (C) along with a positive control for AP-1 binding (MMP1 promoter) and a negative control for FOXK2 binding (MCM3 intron 9). As expected, all FOXK2 binding regions were bound by FOXK2, but in addition, binding of JUN was also detected. We also examined FOS binding to the FOXK2 binding regions in the presence and absence of PMA stimulation for 2 h. As expected, little FOS binding was detected on any of the tested regions in the absence of PMA stimulation (D). However, following induction of FOS expression by PMA treatment, substantial levels of FOS binding could be seen on all of the targets with the exception of the negative-control region MCM3int9 (D). These data are fully consistent with the overlaps observed between the ChIP-seq binding data for FOXK2 in U2OS cells and FOS and JUN from K562 cells (C).
Fig 6 FOXK2 and AP-1 coassociate on chromatin. (A) Western blot analysis of AP-1 component expression following stimulation of U2OS cells with PMA for the indicated times. Immunoblotting (IB) was performed with the indicated antibodies. (B to D) ChIP analysis of FOXK2 (B), JUN (C), and FOS (D) binding to FOXK2 binding regions. Cells were asynchronously growing except for the analysis of FOS binding, where cells were serum starved for 24 h followed by treatment with PMA for 2 h. Data are shown relative to binding to nonspecific IgG (taken as 1). Data are the averages plus standard deviations (error bars) of duplicate samples and are representative of 2 or 3 experiments. (E) Coimmunoprecipitation analysis of FOXK2 with JUN. U2OS cells were transfected with the indicated plasmids encoding Flag-tagged FOXK2 and HA-tagged JUN, followed by immunoprecipitation (IP) with anti-Flag antibody and immunoblotting (IB) with the indicated antibodies. GAPDH is a loading control. (F) Re-ChIP analysis using antibodies against FOS or JUN to reprecipitate the genomic regions associated with the indicated target genes from FOXK2 precipitated chromatin. Data are shown relative to binding to beads alone (control [Con]; taken as 1).
![Fig 6 FOXK2 and AP-1 coassociate on chromatin. (A) Western blot analysis of AP-1 component expression following stimulation of U2OS cells with PMA for the indicated times. Immunoblotting (IB) was performed with the indicated antibodies. (B to D) ChIP analysis of FOXK2 (B), JUN (C), and FOS (D) binding to FOXK2 binding regions. Cells were asynchronously growing except for the analysis of FOS binding, where cells were serum starved for 24 h followed by treatment with PMA for 2 h. Data are shown relative to binding to nonspecific IgG (taken as 1). Data are the averages plus standard deviations (error bars) of duplicate samples and are representative of 2 or 3 experiments. (E) Coimmunoprecipitation analysis of FOXK2 with JUN. U2OS cells were transfected with the indicated plasmids encoding Flag-tagged FOXK2 and HA-tagged JUN, followed by immunoprecipitation (IP) with anti-Flag antibody and immunoblotting (IB) with the indicated antibodies. GAPDH is a loading control. (F) Re-ChIP analysis using antibodies against FOS or JUN to reprecipitate the genomic regions associated with the indicated target genes from FOXK2 precipitated chromatin. Data are shown relative to binding to beads alone (control [Con]; taken as 1).](/cms/asset/874097f6-ebc7-42d5-b70f-d2e1ef14b256/tmcb_a_12273691_f0006_oc.jpg)
As FOXK2 and AP-1 transcription factors bind to the same genomic regions, we tested whether they might functionally interact and form complexes. Flag-tagged FOXK2 and HA-tagged JUN were coexpressed in U2OS cells, and immunoprecipitations were performed with an anti-Flag antibody. JUN was precipitated only when Flag-tagged FOXK2 was cotransfected (E, lane 4). Thus, FOXK2 and JUN can potentially form complexes. Therefore, next we determined whether coassociation of FOXK2 and AP-1 transcription factors could be detected on the same genomic regions through re-ChIP analysis. FOS and JUN coassociation with FOXK2 could be detected on four different FOXK2 binding regions. However, no cobinding was observed on control regions that either do not bind to FOXK2 but are AP-1 targets (LOR) or are FOXK2 targets but are not thought to be bound by AP-1 (CDKN1B) (F). FOXK2 and AP-1 transcription factors therefore coassociate on chromatin.
FOXK2 promotes AP-1 binding to chromatin and AP-1-dependent gene expression.
Given the coassociation of FOXK2 and AP-1 transcription factors on chromatin, we next determined whether they interacted functionally by determining the impact of FOXK2 depletion on the gene expression program controlled by signaling through the AP-1 transcription factor (see Table S7 in the supplemental material). FOXK2 levels in U2OS cells were depleted by siRNA transfection, and the cells were then serum starved or treated with PMA to activate signaling via AP-1. PMA treatment was for 2 h to coincide with the initial peak of FOS production. The resulting gene expression profiles were compared to cells treated with control siRNA duplexes against GAPDH. PMA treatment caused the induction of 1,699 genes by more than 1.25-fold, and 650 of these genes are direct FOXK2 targets (see Fig. S8A in the supplemental material). Importantly, the depletion of FOXK2 resulted in reduced activity of 253 of the PMA-inducible genes, and 40 to 85% of these genes were direct targets of FOXK2 as revealed by ChIP-seq (A; see Fig. S8B in the supplemental material). Thus, FOXK2 appears to have a direct role in supporting the activation of a large number of genes in response to PMA treatment. To support this conclusion, we selected several FOXK2 target genes that are induced by PMA treatment for verification by RT-PCR (see Fig. S8C). The expression of both of the FOXK2 target genes, JAG1 and SERPINE1, were significantly reduced upon depletion of FOXK2, further substantiating its role in transcriptional activation. In contrast, the expression of IER3, a PMA-responsive nontarget gene for FOXK2, was unaffected by FOXK2 loss (B). To further substantiate a role for FOXK2 in transcriptional activation, we focused on SERPINE1, as this gene is associated with several FOXK2 binding regions, one of which is within 2.5 kb of its TSS. We selected one of these binding regions that contains two AP-1 binding motifs and cloned it upstream of a luciferase reporter gene driven by a minimal promoter. The activity of this reporter is enhanced by either PMA treatment or FOXK2 overexpression and further enhanced when the two treatments are combined (C). In contrast, the control MMP-1 promoter-driven reporter construct is not activated by FOXK2, and rather, its response to PMA treatment is actually attenuated in the presence of ectopic FOXK2.
Fig 7 FOXK2 is required for AP-1 recruitment and maximal AP-1 activity. (A) Correlations between PMA-mediated gene expression in U2OS cells and FOXK2 regulatory effects. Gene expression changes (1.25-fold, P value < 0.05) caused by PMA stimulation for 2 h or by depletion of FOXK2 in the PMA-treated cells, were correlated, and the overlapping genes were compared to FOXK2 targets identified by ChIP-seq in the high-confidence data set. Significance was calculated by Z-score analysis compared to 10,000 sets of equivalently sized randomly selected genes. (B) qPCR analysis of the indicated genes in the presence of PMA stimulation for 2 h and depletion of FOXK2. Data are shown relative to each target gene in the presence of siRNA duplexes against GAPDH (taken as 1) and are the averages plus standard deviations (error bars) of three independent experiments. (C) Reporter gene analysis of the indicated promoter-reporter constructs in the presence (+) and absence (−) of PMA stimulation and/or FOXK2 overexpression. Data are the averages plus standard deviations (error bars) for three independent experiments. (D) Western blot analysis of the levels of the indicated proteins in cells treated for 2 h with PMA following depletion of GAPDH (control) or FOXK2. (E) ChIP analysis of FOS binding to FOXK2 binding regions in PMA-treated cells in the presence of siRNAs against GAPDH (control [Con]) and/or FOXK2. Data are shown relative to FOS binding in the presence of siRNA duplexes against GAPDH (taken as 1), are the averages of duplicate samples from two (for LOR) or four independent experiments. Values that are significantly different (P value of ≤0.05) from the control value are indicated by an asterisk.
![Fig 7 FOXK2 is required for AP-1 recruitment and maximal AP-1 activity. (A) Correlations between PMA-mediated gene expression in U2OS cells and FOXK2 regulatory effects. Gene expression changes (1.25-fold, P value < 0.05) caused by PMA stimulation for 2 h or by depletion of FOXK2 in the PMA-treated cells, were correlated, and the overlapping genes were compared to FOXK2 targets identified by ChIP-seq in the high-confidence data set. Significance was calculated by Z-score analysis compared to 10,000 sets of equivalently sized randomly selected genes. (B) qPCR analysis of the indicated genes in the presence of PMA stimulation for 2 h and depletion of FOXK2. Data are shown relative to each target gene in the presence of siRNA duplexes against GAPDH (taken as 1) and are the averages plus standard deviations (error bars) of three independent experiments. (C) Reporter gene analysis of the indicated promoter-reporter constructs in the presence (+) and absence (−) of PMA stimulation and/or FOXK2 overexpression. Data are the averages plus standard deviations (error bars) for three independent experiments. (D) Western blot analysis of the levels of the indicated proteins in cells treated for 2 h with PMA following depletion of GAPDH (control) or FOXK2. (E) ChIP analysis of FOS binding to FOXK2 binding regions in PMA-treated cells in the presence of siRNAs against GAPDH (control [Con]) and/or FOXK2. Data are shown relative to FOS binding in the presence of siRNA duplexes against GAPDH (taken as 1), are the averages of duplicate samples from two (for LOR) or four independent experiments. Values that are significantly different (P value of ≤0.05) from the control value are indicated by an asterisk.](/cms/asset/2101b61d-eae4-4ebb-be03-eeb01070f416/tmcb_a_12273691_f0007_oc.jpg)
Finally, we wished to probe the mechanistic basis to how FOXK2 promotes AP-1-dependent transcriptional activation. One possible role would be for FOXK2 to promote AP-1 binding to chromatin. This function would be analogous to the pioneer activity associated with the FOXA subfamily of forkhead transcription factors (Citation7, Citation24, Citation30). FOXK2 was depleted by siRNA treatment, and the binding of FOS to chromatin was examined. Importantly, FOS levels were unaffected by FOXK2 depletion (D). However, FOS binding was consistently reduced at three of the four FOXK2 binding regions tested following FOXK2 depletion (E). No such decreases were observed at a control region associated with the LOR gene which is not bound by FOXK2 but is an AP-1 target. Thus, FOXK2 plays an important role in permitting efficient recruitment of the AP-1 component FOS to chromatin.
Collectively, these data demonstrate that FOXK2 can promote transcriptional activation and is required for the efficient recruitment of AP-1 components to chromatin. Thus, FOXK2 plays a substantial role in determining the outcome of signaling through the AP-1 transcription factor complex.
DISCUSSION
There are numerous forkhead transcription factors encoded in the human genome, but we know little about how many of these function (reviewed in reference Citation18). In this study, we identified the binding sites occupied by the forkhead family member FOXK2 and demonstrate that one important function for FOXK2 is in promoting signal-dependent gene expression changes through the AP-1 transcription factor complex.
The possible association with AP-1 transcription factors was revealed by the overrepresentation of the consensus AP-1 binding motif TGA(G/C)TCA within FOXK2 binding regions identified by ChIP-seq in U2OS cells. This association is further supported by the large overlaps with ChIP-seq data for the AP-1 components FOS and JUN, even though the latter experiments were conducted with a different cell type. The recruitment of FOS and JUN to FOXK2 binding regions in U2OS cells was subsequently validated, and FOXK2 is instrumental in this process (). Importantly, this association with AP-1 binding has functional consequences, as depletion of FOXK2 has a large effect on the AP-1-mediated gene expression program (A). It is currently unclear how FOXK2 promotes AP-1 recruitment, although there are several possible mechanisms that are not mutually exclusive. The observation that FOXK2 and JUN can interact suggests that cooperativity at the level of DNA binding is possible through additive protein-protein interactions. However, unlike other cooperatively acting transcription factor pairs like RUNX1-ETS1 (Citation22), no strict spacing between FOXK2 and AP-1 binding sites is apparent, which would impose stereospecific constraints on the interaction surfaces provided by each transcription factor. An alternative might be interaction following looping of intervening DNA. Another forkhead transcription factor, FOXA1, has been shown to function as a pioneer factor that facilitates access to chromatin, thereby permitting other transcription factors such as the estrogen and androgen receptors to bind to the exposed DNA (Citation5, Citation24, Citation30). It is possible that FOXK2 might also work in this manner through its forkhead DNA binding domain, and its significant association with open chromatin () hints at such a possibility.
At this point, it is not clear what the specificity determinants are for AP-1 transcription factor recruitment and why only a subset of sites are apparently specified by FOXK2. For example, there are numerous AP-1 complex subunits and other bZIP proteins that can potentially bind to the TGA(G/C)TCA motif. Furthermore, the AP-1 motif is also overrepresented in binding regions occupied by FOXA1 in MCF7 cells (Citation30), and close associations are seen between FOXL2 binding and the occurrence of AP-1 motifs (Citation26). Importantly, the AP-1 motifs that cooccur with FOXA1 binding events show only an 8.2% overlap with those cooccurring with FOXK2, which suggests potentially redundant and specific actions for these forkhead transcription factors in this context. In the redundant mode, it is likely that due to their widely differing overall sequences beyond the forkhead DNA binding domain, the key aspect of FOX function is to provide a suitable chromatin environment, rather than cooperativity at the level of transcriptional output. Other transcription factors have also been shown to cooperate with AP-1 activity, such as NFAT on a subset of promoters (Citation21), and more globally, coassociations have been observed with the T-cell factor (TCF)–β-catenin complex (Citation3). Thus, more-complex networks exist that converge on AP-1 transcription factors exist, and they likely contribute to subpartitioning the action of signaling through AP-1 and thereby elicit unique gene expression responses to different cellular environments.
In general, the number of binding sites identified for forkhead transcription factors is high, and this is also the case for FOXK2, where there are likely tens of thousands of binding regions. Importantly, most of the features we have identified using the high-confidence data set of 8,600 binding regions derived from the intersect of two experiments can also be found within the 59,531 binding regions found in the best of our two experiments, albeit usually with lower frequency. Interestingly, however, the frequency of cooccurrence of AP-1 binding motifs in these regions increased substantially (from 19% to 26%; see Fig. S3E in the supplemental material), further emphasizing the intimate relationship between FOXK2 and AP-1 binding. It is not clear why there are so many binding regions and whether they are all functionally significant. Furthermore, FOXK2 binding regions are usually located many kilobases away from the TSS of the nearest gene (A). This distal location might reflect the need to retain active chromatin regions away from the proximal promoters and hence permit accessibility by AP-1 transcription factors. This distribution is also similar to that seen with many other transcription factors, including other forkhead transcription factors (e.g., FOXA1, FOXA2, FOXA3) (Citation30, Citation34, Citation44) but differs from other transcription factors like GABPα (Citation43), which exhibits strong promoter-proximal binding. It is currently unclear what the underlying mechanistic differences are between transcription factors with broad genomic distributions compared to those which act in a more promoter-proximal manner.
It is possible that in different cell types, different forkhead transcription factors bind to the same sites depending on their relative abundance. Indeed, the fact that the core sequence GTAAACA is identified as a binding motif for many forkhead transcription factors hints at such a possibility. However, the overlap in binding regions occupied by FOXK2 and other forkhead proteins studied thus far is relatively low (E), suggesting that functional redundancy at the level of DNA binding is not particularly widespread. Further specificity might be embedded in additional combinatorial interactions or in regions flanking the core GTAAACA motif. In the case of FOXK2, the sequence WWWGTAAACAWG (7% of all such motifs in the genome) is more enriched than the core GTAAACA motif (0.8% of all such motifs in the genome) in its binding regions. Further studies are needed to further explore the basis to binding specificity generation.
The biological function of FOXK2 and mechanism of action are unclear. However, our study provides important advances in addressing these key issues. First, gene ontology studies suggest important roles of FOXK2 in controlling the expression of genes associated with cellular signaling pathways, transcriptional control, apoptosis, and cell movement (F; see Fig. S5 and Table S3 in the supplemental material). All these processes are responsive to a changing cellular environment, and hence to signal-dependent gene expression changes, such as those elicited by the AP-1 transcription factors (reviewed in reference Citation20). Indeed, FoxK has been shown to be important in TGFβ signaling in flies (Citation6), which is consistent with our observation that TGFβ signaling appears as one of the most enriched GO terms for genes associated with FOXK2 binding regions. However, in flies, transforming growth factor β (TGFβ) signaling acts upstream, rather than downstream. Importantly though, genetic studies indicate that FoxK in flies works in a combinatorial manner with Dfos/AP-1, suggesting that the association of FOXK transcription factors with AP-1 signaling is evolutionarily conserved. Thus, FOXK2 appears to have a broad role in potentially controlling the expression of gene expression programs which underpin some of the central decision points that a cell makes. It is unclear whether FOXK2 is an activator or a repressor protein as previously suggested (Citation33). The latter would be consistent with the observation made on the closely related mouse homologue of FOXK1, as current evidence suggests that this is also a repressor (Citation45). Our overexpression studies are supportive of a repressive role for FOXK2, as no significant increases in gene expression were observed upon FOXK2 expression (B). However, our siRNA depletion studies suggest a more bivalent role for FOXK2 as a repressor and activator depending on the gene target and signaling conditions, as significant changes in the up- and downregulation of gene expression were observed upon FOXK2 loss (A and A). In this scenario, one likely role for FOXK2 is to maintain the chromatin in an open state to facilitate either transcriptional repressive or activating events to occur.
In summary, our study provides novel insight into FOXK2 function and its association with gene regulatory events on a genome-wide scale. Little was previously known about this transcription factor, but its functional association with AP-1-mediated gene regulatory events demonstrates an important role in coordinating signal-dependent gene expression changes.
tmcb_a_12273691_sm0001.pdf
Download PDF (326.9 KB)tmcb_a_12273691_sm0002.xls
Download MS Excel (3.2 MB)tmcb_a_12273691_sm0003.xls
Download MS Excel (6.9 MB)tmcb_a_12273691_sm0004.xls
Download MS Excel (5.6 MB)tmcb_a_12273691_sm0005.xls
Download MS Excel (7.9 MB)tmcb_a_12273691_sm0006.xls
Download MS Excel (401 KB)tmcb_a_12273691_sm0007.xls
Download MS Excel (706.5 KB)tmcb_a_12273691_sm0008.xls
Download MS Excel (1.5 MB)tmcb_a_12273691_sm0009.xls
Download MS Excel (4 MB)tmcb_a_12273691_sm0010.pdf
Download PDF (356.8 KB)ACKNOWLEDGMENTS
We thank Karren Palmer, Leanne Wardleworth, and Claire Haslam for excellent technical assistance; Life Technologies team members Chris Allen and Liqun He for sequencing analysis; Catherine Millar and members of our laboratory for comments on the manuscript and stimulating discussions; and Richard Gaynor, Michael Rudnicki, and Alan Whitmarsh for reagents.
This work was supported by the NIHR Manchester Biomedical Research Centre, the Wellcome Trust, and a Royal Society-Wolfson award to A.D.S.
SUPPLEMENTAL MATERIAL
Supplemental material for this article may be found at http://dx.doi.org/10.1128/MCB.05504-11.
REFERENCES
- Bolstad BM, Irizarry RA, Astrand M, Speed TP. 2003. A comparison of normalization methods for high density oligonucleotide array data based on variance and bias. Bioinformatics 19:185–193.
- Boros J, et al. 2009. Elucidation of the ELK1 target gene network reveals a role in the coordinate regulation of core components of the gene regulation machinery. Genome Res. 19: 1963–1973.
- Bottomly D, Kyler SL, McWeeney SK, Yochum GS. 2010. Identification of {beta}-catenin binding regions in colon cancer cells using ChIP-Seq. Nucleic Acids Res. 38: 5735–5745.
- Carlsson P, Mahlapuu M. 2002. Forkhead transcription factors: key players in development and metabolism. Dev. Biol. 250: 1–23.
- Carroll JS, et al. 2005. Chromosome-wide mapping of estrogen receptor binding reveals long-range regulation requiring the forkhead protein FoxA1. Cell 122: 33–43.
- Casas-Tinto S, Gomez-Velazquez M, Granadino B, Fernandez-Funez P. 2008. FoxK mediates TGF-beta signalling during midgut differentiation in flies. J. Cell Biol. 183: 1049–1060.
- Eeckhoute J, et al. 2009. Cell-type selective chromatin remodeling defines the active subset of FOXA1-bound enhancers. Genome Res. 19: 372–380.
- ENCODE Project Consortium. 2007. Identification and analysis of functional elements in 1% of the human genome by the ENCODE pilot project. Nature 447: 799–816.
- Freddie CT, Ji Z, Marais A, Sharrocks AD. 2007. Functional interactions between the Forkhead transcription factor FOXK1 and the MADS-box protein SRF. Nucleic Acids Res. 35: 5203–5212.
- Fujii Y, Nakamura M. 2010. FOXK2 transcription factor is a novel G/T-mismatch DNA binding protein. J. Biochem. 147: 705–709.
- Fujiwara T, et al. 2009. Discovering hematopoietic mechanisms through genome-wide analysis of GATA factor chromatin occupancy. Mol. Cell 36: 667–681.
- Garry DJ, et al. 2000. Myogenic stem cell function is impaired in mice lacking the forkhead/winged helix protein MNF. Proc. Natl. Acad. Sci. U. S. A. 97: 5416–5421.
- Gaulton KJ, et al. 2010. A map of open chromatin in human pancreatic islets. Nat. Genet. 42: 255–259.
- Geisberg JV, Struhl K. 2004. Quantitative sequential chromatin immunoprecipitation, a method for analyzing co-occupancy of proteins at genomic regions in vivo. Nucleic Acids Res. 32: e151.
- Georges AB, Benayoun BA, Caburet S, Veitia RA. 2010. Generic binding sites, generic DNA-binding domains: where does specific promoter recognition come from? FASEB J. 24:346–356.
- Giresi PG, Kim J, McDaniell RM, Iyer VR, Lieb JD. 2007. FAIRE (Formaldehyde-Assisted Isolation of Regulatory Elements) isolates active regulatory elements from human chromatin. Genome Res. 17: 877–885.
- Goecks J, Nekrutenko A, Taylor J, Galaxy Team. 2010. Galaxy: a comprehensive approach for supporting accessible, reproducible, and transparent computational research in the life sciences. Genome Biol. 11: R86.
- Hannenhalli S, Kaestner KH. 2009. The evolution of Fox genes and their role in development and disease. Nat. Rev. Genet. 10:233–240.
- Hawke TJ, Jiang N, Garry DJ. 2003. Absence of p21CIP rescues myogenic progenitor cell proliferative and regenerative capacity in Foxk1 null mice. J. Biol. Chem. 278: 4015–4020.
- Hess J, Angel P, Schorpp-Kistner M. 2004. AP-1 subunits: quarrel and harmony among siblings. J. Cell Sci. 117: 5965–5973.
- Hoey T, Sun YL, Williamson K, Xu X. 1995. Isolation of two new members of the NF-AT gene family and functional characterization of the NF-AT proteins. Immunity 2: 461–472.
- Hollenhorst PC, et al. 2009. DNA specificity determinants associate with distinct transcription factor functions. PLoS Genet. 5: e1000778.
- Huang DW, Sherman BT, Lempicki RA. 2009. Systematic and integrative analysis of large gene lists using DAVID bioinformatics resources. Nat. Protoc. 4:44–57.
- Hurtado A, Holmes KA, Ross-Innes CS, Schmidt D, Carroll JS. 2011. FOXA1 is a key determinant of estrogen receptor function and endocrine response. Nat. Genet. 43: 27–33.
- Johnson WE, et al. 2006. Model-based analysis of tiling-arrays for ChIP-chip. Proc. Natl. Acad. Sci. U. S. A. 103: 12457–12462.
- Kim SY, et al. 2009. Foxl2, a forkhead transcription factor, modulates nonclassical activity of the estrogen receptor-alpha. Endocrinology 150: 5085–5093.
- Komorek J, et al. 2010. Adenovirus type 5 E1A and E6 proteins of low-risk cutaneous beta-human papillomaviruses suppress cell transformation through interaction with FOXK1/K2 transcription factors. J. Virol. 84: 2719–2731.
- Li C, Lai CF, Sigman DS, Gaynor RB. 1991. Cloning of a cellular factor, interleukin binding factor, that binds to NFAT-like motifs in the human immunodeficiency virus long terminal repeat. Proc. Natl. Acad. Sci. U. S. A. 88: 7739–7743.
- Li C, Wong WH. 2001. Model-based analysis of oligonucleotide arrays: expression index computation and outlier detection. Proc. Natl. Acad. Sci. U. S. A. 98: 31–36.
- Lupien M, et al. 2008. FoxA1 translates epigenetic signatures into enhancer-driven lineage-specific transcription. Cell 132: 958–970.
- Maglott D, Ostell J, Pruitt KD, Tatusova T. 2011. Entrez Gene: gene-centered information at NCBI. Nucleic Acids Res. 39: D52–D57.
- Mahony S, Benos PV. 2007. STAMP: a web tool for exploring DNA-binding motif similarities. Nucleic Acids Res. 35: W253–W258.
- Marais A, et al. 2010. Cell cycle-dependent regulation of the Forkhead transcription factor FOXK2 by CDK-cyclin complexes. J. Biol. Chem. 285: 35728–35739.
- Motallebipour M, et al. 2009. Differential binding and co-binding pattern of FOXA1 and FOXA3 and their relation to H3K4me3 in HepG2 cells revealed by ChIP-seq. Genome Biol. 10: R129.
- Nirula A, Moore DJ, Gaynor RB. 1997. Constitutive binding of the transcription factor interleukin-2 (IL-2) enhancer binding factor to the IL-2 promoter. J. Biol. Chem. 272:7736–7745.
- Norrmén C, et al. 2009. FOXC2 controls formation and maturation of lymphatic collecting vessels through cooperation with NFATc1. J. Cell Biol. 185: 439–457.
- O'Donnell A, Yang SH, Sharrocks AD. 2008. MAP kinase-mediated c-fos regulation relies on a histone acetylation relay switch. Mol. Cell 29: 780–785.
- Pavesi G, Mereghetti P, Mauri G, Pesole G. 2004. Weeder Web: discovery of transcription factor binding sites in a set of sequences from co-regulated genes. Nucleic Acids Res. 32: W199–W203.
- Pierrou S, Hellqvist M, Samuelsson L, Enerbäck S, Carlsson P. 1994. Cloning and characterization of seven human forkhead proteins: binding site specificity and DNA bending. EMBO J. 13: 5002–5012.
- Shin H, Liu T, Manrai AK, Liu XS. 2009. CEAS: cis-regulatory element annotation system. Bioinformatics 25: 2605–2606.
- Smyth GK. 2004. Linear models and empirical Bayes for assessing differential expression in microarray experiments. Stat. Appl. Genet. Mol. Biol. 3(1): Article3.
- Storey JD, Tibshirani R. 2003. Statistical significance for genomewide studies. Proc. Natl. Acad. Sci. U. S. A. 100:9440–9445.
- Valouev A, et al. 2008. Genome-wide analysis of transcription factor binding sites based on ChIP-Seq data. Nat. Methods 5: 829–834.
- Wallerman O, et al. 2009. Molecular interactions between HNF4a, FOXA2 and GABP identified at regulatory DNA elements through ChIP-sequencing. Nucleic Acids Res. 37: 7498–7508.
- Yang Q, et al. 2000. The winged-helix/forkhead protein myocyte nuclear factor beta (MNF-beta) forms a co-repressor complex with mammalian sin3B. Biochem. J. 345: 335–343.
- Zhang Y, et al. 2008. Model-based analysis of ChIP-Seq (MACS). Genome Biol. 9: R137.