Abstract
Complex behaviors, such as learning and memory, are associated with rapid changes in gene expression of neurons and subsequent formation of new synaptic connections. However, how external signals are processed to drive specific changes in gene expression is largely unknown. We found that the genome organizer protein Satb1 is highly expressed in mature neurons, primarily in the cerebral cortex, dentate hilus, and amygdala. In Satb1-null mice, cortical layer morphology was normal. However, in postnatal Satb1-null cortical pyramidal neurons, we found a substantial decrease in the density of dendritic spines, which play critical roles in synaptic transmission and plasticity. Further, we found that in the cerebral cortex, Satb1 binds to genomic loci of multiple immediate early genes (IEGs) (Fos, Fosb, Egr1, Egr2, Arc, and Bdnf) and other key neuronal genes, many of which have been implicated in synaptic plasticity. Loss of Satb1 resulted in greatly alters timing and expression levels of these IEGs during early postnatal cerebral cortical development and also upon stimulation in cortical organotypic cultures. These data indicate that Satb1 is required for proper temporal dynamics of IEG expression. Based on these findings, we propose that Satb1 plays a critical role in cortical neurons to facilitate neuronal plasticity.
INTRODUCTION
Neuronal circuits are capable of executing complex functions, such as storing memories and influencing behaviors in response to a variety of stimuli. These unique properties are based on highly plastic mechanisms that control expression of multiple genes in each individual neuron (Citation20, Citation28). Environmental stimuli induce neurons to become depolarized, triggering Ca2+ influx and cAMP production (Citation51, Citation54), leading to activation of specific signaling cascades, inducing rapid and major changes in gene expression that result in synaptic activity (Citation9, Citation38).
Because neurons are specialized cells that must continuously reprogram gene expression in response to stimulation, they may be equipped with mechanisms to regulate genome-wide gene expression at the level of nuclear architecture to facilitate this process. We hypothesized that Satb1 may play a role in reprogramming gene expression in neurons. We previously identified Satb1 (the mouse version of the protein) as a T cell factor which is essential for T cell activation (Citation3, Citation14, Citation23). Satb1 targets specialized DNA sequences onto the Satb1 regulatory network and functions in chromatin organization and epigenomic modification (Citation13, Citation94). Specialized DNA sequences are found throughout the genome and are characterized by ATC sequence contexts highly potentiated for nucleotide base unpairing (Citation7, Citation23, Citation46, Citation66). One such sequence, located 3′ of the immunoglobulin heavy chain gene (IgH) enhancer, corresponding to a matrix attachment region (MAR) (Citation19), was used to clone SATB1 (the capital letters indicate the human version of the protein) (Citation7, Citation23, Citation46, Citation66). In human breast cancer cells, SATB1 reprograms the expression profile of ∼1,000 genes, promoting breast cancer metastasis (Citation33).
We previously showed that mice in which the Satb1 gene is knocked out (Satb1-null mice) (Citation3) exhibit by 2 weeks of age a hind limb-clasping reflex, indicating neurological disorder. Unlike Satb1-null mice, Satb2-null mice do not survive past postnatal day 0 (P0), indicating the essential role of Satb2 (a Satb1 homolog) in embryonic development (Citation2). In the mouse brain, Satb1 and Satb2 are expressed in the embryonic stage, beginning at embryonic day 13.5 (E13.5) and E11.5, respectively (Citation11, Citation27). In the developing cerebral cortex (Cx), Satb2 regulates callosal projection neuron identity by repressing Ctip2, a gene required for the formation of the corticospinal tract. In the Satb2-null cortex, at E18.5, the layer identity is altered (Citation2, Citation12, Citation27). In wild-type mice, Satb2 expression quickly disappears from the brain after birth (Citation11). However, there have been no reports regarding Satb1 expression and activity in the postnatal brain.
We found that Satb1 is the major Satb-family protein in postnatal brains and is expressed exclusively in a subset of mature neurons. To understand the roles of Satb1 in the postnatal brain, we analyzed the cortices of wild-type and Satb1-null mice, aiming to identify its target genes. In this study, we focused on genes with key functions in neuronal plasticity: cAMP-responsive element (CRE)-, serum-responsive element (SRE)-, and Ca2+-responsive element (CaRE)-containing genes, which are activated in neurons upon stimulation (Citation51, Citation54), including immediate early genes (IEGs). IEGs are known to be induced transiently and rapidly at the transcriptional level in response to a diverse array of extracellular stimuli and play critical roles in synaptic plasticity and ultimately in learning and memory (Citation63). Here we have shown that Satb1 binds to genomic loci of multiple IEGs and is required for proper temporal expression and levels of these genes during postnatal cortical development. We also found a significant decrease in dendritic spine density in Satb1-null cortices. Together, our results suggest that Satb1 plays an important role in neuronal function, both by affecting the formation of dendritic spines and by modulating the expression of IEGs.
MATERIALS AND METHODS
Tissue processing.
All mice were euthanized by CO2 gas. Brains used for RNA or protein extraction were quickly removed and frozen on dry ice. Mice were treated according to Lawrence Berkeley National Laboratory's Animal Care and Use Program. The animal protocol was approved by the Animal Welfare and Regulatory Committee at Lawrence Berkeley Laboratory (AWRC no. 12403 and 12501).
IF staining.
Ten-micrometer-thick fresh frozen sections were fixed in 4% buffered paraformaldehyde and incubated for 30 min with blocking solution (1% bovine serum albumin [BSA], 0.1% cold fish gelatin, 0.1% Triton X-100, 0.05% Tween 20 in phosphate-buffered saline [PBS]), followed by incubation with primary antibody at 4°C overnight and with proper secondary antibody (Alexa 594 conjugated for red color and Alexa 488 conjugated for green color from Bio-Rad; 1:500 dilution in 0.05% Tween 20 in PBS) at room temperature for 1 h. The following dilutions for primary antibodies were used: rat anti-Ctip2 antibody (1:250; Abcam), rabbit anti-Tbr1 antibody (1:250; Abcam), mouse anti-Fos antibody (1:50; Santa Cruz Biotechnology), mouse anti-NeuN monoclonal antibody (MAb) (1:500; Chemicon), mouse anti-Gfap MAb (1:500; Chemicon), rabbit anti-Satb1 polyclonal 1583 (preabsorbed with Satb1-null mouse brain [1:1,000], resulting in Satb1 specificity) and commercial anti-Satb1 antibody 49061 (Abcam; also purified-Satb1 specific), rabbit anti-Satb2 (1:1,000, in-house preparation, no cross-reactivity to Satb1, showing Satb2 specificity), as well as mouse anti-vGlut2 monoclonal antibody (1:200; Abcam) and mouse anti-Gad67 (1:500; Millipore). 4′,6-Diamidino-2-phenylindole (DAPI) (1 μg/ml in PBS) was used for counterstaining for 1 min, followed by PBS washing. Immunofluorescence (IF) images were captured by an upright microscope (Olympus BX51) using 10× and 20× objectives with a digital camera (Spot RT Slider; Diagnostic). Three-dimensional images were captured by an inverted microscope (Olympus IX71 Delta) using a 100× objective with a digital camera (Cool Snap HQ2; Photometrics), analyzed by DeltaVision deconvolution microscopy (10-μm thickness by 20 images captured; Applied Precision), and presented as stacked images.
RNA fluorescent in situ hybridization (FISH).
To amplify Satb1- or Satb2-specific cDNA fragments, the following primers were used: SB1_5UTR_IS-F (5′-GGGAAGAGAAAATAATACA-3), SB1_5UTR_IS-R (5′-TTTCCTAAGGTTGGTTTTC-3′), SB2_5UTR_IS-F (5′-ATCATCATCATAACAACCATCTCC-3′), SB2_5UTR_IS-R (5′-GCTCCAGCCGGGCCACCTTCAC-3′), SB2_3UTR_IS-F (5′-GAGATGTACAAAGTGGAGGCTGAG-3′), and SB2_3UTR_IS-R (5′-CTGTGAAGTGGTATTAGTTTTTAT-3′). Linearized plasmids containing cloned cDNA fragments were used as templates for antisense and sense cRNA probe synthesis with T7 and T3 polymerase (Promega) and premixed RNA-labeling nucleotide mixes containing digoxigenin or fluorescein (Roche Molecular Biochemicals). Ten-micrometer-thick frozen sections were fixed in 4% buffered paraformaldehyde followed by 1.35% triethanolamine (pH 8.0) and 0.25% acetic anhydride treatment and then incubated with prehybridization buffer (50% formamide, 5× SSC [1× SSC is 0.15 M NaCl plus 0.015 M sodium citrate], and salmon sperm DNA [40 μg/ml]). Fluorescein-labeled Satb1 5′ untranslated region (5′UTR)-specific and digoxigenin-labeled Satb2 3′UTR- and 5′UTR-specific riboprobes in hybridization buffer were added to sections and hybridized at 65°C for 16 h. After hybridization, sections were washed, equilibrated, and blocked with 0.5% blocking reagent (Perkin Elmer Life Science) for 30 min. We incubated slides with rabbit antibody against fluorescein conjugated to peroxidase (1:500; Roche) at room temperature for 1 h, washed slides with TN buffer containing 0.05% Tween 20, and visualized the signal by using fluorescein tyramide (TSA-Plus fluorescence system; Perkin Elmer Life Science). We quenched the remaining peroxidase activity by incubating slides with 3% H2O2 solution in PBS for 60 min. To generate a Satb2-specific signal, we used rabbit antibody against digoxigenin conjugated to peroxidase (1:500; Roche) and tetramethyl rhodamine isocyanate (TRITC) tyramide (TSA-Plus fluorescence system; Perkin Elmer Life Science) as described above. Slides were mounted in fluorescent mounting medium containing DAPI (Vector Laboratories).
Western assay and anti-Satb1 antibodies.
We extracted proteins from whole cortex (after carefully removing the hippocampus) of P13-P14 Satb1-null and wild-type mouse brains in RIPA buffer without SDS (50 mM Tris, pH 8.0, 0.15 M NaCl, 1% NP-40, 0.5% Na-Deoxycholate). The samples were centrifuged at 15,000 rpm for 5 min using a Tomy microcentrifuge, and supernatant was either directly used or aliquoted and frozen at −80°C. Equal amounts of extracts based on the level of tubulin were boiled in buffer containing SDS, electrophoresed on an 8% polyacrylamide gel containing 0.1% SDS, and transferred to Immobilon-P membranes (Millipore). The blots probed with primary antibodies were then incubated with peroxidase-conjugated goat anti-rabbit or anti-mouse IgGs (1:5,000 to 1:15,000; Bio-Rad). Blots were washed, and Western blots were developed using ECL reagents (Pierce). The chemiluminescence signal was detected either by X-ray film exposure or by using a Kodak imager (Image Station 4000MM). Satb1-specific antibody was prepared as follows: anti-Satb1 rabbit antiserum (in-house prepared; no. 1583) was absorbed with acetone powder of Satb1-null mouse brains (2 weeks old; equivalent of 3 mice) and tested for reactivity to wild-type and Satb1-null mouse brains by IF (1:1,000 final dilution) (as shown in ) or by Western assay (1:1,000 final dilution) (see ). Anti-Satb2 antibodies (in-house prepared; no. 3356) were used without any further purification (1:1,000 dilution in IF and Western assay). Mouse anti-Satb1 monoclonal antibody (BD Biosciences), which shows cross-reactivity to Satb2, was also used in a Western assay at a 1:200 dilution. Purified anti-Satb1 polyclonal antibody (Abcam) also showed Satb1 specificity in IF and Western assays.
Fig 1 Satb1 levels are much higher in discrete regions in postnatal mouse brain than Satb2 levels. Immunostaining of P13 wild-type brain coronal sections with Satb1-specific (A) or Satb2-specific (B) antibodies counterstained with DAPI is shown. The boxed area of the hippocampus in panels A and B is magnified for Satb1 and Satb2 at the right. Representative images of nuclear localization of Satb1 in wild-type brain are shown (C, basolateral amygdala neuron). RNA FISH of P13 wild-type coronal sections with Satb1-specific (green in panel D) and Satb2-specific (red in panel D) antisense riboprobes and a merged image of these stainings (D) is shown. The boxed area in panel D (cerebral cortex) is magnified at the right, indicating that Satb1 and Satb2 have a distinct distribution in the cortex. Satb1 is specific in the amygdala, as indicated with arrows (A and B [for IF] or D [for FISH]). Scale bar, 500 μm (A, B, and D) or 5 μm (C). (E) Satb1 and Satb2 cortical protein levels in wild-type mice were determined at different ages by Western blotting using anti-Satb1 mouse monoclonal antibody (a) (BD Biosciences; reacts with both Satb1 and Satb2 proteins), purified anti-Satb1 rabbit polyclonal antibody (b) (Satb1-specific), or anti-Satb2 polyclonal antibody (c) (Satb2 specific) (see Materials and Methods). Anti-tubulin-α antibody was used for loading control measurement. (F) Relative transcript levels of Satb1 and Satb2 in cortex at different ages (1 day [1d] to 5 weeks [5w]) were measured by qPCR (RT2 qPCR primers; SABiosciences). The value for each time point represents the average for three replicates. These data indicate that Satb1 is the major component of the Satb family in the postnatal cerebral cortex.
![Fig 1 Satb1 levels are much higher in discrete regions in postnatal mouse brain than Satb2 levels. Immunostaining of P13 wild-type brain coronal sections with Satb1-specific (A) or Satb2-specific (B) antibodies counterstained with DAPI is shown. The boxed area of the hippocampus in panels A and B is magnified for Satb1 and Satb2 at the right. Representative images of nuclear localization of Satb1 in wild-type brain are shown (C, basolateral amygdala neuron). RNA FISH of P13 wild-type coronal sections with Satb1-specific (green in panel D) and Satb2-specific (red in panel D) antisense riboprobes and a merged image of these stainings (D) is shown. The boxed area in panel D (cerebral cortex) is magnified at the right, indicating that Satb1 and Satb2 have a distinct distribution in the cortex. Satb1 is specific in the amygdala, as indicated with arrows (A and B [for IF] or D [for FISH]). Scale bar, 500 μm (A, B, and D) or 5 μm (C). (E) Satb1 and Satb2 cortical protein levels in wild-type mice were determined at different ages by Western blotting using anti-Satb1 mouse monoclonal antibody (a) (BD Biosciences; reacts with both Satb1 and Satb2 proteins), purified anti-Satb1 rabbit polyclonal antibody (b) (Satb1-specific), or anti-Satb2 polyclonal antibody (c) (Satb2 specific) (see Materials and Methods). Anti-tubulin-α antibody was used for loading control measurement. (F) Relative transcript levels of Satb1 and Satb2 in cortex at different ages (1 day [1d] to 5 weeks [5w]) were measured by qPCR (RT2 qPCR primers; SABiosciences). The value for each time point represents the average for three replicates. These data indicate that Satb1 is the major component of the Satb family in the postnatal cerebral cortex.](/cms/asset/145c3c70-099b-4610-80ed-af2f75777446/tmcb_a_12273696_f0001_oc.jpg)
RNA isolation and quantitative real-time PCR (qPCR).
We extracted total RNA from whole cortex of P13-P14 Satb1-null and wild-type mice in Trizol (Sigma). We used 2 μg of each total RNA for first-strand cDNA synthesis, with oligo(dT)15 primer mixed with random hexamers and Superscript II RNase H reverse transcriptase (Invitrogen), following the manufacturer's protocol. For detailed analysis of genes related to the cAMP/Ca2+ signaling pathway, an RT2 Profiler PCR array (SABiosciences) was used according to the manufacturer's protocol. A combination of three different housekeeping genes (Gusb, Hprt, and Hsp90ab1) was used to normalize the data.
ChIP-qPCR assay for in vivo DNA binding.
Our previously described urea chromatin immunoprecipitation (ChIP) followed by qPCR (urea-ChIP-qPCR) (Citation36) was carefully modified for brain-ChIP-qPCR experiments in this study. First, we prepared single-cell suspensions from P13 to P14 wild-type brains by scraping the tissue through a 70-μm strainer (BD Biosciences) and cross-linked chromatin by incubating cells in Dulbecco's phosphate-buffered saline (D-PBS) containing 1% formaldehyde (methanol free; Thermo Scientific) for 5 min at 37°C in a water bath. The cross-linked chromatin was purified from proteins and RNA by 8 M urea gradient centrifugation (Beckman ultracentrifuge TL100 using a swing rotor at 20°C for 8 h at 50,000 rpm), and the precipitated chromatin was subjected to sonication by a BioRuptor instrument (diagenode/UCD200, on high, 7× pulse) or BfuC1 restriction enzyme digestion (New England Biolabs) and preabsorption by incubating with protein A Dynabeads (Invitrogen). The ChIP was performed as follows: the precleaned chromatin (40 μg) was mixed with anti-Satb1 antibody (1:100 dilution) or preimmune serum as a control for 1 h at room temperature, followed by an overnight incubation at 4°C with protein A Dynabeads. The chromatin fragments on beads were washed four times with 1% NP-40 in 1× PBS and two times with washing buffer (10 mM Tris-HCl, pH 8.0, 250 mM LiCl, 0.5% NP-40, 0.5% sodium deoxycholate, and 1 mM EDTA). The chromatin DNAs were recovered from the Dynabeads in 40 μl of Tris-EDTA (TE) at 95°C for 10 min and then subjected to qPCR without further purification. For putative Satb1 target genes we designed primer sequences which focused mainly on the promoter regions of each gene (20-kb upstream area and the first intron). Primers were designed to amplify regions containing potential Satb1-binding loci (ATC sequences) (Citation22), marked by red numbers under the genomic sequence map in , as well as regions lacking such loci as potential negative controls. The Satb1-binding sites are marked by red stars on columns in ; those sites determined as Satb1 binding positive show more than 3-fold-higher signal amplification compared to an internal negative site.
Cortical explant cultures.
Cortical explant cultures (P7 cerebral cortex dissected into 300-μm cubes) were performed on a culture insert (0.4 μm, Millicell-CM; Millipore) immersed in medium (25% horse serum, 0.25× Hanks balanced salt solution, 25 mM HEPES in Dulbecco's modified Eagle medium [DMEM]) in 6-well plates. After 10 days of culture, treatment with 25 μM forskolin (FK) (Sigma) in 0.1% dimethyl sulfoxide (DMSO) was used to induce elevated levels of cAMP. Treatment with 0.1% DMSO was used as a control (0 h). Total RNA was extracted from treated cultures, followed by cDNA synthesis as described above. The RT2 Profiler PCR array qPCR system (cAMP/Ca2+ signaling pathway; SABiosciences) was used to determine the expression levels of cAMP/Ca2+-responsive genes at different time points in wild-type and Satb1-null brain cultures.
Golgi-Cox staining.
Male mice (wild-type and Satb1-null, 4 each) were euthanized with CO2 gas inhalation, and brains were immersed in freshly prepared impregnation solution (FD Rapid GolgiStain kit; FD Neurosciences). Brains were processed according to the protocol provided by the company. Neurons were first identified at a lower power (10× objective) under a light microscope, and then four completely stained neurons in each selected brain region (M1 and AuV regions of the cerebral cortex) were traced under a 20× objective using the “camera lucida” method. Cells to be drawn were randomly selected for each drawing. For a cell to be included in the analysis, the overall cellular morphology had to be that of a cortical pyramidal neuron; the dendritic tree was well impregnated, not obscured by stain precipitate, blood vessels, or astrocytes, and appeared largely intact and visible in the focal plane of the section. Spine density was quantified by counting spines on dendrites. Statistical analyses were performed on averages across cells per region for each animal. Group differences were assessed using an unpaired Student t test (P < 0.01).
RESULTS
Satb1 and Satb2 expression are region specific in mature neurons in the postnatal brain.
To study the role of Satb1 in the postnatal mouse brain, we first determined the expression patterns of Satb1 and Satb2 in coronal (representative images in ) and sagittal (data not shown) sections of wild-type and Satb1-null mouse brains at P13-P14, using immunostaining and RNA fluorescent in situ hybridization (RNA FISH) methods. Satb1-null mice are generally small but remain active up to 2 weeks of age, though their health rapidly declines after 2.5 weeks and they fail to survive after weaning (Citation3).
We employed polyclonal rabbit antibodies specific for Satb1 and Satb2 for immunofluorescence (IF) assay with mouse brain sections (see Materials and Methods). In wild-type brain, we detected strong and widely distributed Satb1-specific signals in the cortex and amygdala as shown in A (amygdala is shown with an arrow). In the hippocampus, hilar cells of the dentate gyrus were uniquely and strongly stained by Satb1-specific antibody, along with some cells in the radial and stratum oriens layers of the hippocampus (A, dashed box; high magnification is shown on the right). In contrast, our purified anti-Satb1 antibody did not detect any signal in Satb1-null mice (see Fig. S1A, Satb1-null, in the supplemental material), confirming its specificity to Satb1. In addition, the immunostained signals in the wild-type amygdala and dentate hilar cells were Satb1 positive but Satb2 negative, indicating that these regions specifically and exclusively express Satb1 (A and B, amygdala indicated with an arrow). In the hippocampus, Satb2 is expressed in the CA1 region and not in the hilar cells (B). Satb1 nuclear distribution was found to resemble that of a finely spread spider web in both amygdala (C) and cortical neurons (data not shown). Satb1 distribution appears restricted to the DAPI-light region, avoiding the DAPI-dense region (presumably heterochromatin), similar to its distribution in thymocytes (Citation13). To study whether any cells in the cortex express both Satb1 and Satb2, we employed two color RNA FISH (D) to distinguish Satb1 and Satb2 transcripts and confirmed that cells in the amygdala express Satb1 (D, green, indicated by an arrow) but not Satb2 (D, red, indicated by an arrow). We also confirmed that the cortex contains cells expressing either Satb1 or Satb2 (D, green for Satb1 and red for Satb2) and a subpopulation of cells expressing both Satb1 and Satb2 RNAs (D, dashed box, high magnification on the right). RNA FISH for Satb1 gave no signal in Satb1-null mouse brain, validating its specificity for Satb1 (data not shown). Both Satb1 and Satb2 expression were detected in the early postnatal cortex, and yet primary expression sites were significantly different for the two proteins (A and B). Satb1 is minimal in the outer and innermost layers, and its expression is more concentrated in the middle layers (A and D, green), while Satb2 signals are more intense in the outer and innermost layers (B and D, red). A large number of cells express only Satb1 or Satb2, suggesting specific roles in the cortex for each family member.
To test whether Satb1 is expressed in neurons, we performed double immunostaining with anti-Satb1-specific antibody and an antibody either for the neuronal marker NeuN or for the astrocyte marker Gfap. All cells expressing Satb1 were also NeuN positive in all brain areas examined, including the cortex and dentate gyrus, but we did not detect any coexpression of Gfap and Satb1 (see Fig. S1C and S1D in the supplemental material). Together with findings from FISH and IF experiments (), these data indicate that Satb1 is expressed exclusively in neurons in a subregion-specific manner in the postnatal brain.
Satb1 is expressed at high levels in the postnatal brain.
We used an immunoblot to compare the relative cortical expression levels of Satb1 and Satb2 at different postnatal time points. Although it is difficult to directly compare between Satb1 and Satb2 protein levels because two different antibodies were used for each protein, the data are consistent with previous reports that Satb2 is quickly downregulated postnatally within 1 week (Citation11), while Satb1 protein is maintained at high levels (E). We next analyzed the relative levels of Satb1 and Satb2 transcripts by qPCR, using primer sets specifically designed to make a direct comparison of their transcript levels (RT2 qPCR primer; SABiosciences). The transcript level of Satb1 peaked at the first week postnatally. Past this time and through the remaining early phase of postnatal life, this level remained constant at 60 to 70% of the initial level observed at 1 day old (1d) (F). In stark contrast, the transcript levels of Satb2, which started low (30% of Satb1 at 1d), immediately decreased even further after birth, consistent with the rapid downregulation of the Satb2 protein (Citation11, Citation27). Satb2 remained at a very low level thereafter (less than 10% of the level at 1d). After 1 postnatal week, the transcript levels of Satb1 were consistently >10 times those of Satb2. The results for Satb1 and Satb2 transcript patterns in the early postnatal cortex are consistent with those for their protein expression (E and F). The results show that Satb1 is the primary Satb-family protein expressed in the early postnatal cerebral cortex, peaking at 1 week after birth. Therefore, for the remainder of this study, we focused on the function of Satb1 in the postnatal cortex.
Satb1 ablation does not alter cortical layer morphology.
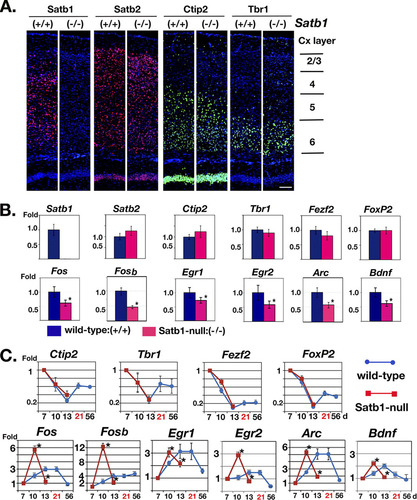
In the embryonic cerebral plate, it has been reported that Satb2 directly regulates Ctip2 and that Ctip2-positive neurons are significantly expanded in layer 5/6 of Satb2-null mice at E18.5, leading to thinning of the cerebral wall in Satb2-null mice compared to wild-type mice (Citation2). Although Satb2-null mice die at P0 whereas Satb1-null mice survive until 2.5 to 3 postnatal weeks, both proteins are expressed in the brain early during development, E11.5 to E13.5. Therefore, we first asked whether Satb1 has any role similar to that of Satb2 in regulating cortical layer identity and architecture. We examined the cortical layers using layer-specific markers (Citation6). Mouse cortical sections prepared from Satb1-null and wild-type littermates were immunostained with antibodies for Satb1 and its homolog Satb2, as well as the layer-specific markers Tbr1 for layer 6 and Ctip2 for layer 5/6, as shown in A. At 2 postnatal weeks, we found no difference between Satb1-null and wild-type littermate in the thickness of the cerebral cortex (Cx) or in layer development. In wild-type Cx (A: Satb1, +/+), Satb1 was detected mainly in layer 4/5 and weakly in layers 2/3 and 6 (A, Satb1, in red), while Satb2 was detected in layers 2 through 6 relatively uniformly (A, Satb2, in red). In Satb1-null Cx (A, Satb1, −/−), the loss of Satb1 expression did not change the expression profiles or thicknesses of Satb2-, Tbr1-, or Ctip2-positive layers. Unlike the case with Satb2, which regulates cortical layer-specific development in the embryo (Citation2), our data show that Satb1 is dispensable for such regulation in the brain. We further tested cortical layer marker gene expression in Satb1-null mouse cortex compared with that in wild-type mice (B, top row). This study included Ctip2, Tbr1, Satb1, and Satb2, as well as Fezf2, which is a gene regulator for Ctip2 (Citation52), and Foxp2 (layer 6 marker) by qPCR. Consistent with the immunostaining results (A), no difference was detected at the transcript level for layer-specific markers (Tbr1, Ctip2, Fezf2, and FoxP2) and Satb2 between wild-type and Satb1-null cortex.
Fig 2 Satb1 depletion results in no alteration in gross morphological development but significant alteration of IEG expression in the cerebral cortex. (A) Mouse coronal sections prepared from Satb1-null and wild-type littermates were immunostained with antibodies for Satb1 and its homolog Satb2 (in red), as well as Tbr1 for layer 6 and Ctip2 for layer 5/6 (in green). There is no difference in layer-specific markers and cortical thickness between wild-type and Satb1-null mice. Scale bar, 100 μm. (B) Relative levels of transcripts of Satb1, Satb2, Ctip2, Tbr1, Fezf2 (gene regulator for Ctip2), and Foxp2 (layer 6 marker) (top row), as well as IEGs (Fos, Fosb, Egr1, Egr2, Arc, and Bdnf) (bottom row), in the cerebral cortex of wild-type and Satb1-null mice (13 days old) were analyzed by qPCR. Layer-specific modulator genes were not altered in Satb1-null mice (red bar) compared with those in wild-type mice (blue bar). However, all IEGs tested were significantly altered in Satb1-null mice. Values represent mean values ± SE; ∗, P ≤ 0.05 (for the wild type, n = 4; for Satb1 null, n = 4). (C) The temporal and relative levels of gene expression during postnatal cortical development for layer-specific modulators (Ctip2, Tbr1, Fezf2, and FoxP2) and IEGs (Fos, Fosb, Egr1, Egr2, Arc, and Bdnf) were analyzed in wild-type mice (between 7 days and 56 days; blue line with circles) and Satb1-null mice (between 7 days and 13 days; red line with squares). Levels of gene expression of layer-specific modulators showed no difference between wild-type mice and Satb1-null mice (top row). On the other hand, Satb1-null mice showed significant alteration in temporal and expression levels of IEGs (bottom row). Day 21, shown in red, is the maximum time of Satb1-null mouse survival. ∗, P < 0.01 (n = 3 or 4 at each time point).
Satb1 is required for proper temporal expression of IEGs during postnatal development.
Given the peak of Satb1 expression in the early postnatal brain, we hypothesized that Satb1 may play a role in regulating changes in gene expression associated with early postnatal brain development. In mammals, the cerebral cortex is not fully developed at birth, and its adult configuration is acquired during early postnatal life in response to external stimuli (Citation40). It has been previously shown that Satb1 regulates inducible genes, such as cytokine genes upon T cell activation and the c-Myc gene in mitogen-stimulated thymocytes (Citation13, Citation14, Citation94). Therefore, we explored whether, in the brain, Satb1 contributes to regulating expression of IEGs, which have been implicated in modulating genomic responses in neurons that facilitate a variety of cellular processes, including growth, differentiation, and learning and memory (Citation44). IEGs have been categorized into two groups: (i) regulatory transcription factors (RTFs) (e.g., Fos, Jun, and Egr), which control transcription of hundreds of downstream genes, and (ii) effector IEGs (e.g., Arc and Bdnf), which directly modify neural morphogenesis and plasticity (Citation4, Citation53, Citation63, Citation88). We first analyzed Fos gene expression, which is activated during neuronal activity and plasticity (Citation42). The Fos gene was significantly downregulated in Satb1-null brain compared with results for wild-type brain at 2 weeks of age (B, bottom row). We confirmed this by double immunostaining of the cortical region (layer 4) for Satb1 and Fos. In wild-type brain, most Fos-positive cells coexpressed Satb1, but Fos-positive cell numbers were decreased in the Satb1-null brain, (see Fig. S2 in the supplemental material). We found a similar reduction in the basal expression levels, by ∼2-fold, of several other IEGs (Fosb, Egr1, Egr2, Arc, and Bdnf) (B, bottom row).
To further examine the effect of Satb1 loss on IEG expression in the early postnatal brain, we investigated the expression levels of six IEGs (Fos, Fosb, Egr1, Egr2, Arc, and Bdnf) at multiple time points during early postnatal cortical development in wild-type and Satb1-null cortex. As a comparison, we also examined gene expression patterns for regulators of cortical layer development (Ctip2, Tbr1, Fezf2, and FoxP2). Due to the relatively early lethality of Satb1-null mice, around P16 to P21, we were able to monitor gene expression only up to 13 days, when all mice typically appeared healthy, although we collected data for wild-type mice up to 56 days. As predicted by the normal cortical layer development in Satb1-null mice, expression of Ctip2, Tbr1, Fezf2, and FoxP2 was similar to that in age-matched wild-type siblings, indicating these genes are not strictly Satb1 dependent (C, top row). Surprisingly, all six IEGs in Satb1-null cortex showed marked alteration in not only the levels but also the timing of their expression; in Satb1-null cortex, their expression peaked at 10 days, 3 days earlier than in wild-type mice, and abruptly declined on day 13 (C, bottom row). Data for the P10 time point came from 4 independent mice from three different litters. This is in sharp contrast to expression of these IEGs in wild-type cortex, where their maximum levels were reached later and were sustained longer, typically 13 to 21 days, declining at 56 days (except for Fosb, which still maintained high levels, and Bdnf, which declined earlier, at 21 days). This difference in the temporal expression pattern of IEGs culminated in the ∼2-fold-reduced expression in Satb1-null cortex compared to wild-type cortex on P13, consistent with our results shown in B. Interestingly, Egr2, Fos, and Fosb gene expression in Satb1 null mice was 3- to 6-fold above wild-type levels at P10. These data indicate that Satb1 is required for proper temporal induction and for the maximal expression levels of IEGs during the critical period of postnatal brain development.
Satb1 is required for other neuronal gene expression.
In addition to the six IEGs described above, we searched for neuronal genes whose basal level of expression is dependent on Satb1. We studied SRE-, CRE-, and CaRE-containing genes, similar to the above six IEGs, by using commercially available qPCR arrays (SA Biosciences). We compared RNA collected from the cerebral cortex of P13-P14 Satb1-null mice and their wild-type littermates. The array results confirmed our studies of RTF IEGs (Egr1, Egr2, Fos, and Fosb), and effector IEGs (Arc and Bdnf) (B), as well as identifying new genes that were downregulated in Satb1-null mice: the neurotransmitter-related genes encoding somatostatin (Sst) and tyrosine hydroxylase (Th), the growth factor-related gene for amphiregulin (Areg), the gene for corticotropin-releasing hormone (Crh), and a Ca2+-responsive gene, for calbindin 2 (Calb2) (also known as calretinin), as listed in . Four genes were identified as being significantly upregulated in the Satb1-null cortex. These Satb1-repressed genes encode two calcium-binding proteins (S100a8 and S100a9), a cytokine (Il6), and tumor necrosis factor (Tnf) (). S100a8 and Il6 function in inflammation and fever in the brain. Tnf shows divergent roles for neuronal death and survival. Increased expression of inflammation-related genes might cause neuronal death (Citation15). However, we confirmed by terminal deoxynucleotidyltrans-ferase-mediated dUTP-biotin nick-end labeling (TUNEL) assay in P13-P14 brain that cell death was similar between Satb1-null and wild type brain (data not shown). The remaining 67 genes of the microarray had similar expression levels in both wild-type and Satb1-null mouse samples (see Table S1 in the supplemental material for a summary of data for 83 genes plus Gapdh as an additional control). These data indicate that in addition to IEGs, basal-level expression of several other SRE/CRE/CaRE-containing genes is affected by Satb1 expression in the 2-week-old cerebral cortex.
Table 1 Altered levels of gene expression in cyclic AMP-, serum-, or Ca2+-dependent genes other than IEGs in Satb1-null mouse brain relative to that in wild-type miceTable Footnotea
Satb1 affects inducibility of IEGs and other neural genes in cortical explant cultures.
Next, to examine Satb1's potential to affect the inducibility of other key neuronal genes upon stimulation, we employed an in vitro culture system. Because Satb1-null mice die before weaning, they are unfortunately not suitable for examining activity-dependent gene expression in vivo. We prepared cortical organotypic cultures from wild-type and Satb1-null brain and stimulated them with forskolin (FK) to study the impact of Satb1 on stimulation-dependent induction of the SRE/CRE/CaRE-containing genes. It is important to note that our in vitro culture assay system took a subset of the brain tissue out of the context of the whole brain, and as such, the cells for which we measured stimulation-dependent responses may lack the regulatory contributions of inhibitory neurons and/or synaptic input from other parts of the brain. Therefore, we used the in vitro culture assay merely to test Satb1's potential to affect the inducibility of multiple key neuronal genes in response to stimulation, rather than as an assay to measure stimulation-induced gene expression levels. FK activates adenylate cyclase in the cell, which results in elevated levels of cAMP, leading to synaptic potentiation through activation of cAMP-dependent gene expression (Citation62). The organotypic cortical explant cultures from 6- to ∼7-day-old Satb1-null and wild-type littermates were maintained for 10 days (to minimize the effects of dissection and culture stress on the cells' gene expression patterns) then FK (25 μM) was added to the cultures, and total RNA was harvested. Using the same qPCR-based array described above, we determined the expression levels of SRE/CRE/CaRE- containing genes (including Arc and Bdnf, which were individually added to the study to make a total of 84 genes) at early (1 h) and later time points (2 h and 4 h) after stimulation. Each expression level was normalized to the average for three housekeeping genes (Gusb, Hsp90ab1, and Hprt). Data shown in represent the averages for at least 4 independent wild-type and 4 Satb1-null brain cultures. Of the 84 genes analyzed, 80 were expressed at detectable levels (see Table S2 in the supplemental material). Among those, some genes, such as Egr1, Fos, and Bdnf, did not show any difference in fold induction between wild-type and Satb1-null brain. However, we found a total of 13 genes (Egr2, Fosb, Arc, Sst, Calb2, Il6, Atf3, Calr, Tacr1, Thbs, Penk1, Pmaip1, and Calb1) that exhibited a significantly altered induction pattern in response to FK stimulation in Satb1-null compared to wild-type cortical explant cultures (A and B; see also Table S2). Our in vitro assay revealed the important contribution of Satb1 to the inducibility of these genes by FK stimulation and identified 7 new genes whose regulation by Satb1 had gone undetected by our in vivo analysis (e.g., Thbs1, Atf3, Penk1, Tacr1, Calb1, Calr, and Pmaip1, as shown in Table S2).
Fig 3 Satb1 is required for multiple neuronal genes in response to forskolin stimulation in vitro. Organotypic cortical explant cultures prepared from Satb1-null or wild-type brains were treated with 25 μM forskolin (FK) for 1 h, 2 h, and 4 h or from 0.1% DMSO-treated samples as a control (0 h). qPCR was used to determine the expression levels of SRE/CRE/CaRE- containing genes in cultures. Fold induction of gene expression at different time points relative to induction at 0 h was calculated. Representative genes with significantly different fold inductions in Satb1-null brain samples (red) compared to wild-type brain samples (blue) are presented (IEGs [A] or non-IEGs [B]). The data for Penk1, Thbs1, Pmaip1, and Calb1 are not shown. However, the responses of Penk1 and Thbs1 to FK are similar to that of Sst. Pmaip1 is similar to Arc. Calb1 is similar to Calb2. Each data point represents the mean value ± SE for four experimental replicates. ∗, P ≤ 0.05.
![Fig 3 Satb1 is required for multiple neuronal genes in response to forskolin stimulation in vitro. Organotypic cortical explant cultures prepared from Satb1-null or wild-type brains were treated with 25 μM forskolin (FK) for 1 h, 2 h, and 4 h or from 0.1% DMSO-treated samples as a control (0 h). qPCR was used to determine the expression levels of SRE/CRE/CaRE- containing genes in cultures. Fold induction of gene expression at different time points relative to induction at 0 h was calculated. Representative genes with significantly different fold inductions in Satb1-null brain samples (red) compared to wild-type brain samples (blue) are presented (IEGs [A] or non-IEGs [B]). The data for Penk1, Thbs1, Pmaip1, and Calb1 are not shown. However, the responses of Penk1 and Thbs1 to FK are similar to that of Sst. Pmaip1 is similar to Arc. Calb1 is similar to Calb2. Each data point represents the mean value ± SE for four experimental replicates. ∗, P ≤ 0.05.](/cms/asset/1861b46a-e236-4094-a26c-9b20a43069f9/tmcb_a_12273696_f0003_oc.jpg)
In addition to FK stimulation, we tested the effects of kainic acid (KA) (50 μM) stimulation on 6 IEGs (Fos, FosB, Egr1, Egr2, Arc, and Bdnf). KA is a glutamate agonist that binds specifically to the kainate receptor class of ionotropic glutamate receptors, which play important roles in synaptic plasticity (Citation37, Citation48). We found that 4 genes (Egr1, Egr2, Fosb, and Arc) were induced at higher rates in Satb1-null cortical culture, while Fos and Bdnf expression were similar to that in wild-type controls (see Fig. S3). The results of KA stimulation were mostly consistent with those described for FK. Of particular note, the in vitro stimulation system likely does not faithfully recreate an in vivo activity-dependent neuronal response, maybe due to lacking the full connectivity of the in vivo circuit.
Taken together, our in vivo and in vitro data indicate that Satb1 is required to regulate the proper levels and timing of basal and activity-dependent expression of multiple neuronal genes that play important roles in neuronal function. These genes include IEGs (Fos, Fosb, Egr1, Egr2, Arc, and Bdnf), genes involved in synaptogenesis (Sst, Areg, and Thbs1) and stress, the fear/anxiety response or hyperactive behavior (Th, Crh, Atf3, Penk1, and Tacr1), and the Ca2+ binding and damage/inflammation response (Calb1, Calb2 [Calretinin], Calr, Pmaip [also known as NoxA], S100a8, S100a9, Tnf, and Il6).
Satb1 binds genomic loci of target IEGs and other key neural genes.
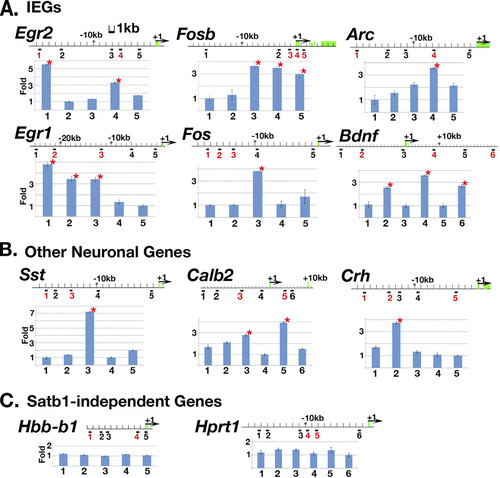
We next set out to determine whether Satb1 binds to its neuronal target loci. We employed urea-chromatin immunoprecipitation (urea-ChIP), followed by quantitative PCR (qPCR) (see Materials and Methods). Chromatin fragments were prepared from P13-P14 wild-type cortex, followed by immunoprecipitation using rabbit polyclonal anti-Satb1 antibody 1583 (or Abcam anti-Satb1 antibody). The chromatin recovered from this step was then subjected to qPCR using primers designed to examine DNA fragments containing potential Satb1-binding sequences (the ATC sequence context; see Materials and Methods for details), as well as nearby control DNA sequences not expected to bind Satb1. All primers were designed to examine DNA fragments within an ∼20-kb region upstream from the transcription start site of each gene locus analyzed. We first analyzed whether Satb1 binds gene loci of 4 IEG transcription factors (Egr1, Egr2, Fosb, and Fos) and 2 effector IEGs (Arc and Bdnf) which showed altered expression in Satb1-null samples in vivo (B). We found that Satb1 binds to all six IEGs at single or multiple sites containing the ATC sequence context within the region tested (A). We also detected Satb1 bound to the non-IEG SRE/CRE/CaRE-containing genes Sst, Crh, and Calb2 (B), which also exhibited altered expression in Satb1-null brains (). On the other hand, multiple ATC sequence stretches identified within the Hprt1, Hbb-b1, and Gapdh genes were not bound by Satb1 (C; also Gapdh data not shown), indicating the specificity of Satb1 binding to IEGs and other SRE/CRE/CaRE-containing genes. These data from urea-ChIP-qPCR and transcription analyses strongly suggest that Satb1 is required for proper stimulation-induced expression of multiple SRE/CRE/CaRE-containing genes in vivo.
Fig 4 Satb1 binds IEGs and other neuronal genes in vivo. Urea-chromatin immunoprecipitation (Urea-ChIP) was carried out with either anti-Satb1 antibody or preimmune serum. qPCR was used to determine relative fold enrichment of 5 or 6 different genomic sites in anti-Satb1 ChIP samples for each gene (an indication of Satb1 binding). Potential Satb1-binding loci (containing ATC sequences) are marked by numbers in red under the genomic sequence, and potential non-Satb1-binding loci are marked by numbers in black as controls. Red stars label significant fold enrichment relative to that for the internal control site determined by this assay, indicating Satb1 was bound to these sites. Exons for each genomic sequence are marked by green boxes, and translation initiation sites are marked by black arrows. As expected for Satb1-independent genes in the brain, all potential Satb1 binding sites for such genes (C) (Hbb-b1 and Hprt1) were not bound by Satb1, indicating that the gene is either not expressed (Hbb-b1) or not Satb1 dependent (Hprt1) in the cerebral cortex.
Satb1 is expressed in both excitatory and inhibitory neurons in the cerebral cortex.
By immunostaining brain sections and focusing on layers 4 and 5, where Satb1-expressing neurons are most abundant (51% of DAPI+ cells were Satb1+), we found that Satb1 is expressed by both inhibitory (Gad67+ [Citation18]) and excitatory (vGlut2+ [Citation39]) cells (A to C). We found that 15% of the Satb1+ cells also expressed Gad67, whereas all Gad67+ cells (9% of the DAPI+ cells) expressed Satb1 (A and B). Sixty percent of the Satb1+ population coexpressed vGlut2 (C), whereas 40% of the vGlut2+ cell population (45% of all DAPI+ cells) expressed Satb1.
Fig 5 Dendritic spine density in cortical pyramidal neurons is reduced in Satb1-null mice. To determine whether Satb1-expressing neurons are excitatory or inhibitory cells in the cerebral cortex, Gad67 (A and B) for inhibitory and vGlut2 (C) for excitatory markers were used for double immunostaining. In layers 4/5 in the cortex, Gad67-positive cells (9% of DAPI+ cells) were almost all Satb1-positive cells (A and B), and 60% of Satb1-positive cells (51% of DAPI+ cells) were also vGlut2 positive (C). Scale bar, 225 μm (A), 50 μm (B), or 150 μm (C). (D) Representative images of Golgi-Cox-stained morphology in the cerebral cortex (Cx) in wild-type and Satb1-null mice. Dendrite complexity is not significantly altered between wild-type and Satb1-null neurons (Sholl analysis; data not shown). Scale bar, 1,000, 500, or 50 μm (left to right, respectively). (E) Representative images of Golgi-stained dendrites from cerebral cortex-pyramidal cells (Cx-Py, M1 region) in wild-type and Satb1-null mice. A clear reduction in spine number is observed in Satb1-null mice. Scale bar, 10 μm. (F) Dendritic spine density in two distinct cortical regions (M1 [a] and AuV [b]) is reduced ∼50% in Satb1-null mice but not in the hippocampus (Hip-Py). The hippocampal pyramidal cells have undetectable level of Satb1 expression in wild-type mice and show no difference in dendritic spine density between wild-type and Satb1-null mice. n = 4 mice × 4 cells for each region (total, 16 neurons/site). ∗, P ≤ 0.01.
![Fig 5 Dendritic spine density in cortical pyramidal neurons is reduced in Satb1-null mice. To determine whether Satb1-expressing neurons are excitatory or inhibitory cells in the cerebral cortex, Gad67 (A and B) for inhibitory and vGlut2 (C) for excitatory markers were used for double immunostaining. In layers 4/5 in the cortex, Gad67-positive cells (9% of DAPI+ cells) were almost all Satb1-positive cells (A and B), and 60% of Satb1-positive cells (51% of DAPI+ cells) were also vGlut2 positive (C). Scale bar, 225 μm (A), 50 μm (B), or 150 μm (C). (D) Representative images of Golgi-Cox-stained morphology in the cerebral cortex (Cx) in wild-type and Satb1-null mice. Dendrite complexity is not significantly altered between wild-type and Satb1-null neurons (Sholl analysis; data not shown). Scale bar, 1,000, 500, or 50 μm (left to right, respectively). (E) Representative images of Golgi-stained dendrites from cerebral cortex-pyramidal cells (Cx-Py, M1 region) in wild-type and Satb1-null mice. A clear reduction in spine number is observed in Satb1-null mice. Scale bar, 10 μm. (F) Dendritic spine density in two distinct cortical regions (M1 [a] and AuV [b]) is reduced ∼50% in Satb1-null mice but not in the hippocampus (Hip-Py). The hippocampal pyramidal cells have undetectable level of Satb1 expression in wild-type mice and show no difference in dendritic spine density between wild-type and Satb1-null mice. n = 4 mice × 4 cells for each region (total, 16 neurons/site). ∗, P ≤ 0.01.](/cms/asset/eacb906d-5e07-4ea4-a33b-1f61164e379f/tmcb_a_12273696_f0005_oc.jpg)
Dendritic spine density is significantly reduced by Satb1 depletion in the brain.
Given the important roles of IEGs in synapse formation, taken together with our finding that Satb1 binds loci of IEGs and other important neuronal factor genes which are aberrantly altered by the loss of Satb1, we hypothesized that Satb1 might play a role in neuronal structures, especially synapse formation. Dendritic spines are postsynaptic structures where most synaptic communication between neurons occurs and can rapidly change in shape, volume, and number in response to incoming stimuli (Citation67, Citation96). As such, changes in dendritic spine formation can be indicators of synaptic plasticity. By the Golgi-Cox staining technique, we analyzed morphology of excitatory pyramidal neurons in the cerebral cortex.
The brains from four male Satb1-null and four male wild-type control mice at P13-P14 were processed for Golgi-Cox staining using standard procedures (FD Neurosciences). From each mouse brain, dendrite length, branching pattern, and spine shape and density were measured in 4 neurons each from the M1 (primary motor cortex) and AuV (secondary auditory cortex) regions of the cerebral cortex (a total of 16 neurons/region/mouse group). All cells analyzed were identified morphologically under low magnification as pyramidal neurons (representative images are shown in D), and multiple basal dendrites, excluding apical dendrites, were analyzed within a uniform distance from their soma. Results were compared statistically between the Satb1-null and wild-type brain groups. Dendritic branch complexity of cortex neurons was not significantly altered between the two groups of mice by Sholl analysis (data not shown, but a representative morphology is shown in D, middle and right columns). Also, the shapes of dendritic spines were not significantly altered in the Satb1-null cortex (E, representative morphology in M1 region). However, the dendritic spine density of the Satb1-null mouse brain was significantly reduced, by roughly 50%, from that of wild-type mice at two different regions in cerebral cortex pyramidal cells (F, 1-M1 region and 2-AuV region, Cx-Py). In contrast, the spine density of hippocampal neurons showed no difference between the Satb1-null and wild-type mice (F, Hip-Py). Because we showed that the level of Satb1 in the hippocampus CA1 of wild-type mice is virtually undetectable (A) and its expression is restricted to the dentate hilar cells (see Fig. S1A in the supplemental material), these data indicate that Satb1 expression has a major impact on the spine density in neurons in a brain region-specific manner. The above results strongly suggest that Satb1 plays an important role in regulating synapse formation in the cerebral cortex during postnatal development.
DISCUSSION
We show that the nuclear architectural protein Satb1 is expressed in terminally differentiated neurons in the postnatal brain, mainly at the cerebral cortex and amygdala, and binds in vivo to genomic loci of IEGs and several other SRE/CRE/CaRE-containing genes examined (summarized in ). Induction of IEGs is highly correlated with brain plasticity (Citation4, Citation63), and they are expressed prominently in the cerebral cortex, where synaptic formation and remodeling are guided by extracellular influences in early postnatal life during specific windows of time, known as critical periods (Citation4, Citation57, Citation78). We found that Satb1 is essential for the proper temporal expression and levels of RTF-IEGs (Fos, Fosb, Egr1, and Egr2) and effector IEGs (Arc and Bdnf) during postnatal cortical development.
Table 2 Satb1-dependent genes selected from 82 SRE/CRE/CaRE genes tested
Similar to findings of a study in rats (Citation41), we found that expression of multiple IEGs in wild-type mouse cortex significantly increases in the second week and is sustained at higher basal levels through the third postnatal week, declining in expression thereafter (C). Satb1 expression peaks at 1 week postnatally, before IEG expression is elevated (F). Upon Satb1 ablation, IEG expression peaks almost synchronously for all tested IEGs at an abnormally earlier stage at P10 in the cortex and rapidly decreases by P13, to roughly half the levels for wild-type cortex. Together, these data show that IEG expression in the early postnatal mammalian brain is dynamic, showing rapid changes in expression within the first few postnatal weeks, and that loss of Satb1 results in changes in the dynamics of IEG induction. Consistent with this in vivo alteration, in vitro, where cellular responses to external stimulation can be monitored in a controlled cortical organotypic culture system, the stimulation-dependent induction of IEG expression is altered in Satb1-null brain cultures. Curiously, some IEGs with reduced basal levels in 2-week old Satb1-null brain exhibited increased induction upon stimulation in vitro compared to wild-type control results. The in vitro explant culture likely does not reproduce the full connectivity of the in vivo circuit and therefore might not recreate the in vivo dynamics. Nevertheless, the results from the in vitro experiment show that the inducibility of IEGs is not regulated properly in the absence of Satb1, and this is consistent with the altered temporal dynamics of IEG induction in the early time point for Satb1-null postnatal brain. We demonstrated that Satb1 binds in vivo to multiple specialized ATC sequences specifically recognized by Satb1 within the genomic loci of each of the IEGs we examined. Satb1 has an important function in assembling transcription factors and chromatin remodeling factors on its target gene loci once Satb1 binds to the loci through specialized ATC sequences (Citation13, Citation14, Citation94). In the absence of Satb1, specific regulators responsible for regulating IEGs might not be properly assembled on their IEG loci at the correct time during development or in response to simulation, leading to overexpression or insufficient activation. Such activity of Satb1 could underlie the dysregulation of temporal expression and inducibility of IEG in vivo observed after Satb1 ablation. We interpret the results of Satb1 effects on IEG expression to mean that Satb1 is not required for IEG expression per se but plays a critical role in modulating the temporal dynamics as well as overall levels of IEG induction, affecting the downstream genes of IEG-dependent neuronal factors.
In contrast to findings for the IEGs, we found no changes in expression for layer-specific regulators (Ctip2, Tbr1, Fezf2, and FoxP2) in Satb1-null brains during this period. Without alteration of expression of those layer-specific regulators, cortical layer morphology was largely normal in the Satb1-null brain, in stark contrast to the Satb2-null brain. Therefore, Satb2 is essential for specification of cortical layers during embryonic development, whereas Satb1 is dispensable for this. On the other hand, Satb1 ablation alters cortical dendritic spine density in the postnatal brain, suggesting a critical role for Satb1 in synaptic plasticity. However, given the low level of expression of Satb2 in the early postnatal brain, our results do not rule out the potentially redundant role for Satb2 in participation in IEG expression and dendritic spine formation. A rigorous study comparing the roles of Satb1 and Satb2 in the postnatal brain awaits the generation and comparison of Satb2 single and Satb1/Satb2 double-conditional knockout mice.
Dendritic spines are postsynaptic sites of most excitatory synapses and play critical roles in synaptic transmission and plasticity (Citation67). Alteration of dendritic spines and synaptic connections in the cortex in an activity-dependent manner has been documented (Citation86). In the absence of Satb1, dendritic spine density in cortical excitatory pyramidal cells in 2-week-old Satb1-null mice is significantly reduced compared to that in wild-type mice. However, the density remained unaltered in the hippocampus pyramidal cells, where Satb1 expression is undetectable in the same wild-type mice. This high correlation of Satb1 expression and dendritic spine density in pyramidal cells strongly suggests that Satb1 plays a role in synapse formation in the cerebral cortex during early mouse postnatal life. In the cortex, we showed that both excitatory and inhibitory neurons express Satb1. Therefore, the decrease in spine density in cortical excitatory pyramidal cells we observed could be due to cell-autonomous effects of Satb1 and/or due to non-cell-autonomous effects of Satb1 in inhibitory cortical interneurons. Interestingly, it was recently reported that the majority of spines formed early during development, together with a small fraction of new spines induced by novel experience, are preserved and provide a structural basis for memory retention throughout the animal's entire life (Citation90, Citation92, Citation93). Therefore, a significant reduction in spines formed in the early postnatal stage of Satb1-null mice may lead to defects in learning and memory and may thus affect lifelong behavior.
It has been reported that individual IEG knockout mice (e.g., Arc and Homer-1a) exhibit no effects on dendritic spine density (Citation73, Citation87). A recent analysis on the effect of Arc ablation revealed changes in spine morphology in a specific hippocampal region (Citation72). On the other hand, major alterations in dendritic spine morphology are found in human patients with neurodegenerative diseases (e.g., fragile X syndrome, Huntington's disease, and Alzheimer's disease) and in corresponding mouse models in which multiple transcription factors are dysregulated (Citation5, Citation32, Citation43, Citation69). The altered timing and expression levels of IEGs in the Satb1-null cortex during the early phase of postnatal cerebral cortex development may be one molecular mechanism that could contribute to reduced dendritic spine density. Future experiments will reveal whether the dendritic spine phenotype observed in the Satb1-null cortex is a direct result of Satb1 regulation of specific IEGs and, if so, which Satb1 target IEGs are required for this process.
We demonstrated that many important neuronal genes, including IEGs and those involved in synaptogenesis, stress, the fear/anxiety response, or hyperactive behavior, depend on Satb1 for their expression in cortical neurons, as summarized in . Although many genes are activated in neurons in response to environmental stimulations, it remains unknown how such activity-dependent gene expression is coordinated, leading to changes in behaviors (Citation28). Epigenetic mechanisms might be involved in those processes (Citation8, Citation30, Citation47, Citation58). To date, Satb1 has been found in a number of progenitor cells, including thymocytes, osteoblasts, the basal layer of the epidermis, amyloblasts, and embryonic stem cells (Citation3, Citation26, Citation81) but not in mature, differentiated cells, except for T cells upon activation (Citation14). Upon activation of T cells in response to stimulation, Satb1 is induced, bringing distal cytokine genes together by chromatin looping, assembling these cytokine genes with chromatin remodeling/transcription factors to coordinately activate their expression (Citation14). In breast cancer, SATB1 plays a determinant role in metastasis, where it regulates expression of ∼1,000 genes and establishes metastasis-promoting gene expression profiles, driving cancer cells to acquire metastatic phenotypes (Citation33). Similarly, neurons rapidly regulate a multitude of genes upon stimulation, which can necessitate the function of a global gene regulator like Satb1 to coordinate this process. Although it would be technically challenging given the diversity of neuronal subtypes and the difficulty of purifying them for biochemical experiments, it will be important in the future to determine how Satb1 regulates IEG loci in the postnatal brain by determining whether the effects are mediated through formation of higher-order chromatin structures in neurons and identifying some key regulatory factors that are recruited, as we have previously shown for T cells (Citation14). Large-scale expression studies, including genome-wide transcriptome studies, are under way to better understand the effects of Satb1 on expression of many other genes in the postnatal brain. Together, these experiments will help identify other Satb1 neuronal targets and determine the mechanisms of Satb1 gene expression in the early postnatal mammalian brain.
The emerging picture of Satb1 function in the brain is that it plays an important role in facilitating the coordinate temporal induction of IEGs as well as formation or maintenance of dendritic spines, both of which are likely to have important consequences in brain function. Consistently, conditional Satb1 deficiency in the adult brain results in dramatic behavioral abnormalities (data not shown).
tmcb_a_12273696_sm0001.doc
Download MS Word (12 MB)tmcb_a_12273696_sm0002.zip
Download Zip (84.5 KB)tmcb_a_12273696_sm0003.zip
Download Zip (76.3 KB)ACKNOWLEDGMENTS
This work was supported by NIH-RO1 (CA39681 and GM63026; to T.K.-S.) and NIH-RO1 (NS41128; to Y.K.) and by the Director, Office of Science, Office of Basic Energy Sciences of the U.S. Department of Energy under contract no. DE-AC02-05CH11231.
We especially appreciate the critical review and constructive suggestions for the manuscript provided by Rui Galvao and Minoree Kohwi. We thank Shutao Cai for his help in brain ChIP analysis. We are also grateful to S. A. Regmi, E. Peiffer, undergraduate students from UC Berkeley (B. Dang, U. Awan, J. Yoon, K. Kothandapani, M. Jen, D. Eum, and M. Lobo), and M. Miyano for technical assistance and mouse care. We thank Kevin Peet for editorial assistance.
SUPPLEMENTAL MATERIAL
Supplemental material for this article may be found at http://dx.doi.org/10.1128/MCB.05917-11.
REFERENCES
- Airaksinen MS, et al. 1997. Ataxia and altered dendritic calcium signaling in mice carrying a targeted null mutation of the calbindin D28k gene. Proc. Natl. Acad. Sci. U. S. A. 94: 1488–1493.
- Alcamo EA, et al. 2008. Satb2 regulates callosal projection neuron identity in the developing cerebral cortex. Neuron 57: 364–377.
- Alvarez JD, et al. 2000. The MAR-binding protein SATB1 orchestrates temporal and spatial expression of multiple genes during T-cell development. Genes Dev. 14: 521–535.
- Andreasson KI, Kaufmann WE. 2002. Role of immediate early gene expression in cortical morphogenesis and plasticity. Results Probl. Cell Differ. 39: 113–137.
- Beckel-Mitchener A, Greenough WT. 2004. Correlates across the structural, functional, and molecular phenotypes of fragile X syndrome. Ment. Retard. Dev. Disabil. Res. Rev. 10: 53–59.
- Bedogni F, et al. 2010. Tbr1 regulates regional and laminar identity of postmitotic neurons in developing neocortex. Proc. Natl. Acad. Sci. U. S. A. 107: 13129–13134.
- Bode J, et al. 1992. Biological significance of unwinding capability of nuclear matrix-associating DNAs. Science 255: 195–197.
- Borrelli E, Nestler EJ, Allis CD, Sassone-Corsi P. 2008. Decoding the epigenetic language of neuronal plasticity. Neuron 60: 961–974.
- Bozon B, et al. 2003. MAPK, CREB and zif268 are all required for the consolidation of recognition memory. Philos. Trans. R. Soc. Lond. B Biol. Sci. 358: 805–814.
- Bramham CR, Worley PF, Moore MJ, Guzowski JF. 2008. The immediate early gene arc/arg3.1: regulation, mechanisms, and function. J. Neurosci. 28: 11760–11767.
- Britanova O, Akopov S, Lukyanov S, Gruss P, Tarabykin V. 2005. Novel transcription factor Satb2 interacts with matrix attachment region DNA elements in a tissue-specific manner and demonstrates cell-type-dependent expression in the developing mouse CNS. Eur. J. Neurosci. 21: 658–668.
- Britanova O, et al. 2008. Satb2 is a postmitotic determinant for upper-layer neuron specification in the neocortex. Neuron 57: 378–392.
- Cai S, Han HJ, Kohwi-Shigematsu T. 2003. Tissue-specific nuclear architecture and gene expression regulated by SATB1. Nat. Genet. 34: 42–51.
- Cai S, Lee CC, Kohwi-Shigematsu T. 2006. SATB1 packages densely looped, transcriptionally active chromatin for coordinated expression of cytokine genes. Nat. Genet. 38: 1278–1288.
- Campbell A. 2004. Inflammation, neurodegenerative diseases, and environmental exposures. Ann. N. Y. Acad. Sci. 1035: 117–132.
- Chai Z, Gatti S, Toniatti C, Poli V, Bartfai T. 1996. Interleukin (IL)-6 gene expression in the central nervous system is necessary for fever response to lipopolysaccharide or IL-1 beta: a study on IL-6-deficient mice. J. Exp. Med. 183: 311–316.
- Chan JP, Unger TJ, Byrnes J, Rios M. 2006. Examination of behavioral deficits triggered by targeting Bdnf in fetal or postnatal brains of mice. Neuroscience 142: 49–58.
- Chattopadhyaya B, et al. 2007. GAD67-mediated GABA synthesis and signaling regulate inhibitory synaptic innervation in the visual cortex. Neuron 54: 889–903.
- Cockerill PN, Yuen MH, Garrard WT. 1987. The enhancer of the immunoglobulin heavy chain locus is flanked by presumptive chromosomal loop anchorage elements. J. Biol. Chem. 262: 5394–5397.
- Cohen S, Greenberg ME. 2008. Communication between the synapse and the nucleus in neuronal development, plasticity, and disease. Annu. Rev. Cell Dev. Biol. 24: 183–209.
- Crawford SE, et al. 1998. Thrombospondin-1 is a major activator of TGF-beta1 in vivo. Cell 93: 1159–1170.
- de Belle I, Cai S, Kohwi-Shigematsu T. 1998. The genomic sequences bound to special AT-rich sequence-binding protein 1 (SATB1) in vivo in Jurkat T cells are tightly associated with the nuclear matrix at the bases of the chromatin loops. J. Cell Biol. 141: 335–348.
- Dickinson LA, Joh T, Kohwi Y, Kohwi-Shigematsu T. 1992. A tissue-specific MAR/SAR DNA-binding protein with unusual binding site recognition. Cell 70: 631–645.
- Falk A, Frisen J. 2002. Amphiregulin is a mitogen for adult neural stem cells. J. Neurosci. Res. 69: 757–762.
- Farre-Castany MA, et al. 2007. Differences in locomotor behavior revealed in mice deficient for the calcium-binding proteins parvalbumin, calbindin D-28k or both. Behav. Brain Res. 178: 250–261.
- Fessing MY, et al. 2011. p63 regulates Satb1 to control tissue-specific chromatin remodeling during development of the epidermis. J. Cell Biol. 194: 825–839.
- FitzPatrick DR, et al. 2003. Identification of SATB2 as the cleft palate gene on 2q32-q33. Hum. Mol. Genet. 12: 2491–2501.
- Flavell SW, Greenberg ME. 2008. Signaling mechanisms linking neuronal activity to gene expression and plasticity of the nervous system. Annu. Rev. Neurosci. 31: 563–590.
- Galvao RP, Garcia-Verdugo JM, Alvarez-Buylla A. 2008. Brain-derived neurotrophic factor signaling does not stimulate subventricular zone neurogenesis in adult mice and rats. J. Neurosci. 28: 13368–13383.
- Graff J, Mansuy IM. 2008. Epigenetic codes in cognition and behaviour. Behav. Brain Res. 192: 70–87.
- Green TA, et al. 2008. Induction of activating transcription factors (ATFs) ATF2, ATF3, and ATF4 in the nucleus accumbens and their regulation of emotional behavior. J. Neurosci. 28: 2025–2032.
- Guidetti P, et al. 2001. Early degenerative changes in transgenic mice expressing mutant huntingtin involve dendritic abnormalities but no impairment of mitochondrial energy production. Exp. Neurol. 169: 340–350.
- Han HJ, Russo J, Kohwi Y, Kohwi-Shigematsu T. 2008. SATB1 reprogrammes gene expression to promote breast tumour growth and metastasis. Nature 452: 187–193.
- Hartman MG, et al. 2004. Role for activating transcription factor 3 in stress-induced beta-cell apoptosis. Mol. Cell. Biol. 24: 5721–5732.
- Heizmann CW, Fritz G, Schafer BW. 2002. S100 proteins: structure, functions and pathology. Front. Biosci. 7: d1356–d1368.
- Horike S, Cai S, Miyano M, Cheng JF, Kohwi-Shigematsu T. 2005. Loss of silent-chromatin looping and impaired imprinting of DLX5 in Rett syndrome. Nat. Genet. 37: 31–40.
- Huettner JE. 2003. Kainate receptors and synaptic transmission. Prog. Neurobiol. 70: 387–407.
- Kandel ER. 2001. The molecular biology of memory storage: a dialogue between genes and synapses. Science 294: 1030–1038.
- Kashani A, Betancur C, Giros B, Hirsch E, El Mestikawy S. 2007. Altered expression of vesicular glutamate transporters VGLUT1 and VGLUT2 in Parkinson disease. Neurobiol. Aging 28: 568–578.
- Katz LC, Shatz CJ. 1996. Synaptic activity and the construction of cortical circuits. Science 274: 1133–1138.
- Kaufmann WE, Yamagata K, Andreasson KI, Worley PF. 1994. Rapid response genes as markers of cellular signaling during cortical histogenesis: their potential in understanding mental retardation. Int. J. Dev. Neurosci. 12: 263–271.
- Knapska E, Radwanska K, Werka T, Kaczmarek L. 2007. Functional internal complexity of amygdala: focus on gene activity mapping after behavioral training and drugs of abuse. Physiol. Rev. 87: 1113–1173.
- Knobloch M, Mansuy IM. 2008. Dendritic spine loss and synaptic alterations in Alzheimer's disease. Mol. Neurobiol. 37: 73–82.
- Knoll B, Nordheim A. 2009. Functional versatility of transcription factors in the nervous system: the SRF paradigm. Trends Neurosci. 32: 432–442.
- Kobayashi K, et al. 1995. Targeted disruption of the tyrosine hydroxylase locus results in severe catecholamine depletion and perinatal lethality in mice. J. Biol. Chem. 270: 27235–27243.
- Kohwi-Shigematsu T, Kohwi Y. 1990. Torsional stress stabilizes extended base unpairing in suppressor sites flanking immunoglobulin heavy chain enhancer. Biochemistry 29: 9551–9560.
- Kohyama J, et al. 2008. Epigenetic regulation of neural cell differentiation plasticity in the adult mammalian brain. Proc. Natl. Acad. Sci. U. S. A. 105: 18012–18017.
- Kristensen BW, et al. 1999. Excitotoxic effects of non-NMDA receptor agonists in organotypic corticostriatal slice cultures. Brain Res. 841: 143–159.
- Kuroda KO, Ornthanalai VG, Kato T, Murphy NP. 2010. FosB null mutant mice show enhanced methamphetamine neurotoxicity: potential involvement of FosB in intracellular feedback signaling and astroglial function. Neuropsychopharmacology 35: 641–655.
- Laird JM, et al. 2000. Deficits in visceral pain and hyperalgesia of mice with a disruption of the tachykinin NK1 receptor gene. Neuroscience 98: 345–352.
- Lanahan A, Worley P. 1998. Immediate-early genes and synaptic function. Neurobiol. Learn Mem. 70: 37–43.
- Leone DP, Srinivasan K, Chen B, Alcamo E, McConnell SK. 2008. The determination of projection neuron identity in the developing cerebral cortex. Curr. Opin. Neurobiol. 18: 28–35.
- Li L, Carter J, Gao X, Whitehead J, Tourtellotte WG. 2005. The neuroplasticity-associated arc gene is a direct transcriptional target of early growth response (Egr) transcription factors. Mol. Cell. Biol. 25: 10286–10300.
- Lonze BE, Ginty DD. 2002. Function and regulation of CREB family transcription factors in the nervous system. Neuron 35: 605–623.
- Low MJ, et al. 2001. Somatostatin is required for masculinization of growth hormone-regulated hepatic gene expression but not of somatic growth. J. Clin. Invest. 107: 1571–1580.
- Luetteke NC, et al. 1999. Targeted inactivation of the EGF and amphiregulin genes reveals distinct roles for EGF receptor ligands in mouse mammary gland development. Development 126: 2739–2750.
- Majdan M, Shatz CJ. 2006. Effects of visual experience on activity-dependent gene regulation in cortex. Nat. Neurosci. 9: 650–659.
- Malvaez M, Barrett RM, Wood MA, Sanchis-Segura C. 2009. Epigenetic mechanisms underlying extinction of memory and drug-seeking behavior. Mamm. Genome 20: 612–623.
- Manitz MP, et al. 2003. Loss of S100A9 (MRP14) results in reduced interleukin-8-induced CD11b surface expression, a polarized microfilament system, and diminished responsiveness to chemoattractants in vitro. Mol. Cell. Biol. 23: 1034–1043.
- Marino MW, et al. 1997. Characterization of tumor necrosis factor-deficient mice. Proc. Natl. Acad. Sci. U. S. A. 94: 8093–8098.
- Mataga N, Fujishima S, Condie BG, Hensch TK. 2001. Experience-dependent plasticity of mouse visual cortex in the absence of the neuronal activity-dependent marker egr1/zif268. J. Neurosci. 21: 9724–9732.
- Mayer P, et al. 2002. Gene expression profile after intense second messenger activation in cortical primary neurones. J. Neurochem. 82: 1077–1086.
- Miyashita T, Kubik S, Lewandowski G, Guzowski JF. 2008. Networks of neurons, networks of genes: an integrated view of memory consolidation. Neurobiol. Learn. Mem. 89: 269–284.
- Muglia L, Jacobson L, Dikkes P, Majzoub JA. 1995. Corticotropin-releasing hormone deficiency reveals major fetal but not adult glucocorticoid need. Nature 373: 427–432.
- Murphy PG, et al. 1999. Endogenous interleukin-6 contributes to hypersensitivity to cutaneous stimuli and changes in neuropeptides associated with chronic nerve constriction in mice. Eur. J. Neurosci. 11: 2243–2253.
- Nakagomi K, Kohwi Y, Dickinson LA, Kohwi-Shigematsu T. 1994. A novel DNA-binding motif in the nuclear matrix attachment DNA-binding protein SATB1. Mol. Cell. Biol. 14: 1852–1860.
- Nimchinsky EA, Sabatini BL, Svoboda K. 2002. Structure and function of dendritic spines. Annu. Rev. Physiol. 64: 313–353.
- Noble F, Benturquia N, Bilkei-Gorzo A, Zimmer A, Roques BP. 2008. Use of preproenkephalin knockout mice and selective inhibitors of enkephalinases to investigate the role of enkephalins in various behaviours. Psychopharmacology (Berl.) 196: 327–335.
- Palop JJ, et al. 2005. Vulnerability of dentate granule cells to disruption of arc expression in human amyloid precursor protein transgenic mice. J. Neurosci. 25: 9686–9693.
- Park BJ, et al. 2001. Calreticulin, a calcium-binding molecular chaperone, is required for stress response and fertility in Caenorhabditis elegans. Mol. Biol. Cell 12: 2835–2845.
- Passey RJ, et al. 1999. A null mutation in the inflammation-associated S100 protein S100A8 causes early resorption of the mouse embryo. J. Immunol. 163: 2209–2216.
- Peebles CL, et al. 2010. Arc regulates spine morphology and maintains network stability in vivo. Proc. Natl. Acad. Sci. U. S. A. 107: 18173–18178.
- Plath N, et al. 2006. Arc/Arg3.1 is essential for the consolidation of synaptic plasticity and memories. Neuron 52: 437–444.
- Poirier R, et al. 2007. Paradoxical role of an Egr transcription factor family member, Egr2/Krox20, in learning and memory. Front. Behav. Neurosci. 1: 6.
- Poli V, et al. 1994. Interleukin-6 deficient mice are protected from bone loss caused by estrogen depletion. EMBO J. 13: 1189–1196.
- Ragnauth A, et al. 2001. Female preproenkephalin-knockout mice display altered emotional responses. Proc. Natl. Acad. Sci. U. S. A. 98: 1958–1963.
- Rauch F, Prud'homme J, Arabian A, Dedhar S, St-Arnaud R. 2000. Heart, brain, and body wall defects in mice lacking calreticulin. Exp. Cell Res. 256: 105–111.
- Rosen KM, McCormack MA, Villa-Komaroff L, Mower GD. 1992. Brief visual experience induces immediate early gene expression in the cat visual cortex. Proc. Natl. Acad. Sci. U. S. A. 89: 5437–5441.
- Saito T, et al. 2005. Somatostatin regulates brain amyloid beta peptide Abeta42 through modulation of proteolytic degradation. Nat. Med. 11: 434–439.
- Sarnico I, et al. 2009. NF-kappaB dimers in the regulation of neuronal survival. Int. Rev. Neurobiol. 85: 351–362.
- Savarese F, et al. 2009. Satb1 and Satb2 regulate embryonic stem cell differentiation and Nanog expression. Genes Dev. 23: 2625–2638.
- Schiffmann SN, et al. 1999. Impaired motor coordination and Purkinje cell excitability in mice lacking calretinin. Proc. Natl. Acad. Sci. U. S. A. 96: 5257–5262.
- Shiromani PJ, et al. 2000. Sleep and wakefulness in c-fos and fos B gene knockout mice. Brain Res. Mol. Brain Res. 80: 75–87.
- Sriram K, O'Callaghan JP. 2007. Divergent roles for tumor necrosis factor-alpha in the brain. J. Neuroimmune Pharmacol. 2: 140–153.
- Stadler F, Schmutz I, Schwaller B, Albrecht U. 2010. Lack of calbindin-D28k alters response of the murine circadian clock to light. Chronobiol. Int. 27: 68–82.
- Sur M, Rubenstein JL. 2005. Patterning and plasticity of the cerebral cortex. Science 310: 805–810.
- Thomas U. 2002. Modulation of synaptic signalling complexes by Homer proteins. J. Neurochem. 81: 407–413.
- Tzingounis AV, Nicoll RA. 2006. Arc/Arg3.1: linking gene expression to synaptic plasticity and memory. Neuron 52: 403–407.
- Watanabe Y, et al. 1996. Null mutation of c-fos impairs structural and functional plasticities in the kindling model of epilepsy. J. Neurosci. 16: 3827–3836.
- Xu T, et al. 2009. Rapid formation and selective stabilization of synapses for enduring motor memories. Nature 462: 915–919.
- Yan TC, et al. 2010. NK1 (TACR1) receptor gene ‘knockout’ mouse phenotype predicts genetic association with ADHD. J. Psychopharmacol. 24: 27–38.
- Yang CH, Huang CC, Hsu KS. 2006. Novelty exploration elicits a reversal of acute stress-induced modulation of hippocampal synaptic plasticity in the rat. J. Physiol. 577: 601–615.
- Yang G, Pan F, Gan WB. 2009. Stably maintained dendritic spines are associated with lifelong memories. Nature 462: 920–924.
- Yasui D, Miyano M, Cai S, Varga-Weisz P, Kohwi-Shigematsu T. 2002. SATB1 targets chromatin remodelling to regulate genes over long distances. Nature 419: 641–645.
- Zhang J, et al. 2002. c-fos regulates neuronal excitability and survival. Nat. Genet. 30: 416–420.
- Zuo Y, Lin A, Chang P, Gan WB. 2005. Development of long-term dendritic spine stability in diverse regions of cerebral cortex. Neuron 46: 181–189.