
 ?Mathematical formulae have been encoded as MathML and are displayed in this HTML version using MathJax in order to improve their display. Uncheck the box to turn MathJax off. This feature requires Javascript. Click on a formula to zoom.
ABSTRACT
A-kinase anchoring protein 79 (AKAP79) is a human scaffolding protein that organizes Ca2+/calmodulin-dependent protein phosphatase calcineurin, calmodulin, cAMP-dependent protein kinase, protein kinase C, and the transcription factor nuclear factor of activated T cells (NFAT1) into a signalosome at the plasma membrane. Upon Ca2+ store depletion, AKAP79 interacts with the N-terminus of STIM1-gated Orai1 Ca2+ channels, enabling Ca2+ nanodomains to stimulate calcineurin. Calcineurin then dephosphorylates and activates NFAT1, which then translocates to the nucleus. A fundamental question is how signalosomes maintain long-term signaling when key effectors are released and therefore removed beyond the reach of the activating signal. Here, we show that the AKAP79-Orai1 interaction is considerably more transient than that of STIM1-Orai1. Free AKAP79, with calcineurin and NFAT1 in tow, is able to replace rapidly AKAP79 devoid of NFAT1 on Orai1, in the presence of continuous Ca2+ entry. We also show that Ca2+ nanodomains near Orai1 channels activate almost the entire cytosolic pool of NFAT1. Recycling of inactive NFAT1 from the cytoplasm to AKAP79 in the plasma membrane, coupled with the relatively weak interaction between AKAP79 and Orai1, maintain excitation-transcription coupling. By measuring rates for AKAP79-NFAT interaction, we formulate a mathematical model that simulates NFAT dynamics at the plasma membrane.
KEYWORDS:
INTRODUCTION
It has now been firmly established that signal transduction is often compartmentalized, accomplished through spatial segregation of signaling molecules into distinct signalosomes. A major orchestrator of signalosomes is the membrane-bound A-kinase anchoring protein (AKAP79) (Citation1). AKAP79 accommodates various adenylyl cyclases to generate cAMP, cAMP-dependent protein kinase A, cAMP-dependent phosphodiesterases that degrade cAMP, the protein phosphatase calcineurin, as well as a host of other kinases and transducers (Citation2Citation–Citation4). Activated protein kinase A remains on AKAP79 and phosphorylates proximal targets, such as the monomeric GTP-binding protein Rad that regulates CaV1.2 Ca2+ channel activity (Citation5). These targets are located within an arc of ~150 to 250 Å of protein kinase A (Citation6). Co-localization of adenylyl cyclase, protein kinase A, and phosphodiesterases allows for the generation of nanodomains of cAMP followed by rapid and selective protein kinase A-dependent phosphorylation (Citation7). Central to this model is the formation of protein-protein networks between AKAP79 and the target, such as the Ca2+ channel or β receptor, placing the target close to tethered protein kinase A. An interesting problem arises when a signaling molecule bound to AKAP79, such as calmodulin or the transcription factor nuclear factor of activated T cells (NFAT), dissociates upon activation and migrates into the cytosol. AKAP79 would remain in the signalosome but, without that key effector present, the signaling strength of the complex is negated, and this would preclude long-term downstream transduction. This problem is nicely encapsulated in the CRAC channel-AKAP79-NFAT triumverate and is the focus of this study.
In many non-excitable cells, Ca2+ release-activated Ca2+ (CRAC) channels are a primary route for raising cytosolic Ca2+ (Citation8). CRAC channels are encoded by the Orai genes (Orai1-3) and require the endoplasmic reticulum Ca2+ sensors STIM1 and STIM2 for activation (Citation9, Citation10). Mechanistically, STIM proteins detect the endoplasmic reticulum Ca2+ content and, following store depletion, migrate to junctional endoplasmic reticulum just below the plasma membrane. At these specialized endoplasmic reticulum-plasma membrane sites, STIM oligomers bind directly to and gate open Orai1, the pore-forming subunit of the CRAC channel (Citation8, Citation9). Ca2+ nanodomains near open CRAC channels regulate the activities of Ca2+-dependent adenylyl cyclases in glia (Citation11), stimulate phospholipase A2 (Citation12), and enhance plasma membrane Ca2+ATPase pump activity through delayed modulation (Citation13). In all cases, the enzymes are positioned close to the CRAC channel, sensing the local Ca2+.
Ca2+ nanodomains near open CRAC channels also activate NFAT1 and NFAT4 transcription factors (Citation14Citation–Citation17), which increase expression of various chemokines and cytokines that help shape immune responses (Citation18). NFAT1-4 comprise a family of Ca2+-dependent transcription factors which are stimulated by the Ca2+-activated protein phosphatase calcineurin, the target for immunosuppressants (Citation19). Active calcineurin dephosphorylates NFAT and thereby leads to the exposure of a nuclear localization sequence, which enables NFAT to migrate into the nucleus. A fraction of cellular calcineurin and NFAT are associated with the plasma membrane through binding to the anchoring protein AKAP79 (Citation20, Citation21). Under non-stimulated conditions, CRAC channels and AKAP79 do not interact, but do so after store depletion (Citation22). Interaction involves the AKAP79 anchoring region (AKAR) on the N-terminus of Orai1 (Citation21). The store-dependent association of AKAP79 with Orai1 ensures calcineurin is brought close to the trigger Ca2+ and, once active, has immediate access to its juxtaposed NFAT targets. Activated calcineurin dephosphorylates NFAT and both activated enzyme and transcription factor dissociate from the AKAP79-Orai1 complex and translocate independently to the nucleus (Citation14, Citation22).
However, there is an inherent challenge with using AKAP79 for long-term NFAT signaling. Although bringing calcineurin and NFAT to Orai1 upon store depletion ensures Ca2+ nanodomains near the open channels activate NFAT, enabling selective stimulation by the Orai1 homolog (Citation21), both stimulated calcineurin and dephosphorylated NFAT then dissociate from AKAP79 (Citation15). This raises a problem: as only the pool of NFAT1 tethered to AKAP79 is activated by CRAC channels (Citation21), how does a cell distinguish between different stimulus exposure times? Without replenishment of calcineurin and phosphorylated NFAT1 on AKAP79, only a fixed bolus of NFAT1 would be activated regardless of stimulus intensity, precluding temporal coding.
Our primary goal in this study was to answer the question of how AKAP79-Orai1 interaction at the plasma membrane can nevertheless lead to sustained NFAT activation. While addressing this, a number of other interesting questions arose. Is the association of AKAP79 with Orai1 confined to where Orai1 channels cluster at endoplasmic reticulum-plasma membrane junctions or does it occur across the plasma membrane? How quickly does NFAT that is tethered to AKAP79 dissociate from the scaffold once Ca2+ entry through CRAC channels occurs? And over what time course does cytosolic NFAT1 bind to AKAP79 at the plasma membrane?
To address these questions and derive a more complete quantitative understanding of AKAP79-Orai1 interaction, we have used high resolution imaging approaches to track the dynamics of AKAP79 in intact HEK cells and its interaction with Orai1 and NFAT1. We find that the interaction between AKAP79 and Orai1 is considerably more transient than that between STIM1 and Orai1. The faster turnover between AKAP79 and Orai1 ensures new AKAP79 molecules with calcineurin and NFAT in tow bind to open Orai1 channels, replacing AKAP79 that has released its cargo. We show that the AKAP79-Orai1 interaction enables local Ca2+ entry through CRAC channels to activate the entire cytoplasmic pool of NFAT, through continued recruitment of NFAT onto plasma membrane AKAP79. Different kinetics of interaction of Orai1 with STIM1 and AKAP79 ensure sustained Ca2+ entry as well as continual replenishment of calcineurin and NFAT, both of which are required for prolonged NFAT activation by spatially confined local Ca2+ signals.
RESULTS
Diffusive behavior of AKAP79 in cells with replete Ca2+ stores.
Following expression of AKAP79-yellow fluorescent protein (YFP) in HEK293 cells, a significant fraction of recombinant protein is expressed at the plasma membrane () (Citation21). Dell’Acqua et al. demonstrated that recombinant AKAP79 was targeted mainly to the plasma membrane in HEK cells, even after disruption of the cortical barrier (Citation23). Because confocal microscopy does not have the spatial resolution to focus exclusively on the plasma membrane, we will refer to the surface expression of AKAP79-YFP as peripheral AKAP79.
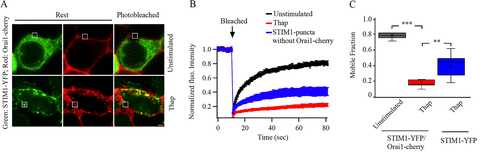
FIG 1 Store depletion reduces AKAP79 mobility at the cell periphery. (A) Images show AKAP79-YFP expression at the cell surface before (labeled Rest) and after photobleaching in an unstimulated cell and in a cell exposed to thapsigargin (Thap; 2 μM for 10 min). The white square depicts the photobleached area. (B) Aggregate data are shown comparing the time course of FRAP between unstimulated and thapsigargin-treated cells. The unstimulated trace is the mean of 8 cells and the thapsigargin (Thap) trace is the mean of 12 cells. (C) Box plots compare t1/2 and mobile fraction for the conditions shown. Median is depicted by the straight line within each box. (D) The kinetics of FRAP are compared between 28 unstimulated cells and 23 cells exposed to thapsigargin. (E) Box plots compare t1/2 and mobile fraction for the conditions indicated. (F) The time course of FRAP is shown for unstimulated cells (9 cells), and in punctate (11 cells) and non-punctate (12 cells) regions of the cell periphery after thapsigargin treatment. (G) The mobile fraction is compared for the conditions indicated. For the data in panels D-G, STIM1 and myc-tagged Orai1 were also expressed. Scale bar denotes 2 μm.
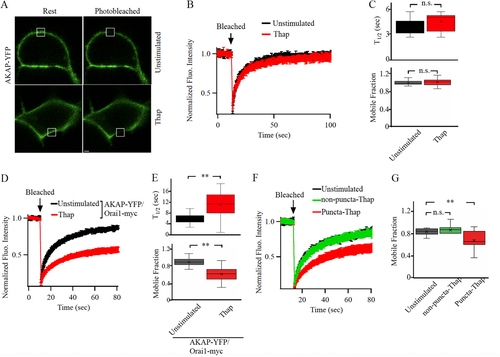
To measure the diffusion of AKAP79-YFP, we photobleached a small area of the cell periphery approx (1 μm x 1 μm) () such that the initial fluorescence fell by ~ 80-90% within 1 sec of bleaching, and then we monitored the recovery of YFP fluorescence as a function of time (). Fluorescence recovery after photobleaching occurred over several seconds (, mean of 8 cells, and , half-time (t1/2) shown in upper panel). The mobile fraction, which is a measure of diffusible AKAP79-YFP into the photobleached spot, was 0.96 (median) (), and 0.97 ± 0.02 (mean ± standard error of the mean [SEM]). The effective diffusion coefficient (Deff), derived from Equationequation 8(8)
(8) in Methods was found to be 0.078 μm2/s under resting conditions.
Following overexpression of STIM1 and Orai1, the t1/2 of recovery of fluorescence of AKAP79-YFP in a photobleached spot in non-stimulated cells was ~ 5 s (, black trace and , t1/2 shown in upper panel) and the mobile fraction was 0.99 (median) (, 0.98 ± 0.02 [mean±SEM]). Both these values are close to those obtained for AKAP79-YFP in the absence of overexpressed Orai1 and STIM1 ( and , P > 0.1 in both cases), supporting previous pulldown and proximity ligation assays that showed little interaction of AKAP79 with Orai1 under non-stimulated conditions (Citation21).
Diffusion of AKAP79 is slowed in Orai1-containing puncta after store depletion.
We measured the kinetics of fluorescence recovery after photobleaching (FRAP) for AKAP79-YFP after store depletion with thapsigargin. In HEK cells expressing AKAP79-YFP and with endogenous levels of STIM and Orai1 proteins, t1/2 for recovery from FRAP increased slightly () but this was not significantly different from the unstimulated response (, upper panel; P < 0.01). Mobile fraction did not change significantly (, lower panel). We reasoned that these small differences reflected the comparatively low levels of endogenous STIM and Orai1, with the consequence that the majority of expressed AKAP79-YFP protein would not be able to engage with Orai1 after store depletion and hence there would be little change in FRAP kinetics. To test this, we overexpressed untagged STIM1 and Orai1-myc together with AKAP79-YFP and stimulated cells with thapsigargin (). The t1/2 for FRAP increased almost 2-fold after thapsigargin (, upper panel; P < 0.01) and the mobile fraction decreased (, lower panel; P < 0.01), compared with unstimulated cells expressing AKAP79-YFP together with STIM1 and myc-tagged Orai1. The median effective diffusion coefficient for AKAP79-YFP fell from 0.078 μm2/s in unstimulated cells to 0.056 μm2/s after thapsigargin treatment (P < 0.05). Orai1 redistributes to punctate-like structures after store depletion. We therefore measured FRAP of AKAP79-YFP in punctate and non-punctate regions of the cell periphery after store depletion. The t1/2 was significantly larger (, 13.5 ± 1.4 s) and the mobile fraction was substantially smaller () in punctate than in non-punctate regions (t1/2 for non-punctate regions was 8.7 ± 0.9 s; P < 0.001 compared with puncta). The t1/2 and mobile fraction values in non-punctate regions after store depletion were similar to values obtained in unstimulated cells ( and , P > 0.12).
To address directly whether AKAP79 diffusion was restricted to a greater extent in punctate regions of the cell periphery, we co-expressed AKAP79-YFP, Orai1-cherry and untagged STIM1 to visualize Orai1 puncta more clearly. In unstimulated cells, both YFP and cherry tagged proteins were distributed close to the plasma membrane (). The kinetics of FRAP (), the t1/2 for recovery of AKAP79-YFP () and the mobile fraction () were all similar to those measured in cells expressing AKAP79-YFP alone (compare and with and ). After stimulation with thapsigargin, Orai1-cherry formed numerous puncta. A fraction of AKAP-YFP also relocated to these puncta (). The kinetics of FRAP was now considerably slower (), the t1/2 increased () and the mobile fraction was smaller for AKAP79-YFP in Orai1-cherry-containing puncta than in unstimulated conditions (, P < 0.001). By contrast, the mobile fraction in non-punctate regions of store-depleted cells was significantly larger than in puncta (, P > 0.2).
FIG 2 AKAP79-YFP diffusion is reduced in Orai1-containing punctate regions of the cell periphery. (A) Images show expression of AKAP79-YFP and Orai1-cherry at the cell surface in an unstimulated cell and in one treated with thapsigargin (Thap). The photobleached area is shown in white. (B) The time course of FRAP is compared between 15 unstimulated cells and 11 cells treated with thapisgargin. (C) Box plot compares t1/2 for the conditions indicated. In (B) and (C), FRAP was carried out at punctate regions of the membrane after thapsigargin treatment. (D) Mobile fraction is compared for the conditions shown.
The finding that AKAP79-YFP FRAP had similar t1/2 values and mobile fractions after store depletion when cells co-expressed either Orai1-myc or Orai1-cherry shows that the tag on Orai1 does not alter AKAP79-YFP diffusion. These data also show that the cherry tag does not affect FRAP of YFP.
Reduced mobility of AKAP79 in puncta requires the presence of Orai1.
To test whether AKAP79-YFP mobility was reduced in puncta after store depletion because of interaction with Orai1, we measured FRAP of AKAP79-YFP in puncta that lacked Orai1. In these experiments, we used a HEK cell in which all 3 Orai genes had been knocked out by CRISPR/Cas (Citation21). Following expression of STIM1-cherry, numerous STIM1 puncta formed after store depletion. We measured AKAP79-YFP FRAP kinetics before and after thapsigargin, and for the latter both in puncta and non-punctate regions. Both t1/2 and mobile fraction in unstimulated cells were similar to those values seen in puncta after store depletion (, P > 0.1). There was also no difference in mobile fraction between puncta (median 0.89; mean 0.89 ± 0.02) and non-punctate regions (median 0.89; mean 0.90 ± 0.03) in thapsigargin-treated cells (P >0.1).
FIG 3 Targeting the AKAR region on Orai1 accelerate AKAP79-YFP recovery from photobleaching after store depletion. (A) AKAP79-YFP mobility is not reduced after store depletion in the absence of Orai expression. In this experiment, Orai1 triple knockout cells were used and cells co-expressed AKAP79-YFP and STIM1-cherry. Upper panels compare mobile fraction and t1/2 for the conditions shown. Lower images compare AKAP79-YFP and STIM1-cherry distribution after stimulation with thapsigargin. All images were taken in the presence of thapsigargin. (B) Images compare NFAT1-GFP translocation to the nucleus following treatment with thapsigargin for the times indicated. Control denotes a cell transfected with scrambled AKAR plasmid and AKAR represents a cell transfected with AKAR plasmid. (C) Aggregate data as in panel B are compared. Control group denotes 24 cells and AKAR group 21 cells. (D) Images show expression of AKAP79-YFP at the cell periphery before and after photobleaching cells transfected with AKAR plasmid. The photobleached area is shown in white. (E) The graph compares the time course of FRAP for the conditions shown following AKAR expression. Unstimulated trace represents the mean of 13 cells and thapsigargin (Thap) trace denotes 14 cells. (F) Mobile fraction is compared. In panels (D) to (F), STIM1 and myc-tagged Orai1 were also overexpressed.
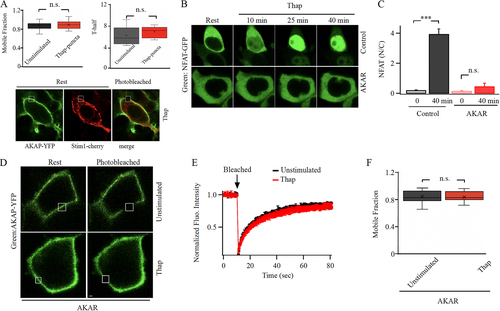
Targeting the AKAR region on the N-terminus of Orai1 suppresses interaction with AKAP79.
The preceding results suggest that the slower recover of AKAP79-YFP fluorescence in punctate-like regions of the cell periphery after photobleaching following store depletion is due to interaction with Orai1. We have recently found that a stretch of amino acids on the N-terminus of Orai1, the AKAP79-association region (AKAR), is essential for interaction between AKAP79 and Orai1 (Citation21). Deletion of this domain or expression of a peptide that mimics the region both prevent association of Orai1 with AKAP79 and subsequent activation and nuclear translocation of NFAT1. If the slower kinetics of FRAP for AKAP79-YFP after store depletion reflects interaction with Orai1, then expression of the AKAR peptide should result in a faster FRAP by abolishing the interaction. To test this, we expressed the AKAR peptide and measured the kinetics of AKAP79-YFP FRAP before and then after store depletion. To confirm that the AKAR peptide indeed prevented association between AKAP79 and Orai1, we monitored NFAT1-GFP translocation to the nucleus. Nuclear accumulation was suppressed by the peptide ( and ), confirming it disrupted AKAP79-Orai1 interaction (Citation21). Expression of the AKAR peptide did not interfere with AKAP79-YFP expression at the plasma membrane (). However, the recovery of AKAP79-YFP fluorescence following photobleaching in AKAR-expressing cells exposed to thapsigargin occurred at a similar rate to that seen in the absence of store depletion (). The mobile fraction between unstimulated cells and thapsigargin-treated cells was also similar following AKAR expression (). Hence the slower recovery of AKAP79-YFP fluorescence after photobleaching in store-depleted cells reflects interaction with Orai1.
AKAP79 interacts with the long isoform of Orai1 but not the short isoform.
Further evidence that the slower recovery of AKAP79-YFP from photobleaching after store depletion arises from association with Orai1 was provided by comparing the kinetics of FRAP in cells expressing AKAP79-YFP and either the long form of Orai1 (Orai1α) or the short form (Orai1β). We have shown that short Orai1 lacks the AKAR domain and is considerably less able to interact with AKAP79 (Citation21). To confirm selective interaction between AKAP79 and the long form of Orai1, we used a proximity ligation assay that identifies co-localization between 2 proteins when <50 nm apart. In this assay, proximity of 2 proteins is reflected in the presence of discrete spots. Orai triple KO cells were co-transfected with AKAP79-YFP, long or short Orai1-FLAG and untagged STIM1. In unstimulated cells, modest overlap of AKAP79 with either long or short Orai1 was observed ( and ). After store depletion with thapsigargin, numerous spots formed between AKAP79-YFP and long Orai1 but not when the short form was expressed instead ( and ).
FIG 4 The long form of Orai1 interacts with AKAP79. (A) Proximity ligation assay shows close association between long Orai1 and AKAP79 after store depletion but not for short Orai1. (B) Aggregate data from experiments as in panel (A) are compared. Each bar is >30 cells. Data are mean ± SEM. (C) Images show AKAP79-YFP surface expression before and after photobleaching in cells expressing either long or short FLAG-tagged Orai1. (D) Kinetics of AKAP79-YFP FRAP before and after store depletion are compared between cells expressing long or short Orai1. Each trace is the mean of 9 to 13 cells. (E) The box plot compares mobile fraction for the conditions depicted. In all experiments, the Orai triple knock out HEK293 cell line was used. Long and short Orai1 were expressed at similar levels, as gauged by anti-FLAG staining.
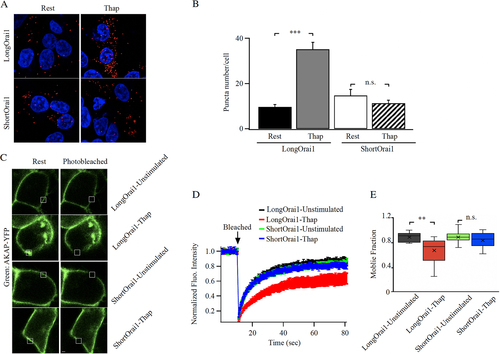
We repeated these experiments using FRAP instead. Both long and short forms of Orai1 did not affect expression of AKAP79-YFP at the cell periphery (). Following photobleaching, t1/2 and the mobile fraction of AKAP79-YFP were similar in the presence of either form of Orai1 in non-stimulated cells ( and ). However, after exposure to thapsigargin, the t1/2 significantly increased () and mobile fraction significantly decreased () for the long form of Orai1 that redistributed to puncta. FRAP kinetics for AKAP79 in cells expressing short Orai1 after store depletion were indistinguishable from the non-stimulated state ( and ), confirming relatively weak interaction between this form of Orai1 and AKAP79.
STIM1-Orai1 interaction shows slow recovery from FRAP.
We measured FRAP between STIM1 and Orai1, to compare the relative interaction dynamics between AKAP79 and STIM1 with Orai1. Following overexpression of STIM1-YFP and Orai1-cherry in the Orai triple knock out HEK cells, numerous puncta were visible after store depletion (). The t½ for FRAP for STIM1 in non-stimulated cells was ~7 s () and the mobile fraction was 0.80 (median; 0.79 ± 0.014) (, mean ± SEM) . The effective diffusion coefficient for STIM1-YFP was calculated to be 0.091 μm2/s, in good agreement with previous FRAP reports of 0.10 μm2/s (Citation24) and 0.15 μm2/s (Citation25). However, after store depletion with thapsigargin, recovery of STIM1 FRAP was slower (), and the mobile fraction fell to 0.21 (median; 0.19 ± 0.02) (, mean ± SEM). To see whether the reduced mobility of STIM1 after store depletion was due to interaction with Orai1 or arose purely from STIM1 oligomerization, we overexpressed STIM1-YFP in the absence of Orai1. The kinetics of FRAP was now faster than that seen in the presence of Orai1 () and the mobile fraction also increased ().
FIG 5 Kinetics of STIM1-Orai1 interaction probed using FRAP. (A) Images show expression of STIM1-YFP and Orai1-cherry before and after store depletion. (B) Time course of FRAP is compared for the conditions shown. Each graph is the mean of 12 to 13 cells. (C) Box plot shows the mobile fraction for each condition.
Effect of altering Ca2+-dependent fast inactivation of CRAC channels on NFAT activation.
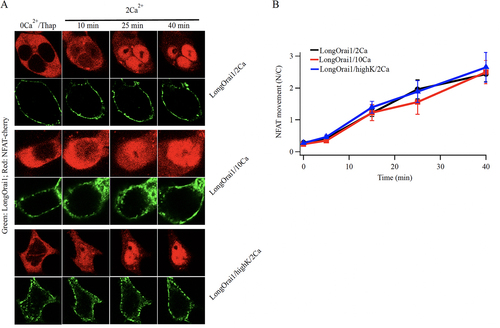
It has been suggested that ability of the long form of Orai1 to activate NFAT is impaired by Ca2+-dependent fast inactivation (CDFI) of the channels (Citation26). CDFI of CRAC channels arises from the action of local Ca2+ on a site 3 to 4 nm from the intracellular mouth of the pore, and develops within tens of milliseconds (Citation27, Citation28). The molecular basis of CDFI is complex, involving both the N-terminus and intracellular loop of Orai1 as well as acidic residues on STIM1 (Citation9). CDFI is manifest only at negative membrane potentials (beyond ~ -60 mV) and increases when extracellular Ca2+ is raised from 2 mM to 10 to 20 mM (Citation27, Citation28). We manipulated CDFI by either depolarizing the membrane potential or increasing extracellular Ca2+ and examined the impact on NFAT1 activation in the triple KO HEK cell line lacking all 3 Orai genes. Raising extracellular Ca2+ from 2 mM to 10 mM increases CDFI of CRAC channels significantly (Citation29) but NFAT1 translocation to the nucleus in long Orai1-expressing cells followed similar time courses and the overall extent of nuclear accumulation was indistinguishable between the two different external Ca2+ concentrations ( and ). CDFI decreases steeply as the membrane potential depolarizes (Citation27, Citation28). We therefore clamped cells close to 0 mV, where no detectable CDFI occurs, by exposing them to high K+ (100 mM)-containing extracellular solution. NFAT1 nuclear translocation proceeded at a similar rate to that seen in normal K+ solution ( and ). Therefore, increasing or decreasing CDFI has little impact on NFAT1 nuclear translocation in intact cells.
FIG 6 Altering Ca2+-dependent fast inactivation has little effect on NFAT nuclear translocation. (A) Images compare nuclear translocation of NFAT1-cherry in Orai triple knock out HEK293 cells expressing the long form of Orai1, under conditions where the rate and extent of fast inactivation is altered. The short form of Orai1 does not interact with AKAP79 and hence does not cause nuclear translocation of NFAT1 (Citation21). (B) Aggregate data from several experiments as in panel (A) are compared. Each point is the mean of 11–13 cells.
Local Ca2+ entry promotes dissociation of NFAT1 from AKAP79.
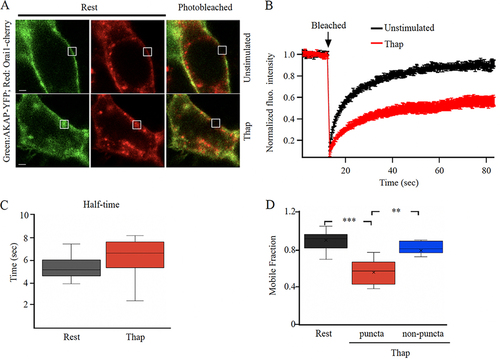
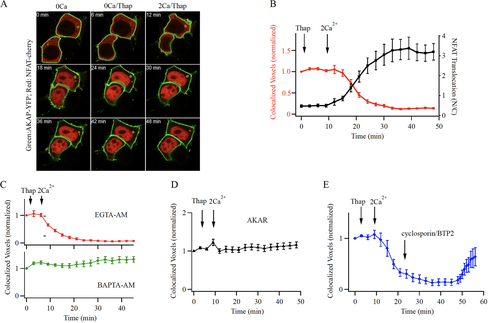
A portion of the total cellular NFAT pool binds to a leucine zipper motif on AKAP79 and is thereby associated with the plasma membrane (Citation20, Citation21). Pulldown of AKAP79 after store depletion has revealed the presence of Orai1, calcineurin and NFAT1, with calcineurin and NFAT1 dissociating from the complex following Ca2+ entry (Citation22). To visualize this more directly, we co-expressed AKAP79-YFP and NFAT1-cherry. Imaging the cell periphery using Airy scan confocal microscopy showed co-localization between AKAP79-YFP and NFAT1-cherry and the proteins remained associated after store depletion in the absence of external Ca2+(). Readmission of external Ca2+ led to release of NFAT from AKAP79 () with a t1/2 of ~ 7 min for the pool at the cell periphery (, red trace). The fall in NFAT1 levels at the cell surface correlated with the rise in nuclear NFAT1 (). Previous work has established that local Ca2+ entry through CRAC channels rather than the subsequent rise in bulk Ca2+ preferentially activates NFAT1 (Citation16, Citation17). Consistent with this, we found that loading the cytosol with the Ca2+ chelator EGTA, which is too slow to affect the size or lateral extent of a Ca2+ nanodomain but suppresses a rise in bulk Ca2+(Citation30, Citation31), failed to prevent NFAT1 dissociation from AKAP79 (, t1/2 ~ 6 min). By contrast, the fast Ca2+ chelator BAPTA, which can buffer Ca2+ within the CRAC channel nanodomain, suppressed NFAT1 dissociation from AKAP79 (). If NFAT1 dissociation requires close interaction between AKAP79 and Orai1, then the AKAR peptide should prevent NFAT1 at the plasma membrane from being released from AKAP79 by local Ca2+ entry. This was indeed the case (). Therefore, the association between AKAP79 and Orai1 enables local Ca2+ signals near open CRAC channels to release NFAT1 that is compartmentalized at the plasma membrane through binding to AKAP79.
FIG 7 NFAT1 dissociates from AKAP79 following local Ca2+ entry through CRAC channels. (A) Airy scan confocal images show co-localization of NFAT1-cherry and AKAP79 close to the cell periphery in unstimulated cells in Ca2+-free (0Ca) external solution, and after exposure to thapsigargin (Thap) in Ca2+-free external solution (0Ca/Thap). After Ca2+ readmission, NFAT1 dissociates from AKAP79 and translocates to the nucleus. Images show responses at different times after Ca2+ readmission (2Ca/Thap). (B) The time course of loss of co-localization of NFAT1 with AKAP79 is shown (red trace). Included in the graph is the time course of NFAT1 translocation into the nucleus in the same cells (black trace). Each point is mean ± SEM of 26 to 30 cells. (C), Loading the cytosol with the slow Ca2+ chelator EGTA (30 min pre-exposure to 10 μM EGTA-AM) does not prevent NFAT1 dissociation from AKAP79 (upper graph). Each point is the mean ± SEM of 25 cells. Loading the cytosol with the fast Ca2+ chelator BAPTA (30 min pre-exposure to 10 μM BAPTA-AM) prevented dissociation of NFAT from AKAP79 (lower graph). Each point is the mean ± SEM of 16 cells. (D) Expression of the AKAR peptide prevents Ca2+ entry through CRAC channels from releasing NFAT1 from AKAP79. Each point is the mean ± SEM of 16 cells. (E) Time course of NFAT1 co-localization with AKAP79 is shown. In these experiments, activation of CRAC channels triggered dissociation of NFAT1 from AKAP79. After 20 min, BTP2 and cyclosporine A were added, to prevent activation of calcineurin. Each point is the mean ± SEM of 14 cells.
Replenishment of the plasma membrane NFAT1 pool.
To measure the time course of NFAT1 rebinding to AKAP79 at the cell periphery, we first activated CRAC channels to drive NFAT1 away from AKAP79-YFP at the cell periphery. After ~ 15 min of Ca2+ entry, when the vast majority of NFAT1 had left the periphery (), we applied both cyclosporine A (1 μM) to inhibit calcineurin and BTP2 to block CRAC channels, and tracked co-localization between NFAT1-cherry and AKAP79-YFP at the periphery. BTP2 suppresses Ca2+ entry within 6 min (data not shown), yet little NFAT reassociated with AKAP79 for at least 15 min (). This reflects the slow rephosphorylation of NFAT1 in the cytosol and nucleus (Citation15). Thereafter, co-localization developed but did so slowly, with 50% recovery after ~12 min (). Hence reassociation of NFAT with AKAP79 is relatively slow, consistent with the slow rephosphorylation kinetics in the cytosol and nucleoplasm.
Quantification of NFAT1 dynamics through 3D-reconstruction.
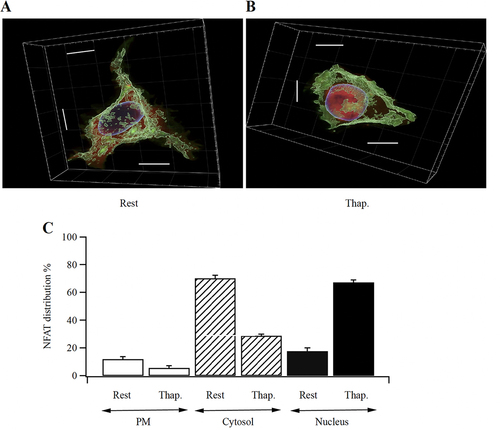
We used Airy scan confocal microscopy with sequential optical slices 222 nm apart in the z-axis, covering the entire cell, in order to quantify the redistribution of NFAT between the cell periphery, cytosol, and nucleus before and after activation of CRAC channels. shows a 3-D image of a non-stimulated cell, with the blue signal showing Hoechst staining of the nucleus, the green signal documenting AKAP79-YFP and the red signal NFAT1-cherry. shows a cell following stimulation with thapsigargin for 30 min. In resting cells, ~10% of the total NFAT1-cherry pool was associated with the cell periphery, ~70% was in the cytosol and ~20% was in the nucleus (). After stimulation with thapsigargin, both peripheral and cytosolic portions fell significantly, and the nuclear levels rose substantially ().
FIG 8 NFAT redistribution following stimulation in 3D-reconstruction of Z-slices spanning the entire cell. (A) Image shows a resting, non-stimulated cell. (B) A cell after stimulation with thapsigargin is shown. Scale bars are all 10 μm. (C) Aggregate data are compared for the different cellular compartments (cell periphery, cytosol and nucleus). Rest versus thapsigargin was significantly different in all 3 groups (P < 0.05 for PM, P < 0.001 for Cytosol and for Nucleus).
Modeling NFAT-AKAP79 membrane dynamics at the cell periphery.
We constructed a simplified model of NFAT1-AKAP79 plasma membrane dynamics ( and for definitions).
FIG 9 Mathematical model for NFAT-AKAP79 plasma membrane dynamics. (A) Cartoon summarizes the various steps in the model. See for definitions. (B) Graph simulates how the various parameters change following CRAC channel activation and then inhibition, shown between the dotted lines. (C) Simulations are superimposed on original data (), for different levels of nuclear export.
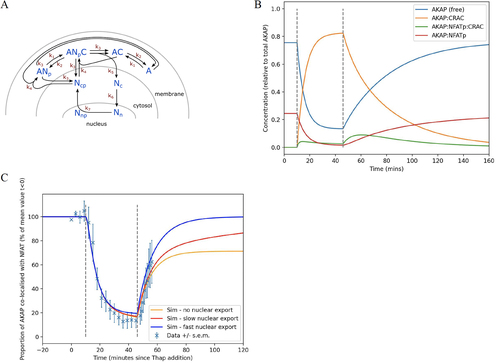
TABLE 1 Model variables and parameters and their descriptions
Writing down reactions shown in with mass-action kinetics gives the following set of equations:
(1)
(1)
(2)
(2)
(3)
(3)
(4)
(4)
(5)
(5)
(6)
(6)
(7)
(7)
By dividing each quantity by [AT] we can work with a set of transformed variables representing the proportion of AKAP in the various states, and the amounts of NFAT relative to total AKAP, without loss of generality. We set [NT]/[AT] = 2 which reflected the fact that a higher proportion of total AKAP was associated with NFAT than total NFAT associated with AKAP79, as seen in Western blot experiments compared to the 3-D reconstruction.
We fitted parameters k1 to k5 by simulating the experiment shown in , that is the activation of CRAC channels in 2 mM Ca2+ at t = 10 followed by inhibition of the channels and subsequent rebinding of NFAT1 to AKAP79. Instead of removing CRAC channel activity at ~t = 30 min we introduce it at t = 46 (due to the apparent sudden increase in AKAP79 and NFAT1 association) with the difference due to the delays associated with multiple (de)phosphorylation events as discussed above, and also time delays associated with spatial movement to and from the nucleus, neither of which are captured in this simplified model. Based on previous work, we treated K6 as fixed at 0.1 min−1 (Citation15). We derived a multi-objective function with likelihood based on square error between the data seen in , nuclear proportion of NFAT at 67% at t = 30 min, and for the amounts of co-localized AKAP79 and NFAT1 to match . With each proposed parameter set, we simulated for 200 min before t = 0 to allow the system to settle into a steady state at rest. The full likelihood function and weightings can be seen in the Open-source Python3 code for all of the simulation fitting and results plots is available at http://www.github.com/mirams/NFAT-and-AKAP. We solved the differential equations using the scipy v1.8.0 ‘odeint’ function and ran maximum likelihood optimization using the global optimization using the CMA-ES algorithm via the PINTS v0.4.0 library (Citation32). The resulting parameter values are shown in .
TABLE 2 Fitted parameter values for the model shown in
Following optimisation, we varied the rate of nuclear export (k7) and this has little effect on the behavior of AKAP79 at the membrane (versions of for each value of k7 can be seen in the code repository). Interestingly, nuclear phosphorylation and export has a strong effect in determining what equilibrium level is reached for the proportion of AKAP79 that is co-localized with NFAT, that is ([ANp]+[ANpC])/([AT]) (). Our model predicts a second ‘hump’ of AKAP79-NFATp-CRAC, which is manifest after the channels are blocked. In the model, this second smaller peak is caused by NFATp rebinding to AKAP79-CRAC channel complexes, enabling a modest buildup before the complex dissociates into AKAP79-NFATp and the CRAC channel. This second hump would provide a supply of NFAT under conditions where CRAC channels activate then deactivate, as seen during physiological Ca2+ oscillations.
Different NFAT isoforms are phosphorylated at different rates in the nucleoplasm and are exported out of the nucleus with strikingly different kinetics. NFAT1 is phosphorylated several folds more slowly than NFAT4 and therefore lingers in the nucleus for considerably longer (Citation15). Differences in nuclear export rate will therefore impact on frequency-dependent signaling. With its faster nuclear exit, NFAT4 better tracks oscillatory Ca2+ signals (Citation14) Our model provides new insight into repetitive NFAT4 signaling in that the AKAP-NFAT4 complex reforms quickly at the cell surface when nuclear export is relatively fast (). Hence relatively more NFAT4 will be available to CRAC channels than NFAT1, enabling frequency-dependent tracking.
DISCUSSION
The involvement of AKAP79 scaffolding in CRAC channel-transcription coupling poses competing requirements: The protein must bind to calcineurin and NFAT and place them adjacent to Orai1 but at the same time ensure that there is a maintained supply of calcineurin and NFAT1, as both are released from AKAP79 by Ca2+ nanodomains near open channels. The interaction between AKAP79 and Orai1 must therefore be strong enough to enable activation of calcineurin and hence NFAT1 by local Ca2+ entry but not so strong as to prevent AKAP79, depleted of calcineurin and NFAT1, from being replaced by AKAP79 replete with enzyme and transcription factor. Our FRAP experiments show that the interaction between AKAP79 and Orai1 results in an ~ 30% decrease in the effective diffusion coefficient of AKAP79-YFP and an ~2-fold decrease in mobile fraction after store depletion. By contrast, the mobile fraction for STIM1-YFP in puncta with Orai1 fell almost 4-fold after store depletion. Therefore, while Orai1 interacts with both STIM1 and AKAP79 after store depletion, the relative strengths of interaction differ significantly. STIM1 forms a comparatively stable complex with Orai1 and free STIM1-YFP molecules exchange only slowly with photobleached STIM1 proteins in puncta with Orai1. Such a relatively tight association ensures the appropriate STIM1-Orai1 stoichiometry is maintained for prolonged CRAC channel activity. The weaker interaction between Orai1 and AKAP79 allows for sustained NFAT activation; the exchange between free AKAP79 and AKAP79 bound to Orai1 provides Orai1 with continuous access to a supply of calcineurin and NFAT. Therefore, a nuanced set of interactions between Orai1 and STIM1 and AKAP79 allows for long-term Ca2+-dependent signaling to the nucleus by CRAC channels.
Our data on STIM1 diffusion are in good agreement with previous FRAP and single particle tracking measurements. Those earlier studies ascribed a diffusion coefficient for STIM1 under non-stimulated conditions of ~0.1 μm2/s (Citation24) and 0.15 μm2/s (Citation25) and a value of 0.116 μm2/s was obtained from single particle tracking (Citation33), all of which are close to the value we obtain (0.091 μm2/s). Wu et al. reported a 4-fold slowing of STIM1 diffusion after store depletion, which was mainly due to interaction with Orai1 at ER-PM junctions (Citation33). Escape of STIM1 and Orai1 from puncta when both proteins are overexpressed is limited because each protein is surrounded by excess of its binding partner. In our experiments, we overexpressed STIM1 and Orai1 to ensure we could visualize puncta clearly. Therefore, the t1/2 of FRAP for STIM1-YFP interacting with Orai1 will be shorter for endogenous levels of protein expression. Because we overexpressed AKAP79-YFP and STIM1-YFP to broadly similar extents, the difference in FRAP kinetics for AKAP79 and STIM1 with Orai1 after store depletion is expected to hold under more physiological levels of expression.
The slower mobility of AKAP79-YFP after store depletion could be due to molecular crowding if lateral diffusion of AKAP79 slows at STIM1-Orai1 puncta but through a mechanism independent of Orai1. Three arguments suggest the slowing of AKAP79 mobility arises from interaction with Orai1. First, expression of the AKAR peptide, which inhibits AKAP79 from associating with Orai1, prevented the decrease in AKAP79 mobility after store depletion. Second, the short form of Orai1 (Orai1β) forms puncta with STIM1 but does not interact with AKAP79. In HEK Orai triple knockout cells, expression of recombinant short Orai1 did not reduce AKAP79-YFP mobility after store depletion. By contrast, AKAP79 mobility was significantly lowered in the presence of long Orai1. Third, the decrease in AKAP79 mobility only occurred when Orai1 was present. In punctate-like structures containing STIM1-cherry expressed in the Orai triple knockout cells, AKAP79-YFP mobility was not reduced following store depletion.
Our data can be rationalized in terms of a diffusion-trap model for activation of store-operated Ca2+ entry (Citation33, Citation34). In this model, STIM1 and Orai1 passively diffuse within the ER and cell surface membrane, respectively. Upon store depletion, STIM1 undergoes a conformational change that leads to exposure of the polybasic domains which facilitate binding to phosphoinositide phospholipids in the plasma membrane at the endoplasmic reticulum-plasma membrane junctions. At these sites, STIM1 binds to the C-terminus of Orai1 channels through the SOAR/CAD domain (Citation9). STIM1 clustering and activation of store-operated Ca2+ entry have been reported to take place in lipid rafts (Citation35). AKAP79 is also targeted to lipid rafts, both through basic residues in the N-terminal domain that interact with negatively charged phosphoinositides (Citation23) and through palmitoylation of cysteine residues in the N-terminus (Citation36). Therefore, a fraction of AKAP79 might be transiently trapped within membrane sub-domains that are associated with active CRAC channels. AKAP79 interacts with the AKAR domain on the N-terminus of Orai1 (Citation21) and we have found that this interaction occurs only at punctate regions of the membrane containing Orai1 clusters. One possibility is therefore that STIM1 binding to Orai1 exposes better the AKAR region on Orai1, favoring AKAP79-Orai1 interaction only at endoplasmic reticulum-plasma membrane junctions where STIM1 and Orai1 interact. Alternative explanations could involve STIM2, which has been suggested to couple AKAP79 to Orai1 (Citation37).
Because expression of an AKAP79 mutant with reduced capacity to bind NFAT1 suppresses CRAC channel-driven activation of NFAT1 (Citation21), the majority of NFAT1 activated by local Ca2+ entry is associated with AKAP79 at the cell periphery. We found that ~10% of NFAT1-cherry was associated with the plasma membrane at rest, ~70% was in the cytosol and ~20% was in the nucleus. However, this changed dramatically upon stimulation. Nuclear levels increased to >70%, whereas cytosolic and plasma membrane-associated NFAT1-cherry fell to ~25% and ~5%, respectively. It is remarkable that local Ca2+ entry through CRAC channels, restricted to < ~100 nm from the plasma membrane, can activate almost the entire cytosolic pool of NFAT1. As it is only NFAT1 associated with AKAP79 at the plasma membrane that is activated by CRAC channels (Citation21), cytosolic phosphorylated (inactive) NFAT must replace NFAT at the plasma membrane that has dissociated from AKAP79 in order to sustain NFAT activation. However, it is not sufficient for cytosolic phosphorylated NFAT1 to bind to the AKAP79-Orai1 complex; calcineurin also has to rebind, in order to couple Ca2+ nanodomains near the channels to NFAT1 activation. Because the mobility of calcineurin through the cytosol is independent of NFAT1, the 2 proteins will bind to AKAP79 at different rates (Citation38). Hence, some AKAP79 molecules associated with Orai1 will, after releasing calcineurin and NFAT1, subsequently rebind either calcineurin or NFAT1, with neither form resulting in NFAT1 activation. Therefore, free AKAP79 in the plasma membrane, with calcineurin and NFAT1 bound, represents the primary source for simultaneous presentation of enzyme and transcription factor to Orai1 channels. NFAT cycling between cytosol and AKAP79 at the plasma membrane ensures local Ca2+ signals near Orai1 remain the exclusive trigger for NFAT1 activation, thereby maintaining specificity.
It is noteworthy that activated calcineurin, liberated from the confines of the plasma membrane following dissociation from AKAP79, does not appear to dephosphorylate cytosolic NFAT to a discernible extent. This could be explained by the finding that cytosolic phosphorylated NFAT is not free in the cytosol but is instead bound within a large macromolecular cytoplasmic RNA-protein scaffold complex from which calcineurin is excluded (Citation39). Therefore, activated calcineurin released from AKAP79 is unlikely to have unhindered access to cytoplasmic phosphorylated NFAT.
To sustain excitation-transcription coupling, the stability of the STIM1-Orai1 complex must last longer than the AKAP79-Orai1 interaction, in order for local Ca2+ entry to ensure several cycles of NFAT activation. Our FRAP experiments demonstrate that this is indeed the case; free AKAP79 exchanged with AKAP79 bound to Orai1 considerably more quickly than free STIM1 replaced STIM1 molecules bound to Orai1. In this way, free AKAP79 acts as a buffer, sequestrating non-active calcineurin and NFAT1 molecules and then replacing AKAP79, relieved of these proteins, on the CRAC channel complex. The more stable STIM1-Orai1 interaction enables Ca2+ entry to continue long enough to activate calcineurin and thereby NFAT on new AKAP79 molecules that have now associated with Orai1.
AKAP scaffolding proteins are thought to enhance signaling in 4 ways. First, by associating with different membranes, AKAPs localize their binding partners to specific sub-cellular domains. Second, AKAPs help determine which proteins participate in a signalosome and therefore define specificity of signaling. Third, AKAPs accelerate signaling by juxtapositioning enzymes with the target. Fourth, by placing protein kinase A, for example, at the nuclear membrane, AKAP75 amplifies protein kinase A activity in the nucleus by facilitating nuclear import (Citation40). Our data add a fifth element to AKAP signaling. The kinetics of AKAP dissociation from a binding partner such as the CRAC channel in a signalosome enables free AKAP molecules, attendant with a new stock of signaling molecules, to join the nexus and thus ensure long-term signaling.
MATERIALS AND METHODS
FRAP.
Fluorescence images were captured on a Zeiss LSM880 confocal microscope (Carl Zeiss Inc.) using a C-Apochromat 40X/1.2 Water DIC objective. The 488 nm laser line from an argon laser at 1.0% power was used for excitation of YFP. Subsequently, a 491 to 579 nm band pass emission filter was used to collect the emission signal with a pinhole set to yield an optical Z-thickness of 6.6 μm. The FRAP experiments were done as a time series of 400 images taken as quickly as possible for the given scanning parameters (zoom 2.5, scan speed 12, line average 1, 512 × 512 pixel size, bidirectional scanning) which yielded a time interval between images of 207 ms. For photobleaching, the 488 nm argon laser was used to bleach a 1.3 μm x 1.3 μm FRAP ROI at 100% laser power for 200 iterations beginning after the 60th frame so that the remaining 340 frames could be used to capture the recovery. After image acquisition, double normalization and quality control were performed according to Light Microscopy Methods and Protocols (https://link.springer.com/book/10.1007%2F978-1-4939-6810-7) with EASY FRAP web (https://academic.oup.com/nar/article/46/W1/W467/5036838). The normalized data sets were then imported into Igor Pro 8 where a double exponential with X offset curve fitting was performed to determine half life (t1/2) and mobile fraction. Measurements of half-time were used to calculate the diffusion coefficient according to Kang et al., (Citation41):
(8)
(8) where Re = 0.75 and Rn = 2.03.
FRAP data were obtained on 1 to 3 cells per coverslip and recordings from multiple coverslips, obtained from different preparations on different days, were combined.
Cell culture.
HEK293 cells were purchased from ATCC. Orai1,2,3 triple knockout (TKO) HEK293 cells, generated using a CRISPR/Cas-9 strategy, were provided by Dr Rajesh Bhardwaj (NIEHS) and Dr Matthias Heidegger (Department of Nephrology and Hypertension, University Hospital Bern) and were cultured in Dulbecco’s modified Eagle’s medium (DMEM) (Thermo Scientific), as described (Citation21). Media were supplemented with 10% fetal bovine serum and 1% penicillin-streptomycin.
Cell transfection.
Plasmid, AKAP79-YFP, was kindly provided by Dr Mark Dell’Acqua (Colorado). Orai1 was myc-tagged as previously described (Citation42), NFAT1-cherry was from Mutagenex, untagged STIM1 and STIM1-YFP, Orai1α-GFP (long Orai1) and Orai1β-GFP (short Orai1) were provided by Dr. James Putney (NIEHS, USA). Orai1-cherry was from Dr Irene Frischauf (Linz University, Austria). The AKAR plasmid, mimicking amino acids 39 to 59 on Orai1 preceded by methionine, was provided by Mutagenex. Plasmids were typically used at 1 μg. When Orai1 was expressed, we used x2 more STIM1. We used 2 μg of AKAP79-YFP plasmid as empirical measurements showed this led to similar levels of YFP expression as seen with STIM1-YFP. HEK293 cells were transfected with Lipofectamine 2000 (Invitrogen), and then incubated in media 24 to 36 h before experiments began.
Proximity ligation assay.
Triple KO HEK293 cells were transfected with either long-Orai1-Flag or short-Orai1-Flag together with AKAP-YFP and untagged STIM1 and then plated on glass coverslips, as described (Citation21). After 24 h, cells were treated with thapsigargin (2 μM) for 15 min. The Duolink In Situ Kit (Millipore Sigma) was used to probe interaction between AKAP79 and Orai1 according to the manufacturer’s instructions. In brief, cells were fixed in 4% paraformaldehyde and permeabilized on ice-cold methanol. After 1 h blocking, the cells were hybridized with anti-GFP (Cell Signaling) and anti-Flag-tagged (Cell Signaling) primary antibodies at 4°C overnight. Cells were washed with Duolink washing buffer A twice for a total of 10 min, then probed with primary antibodies using anti-rabbit PLUS and anti-mouse MINUS probes at 37°C for 1 h. Samples then underwent ligation and amplification processes. After final washing, the slides were mounted using Duolink In Situ mounting medium with DAPI. Fluorescence signal was measured using a Zeiss LSM 880 microscope and puncta number were analyzed with Imaris software.
NFAT translocation.
NFAT1-mcherry levels in the cytosol and nucleus of living cells were measured using a Zeiss LSM 880 inverted confocal microscope with a 40x water immersion objective. Regions of interest of identical size were drawn in the cytosol and nucleus using Fiji software and fluorescence computed. The time course of NFAT1 nuclear translocation accumulation was measured for up to 50 min. One or two images were taken before stimulation and the images were acquired every 5 min after exposure to thapsigargin (2 μM). Nuclear localization was confirmed by co-staining with the nuclear dye DAPI.
NFAT1-cherry and AKAP-YFP co-localization.
HEK293 cells were transfected with NFAT1-cherry and AKAP-YFP. After 24 to 36 h, cells were imaged using an AiryScan detector system attached to a Zeiss LSM 880 inverted confocal microscope. Cells were exposed to thapsigargin (2 μM) in Ca2+-free solution for 5 to 6 min, and then external Ca2+ was readmitted. Images were acquired every 3 min. One or two images were taken in Ca2+-free solution. The extent of colocalization between NFAT and AKAP79 in individual cells was analyzed using Imaris software.
Airyscan confocal super-resolution images were taken on a Zeiss LSM880 confocal microscope with Airyscan (Carl Zeiss Inc.) using a C-Apochromat 40X/1.2 Water DIC objective. For the red channel, a 561 nm DPSS laser at 0.5% power was used for excitation of mCherry while a long pass 570 nm filter collected the emission. For the green channel, a 488 nm ArKr laser line at 0.5% power was used for excitation of YFP while a bandpass 495 to 550 filter was used for collection of the emission signal. The master gain setting of the Airyscan detector was held constant for all images of both channels with a setting of 800. Furthermore, all images were taken with a zoom of 4, a 0.98 μs pixel dwell time, a 0.05 μm pixel size, a physical pinhole setting of 135 μm, and with line averaging set to 2. The imaging experiment were performed as a time series of multiple positions where a total of 25 images were acquired every 3 min at each position.
Individual cells were analyzed across the time series from each position. Time lapse images of each cell were imported into Imaris 9.8 (Oxford Instruments plc), licensed with the Coloc feature. Colocalization thresholds for each channel were manually set and held constant across the entire time series. The number of colocalized voxels for each time point were then exported and subsequently normalized to time zero where a mean and standard error were calculated across all replicates.
3-D reconstruction of NFAT distribution.
Airyscan confocal images below the Rayleigh criterion were taken on a Zeiss LSM880 with Airyscan (Carl Zeiss Inc.) using a C-Apochromat 40X/1.2 Water DIC objective. For the red channel, a 561 nm DPSS laser at 0.5% power was used for excitation of mCherry while a long pass 570 nm filter collected the emission. For the green channel, a 488 nm ArKr laser line at 1% power was used for excitation of YFP while a bandpass 495 to 550 filter was used for collection of the emission signal. For the blue channel, a 405 nm Diode laser at 1% excited Hoechst while a 420 to 480 nm bandpass filter collected the emission. The master gain setting of the Airyscan detector was held constant for all images of all channels with a setting of 800. Furthermore, all images were taken with a zoom of 3, a 1.22μs pixel dwell time, a 0.041 μm pixel size, and a physical pinhole setting of 103 μm. The imaging experiment was performed as Z-stack acquisition of the entire cell with a Z-interval of 0.222 μm.
Z-stack images were imported into Imaris 9.9 (Oxford Instruments plc) and individual cells with dual expression of AKAP79 and NFAT were segmented. A surface mask was made with Imaris to identify the cortical area of the cell while a second surface using Hoechst was used to define the nucleus. The Imaris software was then used to quantify the integrated density of AKAP79 and NFAT in the Cortical area, cytosol, and nucleus.
Statistics.
All statistical analyses used GraphPad Prism 9 software. Graphs are represented as mean ± SEM, whereas Box plots are used present data between 2 parameters. Experiments were repeated at least 3 independent times, using different cell preparations. For statistical analyses with only 2 experimental groups, two-sample t tests were performed, and for statistical analyses with more than 2 experimental groupsa one-way ANOVA was performed. *, **, and *** indicate P-values of < 0.05, < 0.01, and < 0.001, respectively. Differences were considered statistically significant when P < 0.05.
ACKNOWLEDGMENTS
This work was supported by the NIH (grant number Z01) and the Wellcome Trust (grant no. 212203/Z/18/Z). A.B.P. acknowledges support from the NIH via the Intramural Research Program of the NIH, NIEHS. G.R.M. acknowledges support from the Wellcome Trust via a Wellcome Senior Research Fellowship to G.R.M. G.R.M.’s research was funded in whole, or in part, by the Wellcome Trust [212203/Z/18/Z].
For the purpose of open access, the authors have applied a CC-BY public copyright license to any “Author Accepted Manuscript” version arising from this submission.
Declaration of Interests
The authors declare no conflict of interest.
REFERENCES
- Esseltine JL, Scott JD. 2013. AKAP signalling complexes: pointing towards the next generation of therapeutic targets. Trends Pharmacol Sci 34:648–655. https://doi.org/10.1016/j.tips.2013.10.005.
- Klauck TM, Faux MC, Labudda K, Langeberg LK, Jaken S, Scott JD. 1996. Coordination of three signaling enzymes by AKAP79, a mammalian scaffold protein. Science 271:1589–1592. https://doi.org/10.1126/science.271.5255.1589.
- Patel N, Stengel F, Aebersold R, Gold MG. 2017. Molecular basis of AKAP79 regulation by calmodulin. Nat Commun 8:1681. https://doi.org/10.1038/s41467-017-01715-w.
- Kar P, Barak P, Zerio A, Lin Y-P, Parekh AJ, Watts VJ, Cooper DMF, Zaccolo M, Kramer H, Parekh AB. 2021. AKAP79 orchestrates a cyclic AMP signalosome adjacent to Orai1 Ca2+ channels. Function (Oxf) 2:zqab036. https://doi.org/10.1093/function/zqab036.
- Liu G, Papa A, Katchman AN, Zakharov SI, Roybal D, Hennessey JA, Kushner J, Yang L, Chen B-X, Kushnir A, Dangas K, Gygi SP, Pitt GS, Colecraft HM, Ben-Johny M, Kalocsay M, Marx SO. 2020. Mechanism of adrenergic Ca V 1.2 stimulation revealed by proximity proteomics. Nature 577:695–700. https://doi.org/10.1038/s41586-020-1947-z.
- Donelson SF, Esseltine JL, Nygren PJ, Veesler D, Byrne DP, Vonderach M, Strashnov I, Eyers CE, Eyers PA, Langeberg LK, Scott JD. 2017. Local protein kinase A action proceeds through intact holoenzymes. Science 356:1288–1293. https://doi.org/10.1126/science.aaj1669.
- Bers DM, Xiang YK, Zaccolo M. 2019. Whole-cell cAMP and PKA activity are epiphenomena, nanodomain signaling matters. Physiology (Bethesda) 34:240–249. https://doi.org/10.1152/physiol.00002.2019.
- Bakowski D, Murray F, Parekh AB. 2021. Store-operated Ca2+ channels: mechanism, function, pharmacology, and therapeutic targets. Annu Rev Pharmacol Toxicol 61:629–654. https://doi.org/10.1146/annurev-pharmtox-031620-105135.
- Prakriya M, Lewis RS. 2015. Store-operated calcium channels. Physiol Rev 95:1383–1436. https://doi.org/10.1152/physrev.00020.2014.
- Amcheslavsky A, Wood ML, Yeromin AV, Parker I, Freites JA, Tobias DJ, Cahalan MD. 2015. Molecular biophysics of Orai store-operated Ca2+ channels. Biophys J 108:237–246. https://doi.org/10.1016/j.bpj.2014.11.3473.
- Chiono M, Mahey R, Tate G, Cooper DMF. 1995. Capacitative calcium entry exclusively inhibits cAMP synthesis in C6-2B glioma cells. Evidence that physiologically activated Ca2+ entry regulates Ca2+-inhibitable adenylyl cyclase in non-excitable cells. J Biological Chemistry 270:1149–1155. https://doi.org/10.1074/jbc.270.3.1149.
- Chang WC, Parekh AB. 2004. Close functional coupling between CRAC channels, arachidonic acid release and leukotriene secretion. J Biol Chem 279:29994–29999. https://doi.org/10.1074/jbc.M403969200.
- Bautista DM, Lewis RS. 2004. Modulation of plasma membrane calcium-ATPase activity by local calcium microdomains near CRAC channels in human T cells. J Physiol 556:805–817. https://doi.org/10.1113/jphysiol.2003.060004.
- Kar P, Parekh AB. 2015. Distinct spatial Ca2+ signatures selectively activate different NFAT transcription factor isoforms. Mol Cell 58:232–243. https://doi.org/10.1016/j.molcel.2015.02.027.
- Kar P, Mirams GR, Christian HC, Parekh AB. 2016. Control of NFAT isoform activation and NFAT-dependent gene expression through two coincident and spatially segregated intracellular Ca2+ signals. Mol Cell 64:746–759. https://doi.org/10.1016/j.molcel.2016.11.011.
- Somasundaram S, Shum AK, McBride HJ, Kessler JA, Feske S, Miller RJ, Prakriya M. 2014. Store-operated CRAC channels regulate gene expression and proliferation in neural progenitor cells. J Neuroscience 34:9107–9123. https://doi.org/10.1523/JNEUROSCI.0263-14.2014.
- Kar P, Nelson C, Parekh AB. 2011. Selective activation of the transcription factor NFAT1 by calcium microdomains near Ca2+ release-activated Ca2+ (CRAC) channels. J Biol Chem 286:14795–14803. https://doi.org/10.1074/jbc.M111.220582.
- Müller MR, Rao A. 2010. NFAT, immunity and cancer: a transcription factor comes of age. Nat Rev Immunol 10:645–656. https://doi.org/10.1038/nri2818.
- Hogan PG, Chen L, Nardone J, Rao A. 2003. Transcriptional regulation by calcium, calcineurin, and NFAT. Genes Dev 17:2205–2232. https://doi.org/10.1101/gad.1102703.
- Murphy JG, Crosby KC, Dittmer PJ, Sather WA, Dell’Acqua ML. 2019. AKAP79/150 recruits the transcription factor NFAT to regulate signaling to the nucleus by neuronal L-type Ca2+ channels. Mol Biol Cell 30:1743–1756. https://doi.org/10.1091/mbc.E19-01-0060.
- Kar P, Lin Y-P, Bhardwaj R, Tucker CJ, Bird GS, Hediger MA, Monico C, Amin N, Parekh AB. 2021. The N terminus of Orai1 couples to the AKAP79 signaling complex to drive NFAT1 activation by local Ca2+ entry. Proc Natl Acad Sci USA 118:e2012908118. https://doi.org/10.1073/pnas.2012908118.
- Kar P, Samanta K, Kramer H, Morris O, Bakowski D, Parekh AB. 2014. Dynamic assembly of a membrane signaling complex enables selective activation of NFAT by orai1. Curr Biol 24:1361–1368. https://doi.org/10.1016/j.cub.2014.04.046.
- Dell’Acqua ML, Faux MC, Thorburn J, Thorburn A, Scott JD. 1998. Membrane-targeting sequences on AKAP79 bind phosphatidylinositol-4, 5-bisphosphate. EMBO J 17:2246–2260. https://doi.org/10.1093/emboj/17.8.2246.
- Liou J, Fivaz M, Inoue T, Meyer T. 2007. Live-cell imaging reveals sequential oligomerization and local plasma membrane targeting of stromal interaction molecule 1 after calcium store depletion. Proc Natl Acad Sci USA 104:9301–9306. https://doi.org/10.1073/pnas.0702866104.
- Covington ED, Wu MM, Lewis RS. 2010. Essential role for the CRAC activation domain in store-dependent oligomerization of STIM1. Mol Biol Cell 21:1897–1907. https://doi.org/10.1091/mbc.e10-02-0145.
- Zhang X, Pathak T, Yoast R, Emrich S, Xin P, Nwokonko RM, Johnson M, Wu S, Delierneux C, Gueguinou M, Hempel N, Putney JW, Gill DL, Trebak M. 2019. A calcium/cAMP signaling loop at the ORAI1 mouth drives channel inactivation to shape NFAT induction. Nat Commun 10:1971. https://doi.org/10.1038/s41467-019-09593-0.
- Zweifach A, Lewis RS. 1995. Rapid inactivation of depletion-activated calcium current (ICRAC) due to local calcium feedback. J Gen Physiol 105:209–226. https://doi.org/10.1085/jgp.105.2.209.
- Fierro L, Parekh AB. 1999. Fast calcium-dependent inactivation of calcium release-activated calcium current (CRAC) in RBL-1 cells. J Membr Biol 168:9–17. https://doi.org/10.1007/s002329900493.
- Fierro L, Parekh AB. 2000. Substantial depletion of the intracellular Ca2+ stores is required for macroscopic activation of the Ca2+ release-activated Ca2+ current in rat basophilic leukaemia cells. J Physiology (Lond) 522:247–257. https://doi.org/10.1111/j.1469-7793.2000.t01-1-00247.x.
- Neher E. 1988. The influence of intracellular calcium concentration on degranulation of dialyzed mast cells from rat peritoneum. J Physiology (Lond) 395:193–214. https://doi.org/10.1113/jphysiol.1988.sp016914.
- Parekh AB. 2008. Ca2+ microdomains near plasma membrane Ca2+ channels: impact on cell function. J Physiol 586:3043–3054. https://doi.org/10.1113/jphysiol.2008.153460.
- Clerx M, Robinson M, Lambert B, Lei CL, Ghosh S, Mirams GR, Gavaghan DJ. 2019. Probabilistic inference on noisy time series (PINTS). Jors 7:23. https://doi.org/10.5334/jors.252.
- Wu MM, Covington ED, Lewis RS. 2014. Single-molecule analysis of diffusion and trapping of STIM1 and Orai1 at endoplasmic reticulum-plasma membrane junctions. Mol Biol Cell 25:3672–3685. https://doi.org/10.1091/mbc.e14-06-1107.
- Hodeify R, Selvaraj S, Wen J, Arredouani A, Hubrack S, dib M, Al-Thani SN, McGraw T, Machaca K. 2015. A STIM1-dependent 'trafficking trap' mechanism regulates Orai1 plasma membrane residence and Ca2+ influx levels. J Cell Sci 128:3143–3154. https://doi.org/10.1242/jcs.172320.
- Pani B, Ong HL, Liu X, Rauser K, Ambudkar IS, Singh BB. 2008. Lipid rafts determine clustering of STIM1 in endoplasmic reticulum-plasma membrane junctions and regulation of store-operated Ca2+ entry (SOCE). J Biol Chem 283:17333–17340. https://doi.org/10.1074/jbc.M800107200.
- Delint-Ramirez I, Willoughby D, Hammond GRV, Hammond GVR, Ayling LJ, Cooper DMF. 2011. Palmitoylation targets AKAP79 protein to lipid rafts and promotes its regulation of calcium-sensitive adenylyl cyclase Type 8. J Biol Chem 286:32962–32975. https://doi.org/10.1074/jbc.M111.243899.
- Son G-Y, Subedi KP, Ong H-L, Noyer L, Saadi H, Zheng C, Bhardwaj R, Feske S, Ambudkar IS. 2020. STIM2 targets Orai1/STIM1 to the AKAP79 signaling complex and confers coupling of Ca2+ entry with NFAT1 activation. Proc Natl Acad Sci USA 117:16638–16648. https://doi.org/10.1073/pnas.1915386117.
- Al-Daraji WI, Grant KR, Ryan K, Saxton A, Reynolds NJ. 2002. Localization of calcineurin/NFAT in human skin and psoriasis and inhibition of calcineurin/NFAT activation in human keratinocytes by cyclosporin A. J Invest Dermatol 118:779–788. https://doi.org/10.1046/j.1523-1747.2002.01709.x.
- Sharma S, Findlay GM, Bandukwala HS, Oberdoerffer S, Baust B, Li Z, Schmidt V, Hogan PG, Sacks DB, Rao A. 2011. Dephosphorylation of the nuclear factor of activated T cells (NFAT) transcription factor is regulated by an RNA-protein scaffold complex. Proc Natl Acad Sci USA 108:11381–11386. https://doi.org/10.1073/pnas.1019711108.
- Feliciello A, Li Y, Avvedimento EV, Gottesman ME, Rubin CS. 1997. A-kinase anchor protein 75 increases the rate and magnitude of cAMP signaling to the nucleus. Curr Biol 7:1011–1014. https://doi.org/10.1016/S0960-9822(06)00424-6.
- Kang M, Day CA, Kenworthy AK, DiBenedetto E. 2012. Simplified equation to extract diffusion coefficients from confocal FRAP data. Traffic 13:1589–1600.
- Yeh Y-C, Lin Y-P, Kramer H, Parekh AB. 2020. Single-nucleotide polymorphisms in Orai1 associated with atopic dermatitis inhibit protein turnover, decrease calcium entry and disrupt calcium-dependent gene expression. Hum Mol Genet 29:1808–1823. https://doi.org/10.1093/hmg/ddz223.
- Gold M, Stengel F, Nygren PJ, Weisbrod CR, Bruce JE, Robinson CV, Barford D, Scott JD. 2011. Architecture and dynamics of an A-kinase anchoring protein 79 (AKAP79) signaling complex. Proc Natl Acad Sci USA 108:6426–6431. https://doi.org/10.1073/pnas.1014400108.