
Abstract
Although transferrin (Tf) is a glycoprotein best known for its role in iron delivery, iron-independent functions have also been reported. Here, we assessed apoTf (aTf) treatment effects on Neuro-2a (N2a) cells, a mouse neuroblastoma cell line which, once differentiated, shares many properties with neurons, including process outgrowth, expression of selective neuronal markers, and electrical activity. We first examined the binding of Tf to its receptor (TfR) in our model and verified that, like neurons, N2a cells can internalize Tf from the culture medium. Next, studies on neuronal developmental parameters showed that Tf increases N2a survival through a decrease in apoptosis. Additionally, Tf accelerated the morphological development of N2a cells by promoting neurite outgrowth. These pro-differentiating effects were also observed in primary cultures of mouse cortical neurons treated with aTf, as neurons matured at a higher rate than controls and showed a decrease in the expression of early neuronal markers. Further experiments in iron-enriched and iron-deficient media showed that Tf preserved its pro-differentiation properties in N2a cells, with results hinting at a modulatory role for iron. Moreover, N2a-microglia co-cultures revealed an increase in IL-10 upon aTf treatment, which may be thought to favor N2a differentiation. Taken together, these findings suggest that Tf reduces cell death and favors the neuronal differentiation process, thus making Tf a promising candidate to be used in regenerative strategies for neurodegenerative diseases.
Introduction
The most widely characterized component of the central nervous system (CNS), neurons are highly polarized cells showing axons and dendrites at a mature stage. The polarization of axons and dendrites underlies neuronal capacity to integrate and transmit information within the nervous system (CitationBarnes & Polleux, 2009).
Transferrin (Tf) is a glycoprotein of approximately 80 kDa which is capable of reversibly binding Fe3+ and takes part in cellular iron uptake with association constant 1020 M−1 (CitationGkouvatsos et al., 2012). In the CNS, Tf is synthesized by oligodendrocytes (OLG) and cells of the choroid plexus (CitationMoos et al., 2007; CitationMorris et al., 1992; CitationTsutsumi et al., 1989) and has been shown to influence many cellular processes not directly linked with iron metabolism. Neurons are not able to synthesize Tf but incorporate iron from the extracellular space via the transferrin receptor (TfR) and the divalent metal transporter 1 (DMT1) (CitationMoos & Morgan, 2000).
Regarding OLG, previous work by our laboratory and others have shown that apotransferrin (aTf) accelerates oligodendroglial maturation both in vivo (CitationEscobar Cabrera et al.,1994Citation, 1997; CitationEspinosa de los Monteros et al., 1999; CitationMarta et al., 2000; CitationSaleh et al., 2003) and in vitro (CitationPaez et al., 2002; CitationPaez et al., 2004). aTf also prevents iron deficiency-induced hypomyelination (CitationBadaracco et al., 2008; CitationBadaracco et al., 2010), stimulates remyelination in the cuprizone model of demyelination (CitationAdamo et al., 2006), and reduces hypoxic/ischemic white matter and neuronal damage in rats (CitationGuardia Clausi et al., 2010; CitationGuardia Clausi et al., 2012). aTf treatment in oligodendroglial progenitor cells (OPC) leads to Tf internalization through clathrin-mediated endocytosis and subsequent Fyn kinase activation by a mechanism involving TfR (CitationPerez et al., 2013). Nevertheless, despite the beneficial effects of aTf on glial cell populations, its impact on neuronal cells has not been thoroughly assessed.
Neuronal differentiation is a complex process in which the molecular signals of many hormones and neurotransmitters are converted into cellular responses and induce morphological changes. Neural differentiation processes have wide clinical applications. Stem cell-derived neurons have been extensively used in the development of cell-based therapies for the treatment of neurological diseases such as Parkinson’s disease, Huntington’s disease, and amyotrophic lateral sclerosis (Adler, Citation2019). For cell therapy to succeed, however, grafted neuronal progenitors need to differentiate into specific types of neurons, which requires proper inputs from the host environment so that grafted cell activity is suitably regulated (Rossi & Cattaneo, Citation2002). In addition, these cells have been used for fundamental neurological studies, drug-screening platforms, and neurodevelopmental and neurodegenerative disease modeling (Little et al., Citation1994).
In this context, the goal of the present work was to analyze the effect of Tf on neurons and determine its impact on neuronal physiology and differentiation. To these ends, we used Neuro2a (N2a) cells, a fast-growing cell line established from a spontaneous tumor in an albino mouse (CitationOlmsted et al., 1970) which, once induced to differentiate, shares neuronal properties such as the extension of processes, the expression of many neuronal markers and the emergence of electrical activity (CitationNakamura et al., 2000; CitationMusa & Veenstra, 2003). Differentiation was also evaluated in primary cultures of cortical neurons following aTf administration to validate the results obtained in cell line assays. Furthermore, Tf pro-differentiating effects were assessed in iron-deficient and iron-enriched conditions, as well as in co-cultures of N2a cells with OPC and microglia.
Materials and Methods
Materials
Triton X-100, paraformaldehyde, human aTf (Cat. #T2252 Sigma Aldrich), dimethyl sulfoxide (DMSO), Höechst, 5-bromo-2′-deoxyuridine (BrdU), ethidium bromide and dynasore hydrate (Dyn) were obtained from Sigma Aldrich. Dulbecco’s modified Eagle medium (DMEM/F12 Cat. #11320033) was from Thermo Fisher Scientific. Fetal calf serum (FCS) was from Cripion. Rhodamine-phalloidin was from Molecular Probes (Cat. #R415). Human Tf-Texas Red (Tf-red) was from Life Technologies (Cat. #P35376). Mowiol was from Calbiochem. Immun-Blot Polyvinylidenedifluoride (PVDF) membranes were from BIO-RAD. ECL Plus Western blot (WB) reagents were from GE Healthcare. Trizol was from Invitrogen. Oligo(dT) was from Biodynamics. Moloney murine leukemia virus (MMLV) reverse transcriptase was from Promega. Antibodies and their corresponding brands are listed elsewhere. All other reagents were of analytical grade.
Animals
All animal procedures were held following the guidelines established by the Committee of Bioethics at Facultad de Farmacia y Bioquímica, Universidad de Buenos Aires (CICUAL: Exp: 0006360/15; Res: 2429/15). Wistar rats and C57BL/6 mice were housed under 12-h dark/12-h light cycles and fed ad libitum.
N2a Cell Cultures
N2a cells were generously provided by Dr. Morelli’s lab at Instituto Leloir, Buenos Aires, Argentina. Cells were grown at 37°C and 5% CO2 in a humidified atmosphere stove and amplified in an undifferentiated state in proliferation media, which consisted of DMEM/F12 supplemented with 10% FCS. Experiments on cellular response and differentiation were carried out using differentiation media, which consisted of DMEM/F12 deprived of FCS, in the presence or absence of 125 µM N6, 2′-O-Dibutyryladenosine 3′,5′-cyclic monophosphate sodium salt (db-cAMP, Cat. #D0627) with or without aTf (100 µg/ml, Cat. #T2252 Sigma Aldrich), depending on the condition. N2a cells were transfected using PEI MAX 40 K (Polyscience,Cat. #NC1038561). DNA/PEI mixtures were prepared in serum-free DMEM/F12 in a 1 DNA:8 PEI ratio. Experiments were performed 48 h after plasmid transfection. The EKAREV biosensor was provided by Dr. Michiyuki Matsuda (Kyoto University, Kyoto, Japan).
Cortical Neuron Primary Cultures
Cortical neuron cultures were prepared from the brains of mice at postnatal day 2. Briefly, brains were aseptically dissected in DMEM/F12, and meninges were removed and chemically digested with a solution of trypsin (0.05%, Cat. #27250018, Gibco) and DNase (0.06%, Cat. #90083, Gibco) at 37°C for 15 min. Digestion was stopped with FCS and the suspension was mechanically digested by repeated passages through a glass pipette. The resulting cell suspension was transferred to a 15 ml-tube and centrifuged at 300g for 5 min. The supernatant was discarded, and the pellet resuspended in NeuroBasal medium (Cat. #21103049, Thermo Fisher Scientific) containing 2%B27 (Cat. #17504044, Thermo Fisher Scientific) and 0.25 mM GlutaMax I (Cat. #35050061, Thermo Fisher Scientific) without FCS. Cells were counted and plated onto coverslips previously coated with poly-L-lysine at a density of 40,000 cells/well. Cells were kept in a culture stove at 37°C and 5%CO2 for 9 or 15 days depending on treatment.
OPC and Microglia Primary Cultures
Primary cultures of microglial cells from newborn Wistar rats were carried out following McCarthy and de Vellis (1980). After the removal of meningeal membranes, newborn rat cerebral hemispheres were mechanically dissociated in a mixture of DMEM/F12 (1:1 v/v) containing 20 μg/ml streptomycin and 20 U/ml penicillin, supplemented with 10% FCS. Cell suspensions were seeded in 75-cm2poly-L-lysine-coated tissue culture flasks and incubated at 37°C in 5% CO2, with medium changes every 3 days. When cells reached confluence, the microglial subpopulation was obtained after 140 rpm/minute shaking for 1 h. More than 96% of the microglial cells isolated were CD11b-positive (Cat. #CBL1512, EMD Milipore). The cell suspension was centrifuged at 300g for 10 min, and the pellet resuspended in DMEM/F12 (1:1 v/v) with 10% FCS. Cells were cultured either on 12-mm coverslips or 30-mm Petri dishes for 24 h.
OPC were separated from astrocytes by orbital agitation at 240 rpm for 16 h. The cell suspension was filtered through membranes and then centrifuged at 300g for 5 min. The resulting oligodendroglial cell pellet was resuspended in glia defined medium without FCS (GDM; CitationCasaccia-Bonnefil et al., 1996), seeded on poly-L-lysine-coated covers, and maintained for 2 days in the presence of basic fibroblast growth factor (b-FGF; Cat. #100-18B, Peprotech), and platelet-derived growth factor (PDGF; Cat. # 100-13A, Peprotech) before treatment.
N2a Co-Cultures with OPC and Microglia
To obtain N2a and OPC co-cultures, 15,000 N2a cells were cultured overnight in DMEM/F12 supplemented with 5% FCS and added 20,000 OPC the following day. The co-culture was maintained in GDM with or without aTf (100 µg/ml). After 2 days, cells were processed for immunocytochemistry. To obtain N2a and microglia co-cultures, 15,000 N2a cells were processed as described above and added microglia at a density of 15,000 cells/cover in DMEM/F12 supplemented with 10% FCS. After 24 h, the medium was replaced with DMEM/F12 without aTf. Cells were co-cultured for 2 days before the addition of aTf (100 µg/ml) and/or lipopolysaccharide (LPS; 10 ng/mL). Cells were processed for immunocytochemistry and the culture medium for ELISA.
RNA Extraction and PCR
N2a RNA was extracted using Trizol® (Cat. # 15596026 Invitrogen-Thermo Fisher Scientific). following the manufacturer’s instructions. cDNA was obtained using Oligo(dT) and MMLV reverse transcriptase following the protocols provided by the manufacturers. The cDNA was used for PCR reactions by means of a Veriti Thermal Cycler (Applied Biosystems). Primers were obtained from IDT and designed to amplify regions of the Tf and TfR mRNAs; their sequences are detailed in .
Table 1 The Sequences of the Primers of the RT-PCR.
Protein Extraction and WB
Protein extraction was performed with TOTEX extraction buffer (20 nM HEPES pH 7.9, 350nMNaCl, 20% glycerol, 1% Igepal, 1 mM MgCl2, and 0.5 nM EGTA) containing a complete protease inhibitor cocktail (Sigma, complete TM) and 1 mM sodium orthovanadate to avoid protein dephosphorylation. Protein extracts were sonicated and quantified using Bradford’s assay. Proteins were used for SDS-PAGE in 12.5% polyacrylamide gels, loading 40 µg of total protein per lane. Proteins were then transferred onto PVDF membranes previously activated with methanol and afterwards blocked with 5% (w/v) non-fat dry milk in 0.1% a Tween PBS solution for 2 h at room temperature. Membranes were then incubated with primary antibodies overnight at 4°C. All antibodies were diluted in a 1% FCS, 0.1% Tween TBS solution. The following primary antibodies were used: anti-Tf (Cat. # sc-9099, Santa Cruz), anti-CD71 (Cat. # BD-554889, BD Pharmingen), anti-pERK (Cat. # 9101, Cell Signaling), anti-ERK (Cat. # sc-154, Santa Cruz), and anti-GAPDH (Cat. # ab-8245, Abcam). Membranes were washed and incubated with the corresponding horseradish peroxidase (HRP)-conjugated secondary antibodies (Jackson ImmunoResearch Laboratories) for 2 h at 37°C. Immunodetection was performed colorimetrically using 0.1% 3,3′-diaminobenzidine in acetate buffer or through chemiluminescence using ECL Plus WB reagents (Cat. # 32132, Thermo Fisher Scientific). Densitometric analyses were performed using Scion Image software (Scion Corporation). Secondary antibodies were used at a concentration of 1:5,000 for colorimetric detection and 1:10,000 for chemiluminescent detection.
Coomassie Blue Staining
Cells were stained with Coomassie as described by CitationMochizuki and Furukawa (1987). Briefly, N2a cells were cultured on coverslips at 37°C and 5% CO2 for different times and then fixed with 4% paraformaldehyde in PBS for 20 min at room temperature. Cells were incubated with a 46.5% Coomassie Brilliant Blue R-250 solution in methanol (Cat. # 32132, Sigma-Aldrich), 7% acetic acid, and 46.5% distilled water for 20 min at room temperature. Cells were rinsed with a PBS solution several times before being mounted onto glass slides using Mowiol mounting solution.
Immunocytochemistry
Cells were cultured on coverslips at 37°C and 5% CO2 for different times depending on experiments. After fixation with 4% paraformaldehyde in PBS for 20 min at room temperature, cells were permeabilized and blocked simultaneously with a 1% FCS, 0.01% Triton X-100 in PBS solution for 2 h and incubated with the corresponding primary antibodies overnight at 4°C. Coverslips were rinsed and then incubated for 2 h at 37°C with the corresponding fluorescent secondary antibodies. Coverslips were rinsed again and mounted onto glass slides using Mowiol mounting solution. Primary antibodies used in the current work were goat anti-Tf (Cat. # sc-9099, Santa Cruz), mouse anti-CD71 (Cat. # BD-554889, BD Pharmingen); mouse anti-BrdU (Cat. # 170376001, Roche), mouse anti-βIII-tubulin (Cat. # ab-14545, Abcam), and rabbit anti-cleaved-caspase 3 (Cat. # 9664, Cell Signaling). Cy3-, DyLyght488-, and DyLyght594-conjugated secondary antibodies were all from Jackson ImmunoResearch Laboratories.
Tf Uptake Assay
N2a cultures were treated with Tf-red (100 µg/ml) for different time periods (0, 2.5, 5, 10, 15, and 30 min) starting at the beginning of the differentiation condition at 37°C. After being washed with PBS, cells were fixed with 4% paraformaldehyde, and Tf incorporation was quantified by measuring Tf-red fluorescence. Tf endocytic internalization controls were evaluated through (i) the same protocol at 4°C or (ii) the same protocol at 37°C in the presence of 1 µM dynasore (Dyn; Cat. # D7693, Sigma-Aldrich), an inhibitor of dynamin-mediated endocytosis.
Spectral FRET
N2A cells expressing the fluorescence resonance energy transfer (FRET) biosensor EKAREV were seeded in glass-bottom dishes. Cell imaging was performed on an inverted LSM 710 (ZEISS) equipped with an automated stage, an incubation chamber, and Definite Focus system. Data acquisition was performed with ZEN Black 2011 software. Images were acquired with a C-Apochromat 40 × /1.2 water immersion and temperature-corrected objective lens at 1,024 × 1,024 pixels, 16 bits, pixel dwell time 3.15 μs, with open pinhole (600 μm). The emission spectra of fluorescent proteins Cerulean and Venus were determined using a 405 laser for excitation and lambda mode for detection using a 32-channel QUASAR detector arranged with bandwidth channels of 9.7 nm. For FRET experiments, cells were illuminated with a 30-mW, 405-nm diode laser at 2% laser power (550–650 gain), and a 405-nm dichroic mirror; emission was collected at 413- to 723-nm wavelengths every 30 s over 30 min. The saturation level was verified for each image. Phenol red-free DMEM supplemented with 20 mM HEPES was used for reference spectra and experiments, and imaging was performed at 37°C and 5% CO2. Tf was added approximately 2.5 min after the beginning of the experiment. For lambda FRET experiments, the linear unmixing tool of ZEN Black 2011 software was used to obtain an image for each fluorophore using the reference spectra. Image quantification was performed with Fiji software. After background subtraction, FRET and donor intensities were measured for single cells for each time point. The FRET/donor ratio was calculated and normalized to resting levels (before stimulation).
Cytokine Quantification
N2a cells were cultured at a density of 7,000 cells/well in the presence or absence of microglial cells. Cultures were stimulated through the addition of LPS and/or aTf at a concentration of 10 ng/ml and 100 μg/ml, respectively. Conditions were as follows: control without LPS, aTf without LPS, control with LPS, and aTf with LPS. The presence of interleukin (IL)-1β (MLB00C, R&D System), IL-6 (M6000B, R&D System), IL-10 (DY417-5, R&D System), and TNF-α (MTA00B, R&D System) was measured in the culture supernatants after 2 days of treatment using commercially available ELISA kits, following manufacturers’ instructions.
MTT Assay
The MTT (3-(4,5-Dimethylthiazol-2-yl)-2,5-Diphenyltetrazolium bromide (Cat. #475989, Sigma-Aldrich) assay was performed following a method previously published by CitationMosmann (1983). A sterile solution of MTT (5 mg/ml) was added to each well and incubated for 2 h at 37°C. The reaction was stopped with a solution of 10% SDS 0.1 M HCl, and absorbance was measured with an Amersham Biotrack TM II Visible Plate Reader at 570 nm.
Propidium Iodide Incorporation Assay
After 2 days of treatment on poly-L-lysine-treated coverslips, N2a cultures were incubated with a 5 µg/ml propidium iodide (PI, Cat. # P4170 Sigma-Aldrich) solution for 15 min at 37°C. After washing with PBS to remove PI excess, cells were taken alive to an epifluorescence microscope for image acquisition.
BrdU Incorporation Assay
Cells seeded onto coverslips were incubated for 2 days in the presence or absence of aTf (100 µg/ml). Over the last 3 h of treatment, cells were incubated with BrdU (Cat. # B5002, Sigma-Aldrich) at a final concentration of 0.1 mM. Cells were fixed, permeabilized, and blocked as described above for the immunocytochemistry protocol. Cells were incubated overnight with an anti-BrdU primary antibody (1:200, Cat. #170376001, Roche) and the corresponding secondary antibody. Images were acquired, and the rate of BrdU-positive cells was calculated for the different conditions.
Neurite Outgrowth Assay
N2a cells were seeded at an initial density of 15,000 cells/well onto coverslips placed on 24-well plates. Cells were left overnight in DMEM/F12 5% FCS to favor cell adhesion, then washed twice with sterile PBS to remove serum remnants, and cultured in DMEM/F12 without FCS, with or without 125 µM db-cAMP. In the treated condition, human aTf was added to reach a final concentration of 100 µg/ml. All treated conditions were compared with control conditions performed in parallel in which aTf was not added. Cells were incubated at 37°C and 5% CO2 for 48 h and then processed for immunocytochemistry assays. To quantify neurite outgrowth parameters, cells were stained with a primary antibody against βIII-tubulin, a neuronal marker, and rhodamine-phalloidin, a fluorescent conjugated probe which binds to F-actin and thus stains the actin cytoskeleton. Then, four neuronal differentiation parameters were measured: (1) the proportion of differentiated cells measured as the ratio of neurite-bearing cells over total cell nuclei; (2) the average number of neurites per cell; (3) neurite length; and (4) a differentiation score defined as the rate of total neurite length over total nuclei in a given field (CitationLiu et al., 2014).
Intracellular Iron Quantification by the Colorimetric Ferrozine Assay
Intracellular iron was quantified as described by CitationRiemer et al. (2004). Briefly, N2a cells were cultured on coverslips at 37°C for different treatments and then washed with cold PBS. Frozen cells (2 h at −20 °C) were lysed by applying 200 μL 50 mM NaOH to each well and incubating for 2 h at room temperature. Then, 200 μL 10 mM HCl and 200 μL iron-releasing reagent were added (1:1 volumes of 1.4 M HCl and 4.5% (w/v) KMnO4 in H2O), and wells were sealed with foil and incubated for 2 h at 60 °C. Finally, 60 μL of the detection reagent (6.5 mM ferrozine, 6.5 mM neocuproine, 2.5 M ammonium acetate, and 1 M ascorbic acid dissolved in water) was added, and wells were incubated for 30 min at room temperature. Absorbance was measured at 550 nm. Iron content was relativized to protein content in replicate wells.
Microscopy Image Processing
Images were obtained with an Olympus BX-50 epifluorescence microscope, and processed, analyzed, and quantified using Image-Pro Plus Software (Media Cybernetics).
Statistical Analysis
The number of independent values obtained for each experiment is expressed in the corresponding figure. Statistical analysis was performed using GraphPad Prism 5.00 software. Data are presented as the mean ± standard error of the mean (SEM). Student’s t-test and one-way analysis of variance (ANOVA) followed by Dunnett’s comparison test were used to determine statistical significance; ***p < 0.001, **p < 0.01, *p < 0.05, ns: non-significant.
Results
N2a Cells Express TfR and are Able to Internalize Tf from the Culture medium
Our experimental design involved the use of exogenous aTf in the culture medium. For this reason, the abbreviation aTf will be used to make reference to the iron-free compound, Tf will be used when it is not possible to determine whether free iron is bound in the culture medium, and Tf-red will be used to describe experiments using Texas red-conjugatedTf. We analyzed the expression of the key elements in Tf delivery in mammalian cells, Tf and its receptor TfR, through RT-PCR and WB. Results showed both TfR and Tf mRNA but only TfR protein expression in N2a cells in control and treated conditions ( and (B)). Immunocytochemistry assays also showed TfR expression in βIII-tubulin-positive N2a cells ().
Figure 1 N2a cells express both Tf and TfR mRNA but only the TfR protein. (Panel A) RT-PCR experiments performed on mRNA isolated from N2a cells in proliferating and differentiating conditions, in the presence or absence of exogenous aTf addition (100 µg/ml). The subventricular zone (SVZ) of 2-day-old mice, which is known to express both proteins, was used as a positive control. (Panel B) WB analysis of whole N2a lysates cultured in the same conditions as A and incubated with primary antibodies against Tf, TfR, and β-III-tubulin. Pure aTf was used as a positive control. (Panel C) Immunocytochemical assays of differentiated N2a cells labeled with antibodies against β-III-tubulin and TfR. Scale bars represent 15 µm for all images in Panel C. Note. aTf = human apoTransferrin; Ctl = control; Diff = differentiation; Prol = proliferation; SVZ = subventricular zone; Tf = transferrin; TfR = transferrin receptor.
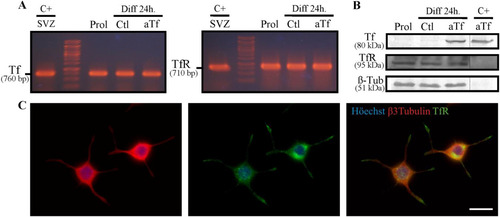
On the basis of TfR expression results, cultures were treated with Tf-red for different periods ranging from 0 to 30 min to assess Tf internalization. N2a cells effectively internalized Tf added to the culture medium, showing an increase as a function of time which became significantly different from controls after 30 min of incubation. To determine whether Tf internalization involved an endocytic mechanism, the assay was also performed at 4°C and in the presence of Dyn, an inhibitor of dynamin-1 and dynamin-2 widely used as a general endocytosis inhibitor. Tf-red internalization was significantly reduced in these two conditions, which suggests the participation of the endocytosis machinery (). Results regarding N2a capacity to internalize Tf were confirmed through WB, which allowed an even earlier detection of Tf ().
Figure 2 N2a cells incorporate Tf. (Panel A) Immunofluorescence images of Tf-red incorporation performed in cultures incubated with Tf-red (100 µg/ml) for time periods ranging from 0 to 30 min. (Panel B) Images of Tf-red incorporation at 4°C and 37°C in the presence or absence of Dyn, a cell-permeable inhibitor of dynamin, for 15 min. Höechst nuclear dye is shown in blue (A and B). Scale bars represent 20 µm for all images in Panels A and B. (Panel C) Quantitation of Tf-red from images shown in A. Tf-red IOD was normalized to total nuclei. (Panel D) Quantitation of Tf-red from images shown in B. Tf-red IOD was normalized to total nuclei. (Panel E) WB analysis of Tf incorporation at different time periods using an anti-Tf antibody. Quantitation is expressed as the Tf/GAPDH ratio. (Panel F) EKAREV sensor evaluation of ERK1/2 activity in N2a cells stimulated with Tf (100 µg/ml) at time 0. The time course of FRET changes was measured at single-cell level. (Panel G) WB analysis of whole N2a lysates treated with Tf (100 µg/ml) for time periods ranging from 0 to 30 min. ERK phosphorylation levels were assessed as the pERK/ERK ratio. Bars in C, D, E, and G represent the mean ± SEM for two independent experiments using one-way ANOVA followed by Dunnett’s multiple comparison test. **p < 0.01, *p < 0.05, ns = non-significant. Symbols above bars indicate significance compared to corresponding control. Note. Dyn = dynasore; GAPDH = glyceraldehyde 3-phosphate dehydrogenase; IOD = integrated optical density; Tf = human transferrin; Tf-red = human transferrin-Texas Red; FRET = fluorescence resonance energy transfer.
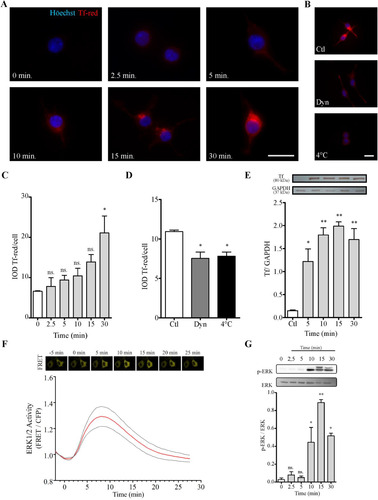
As it is well established that Tf incorporation through its canonical pathway can activate MAPK signaling (CitationPerez et al., 2013), ERK1/2 activation was assessed in response to aTf at short times ranging from 0 to 30 min. ERK1/2 activity evoked by Tf was evaluated at single-cell level using the EKAREV biosensor. An enhancement was observed in FRET responses—indicative of an increase in ERK1/2 activity—with a maximum detected at around 8 min and a return to basal levels at around 25 min (). Moreover, ERK1/2 phosphorylation assessment through WB revealed time-dependent phosphorylation, with a peak at 15 min and a decline afterwards (). Both results suggest that Tf activates the MAPK cascade, reinforcing the notion that internalization occurs through canonical pathway.
Tf Treatment Promotes Neuronal Survival
As N2a cells do not express endogenous Tf but are capable of internalizing it, we next evaluated the effects of aTf addition on different cell parameters. Two conditions were established to characterize treatment effects on differentiated cells, that is, with and without the addition of db-cAMP, an analog of cyclic AMP which has been shown to stimulate N2a differentiation.
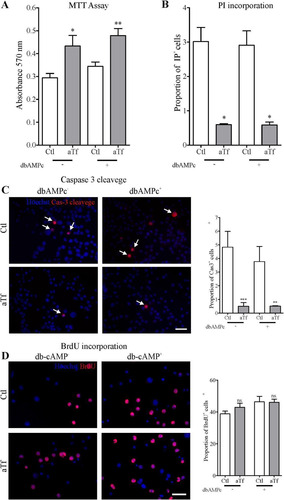
Cell survival evaluation through MTT assays showed that 2-day Tf treatment increased N2a metabolic activity both in the presence and absence of db-cAMP (). Given that this increase in cell survival could be due to a decrease in cell death, an increase in cell proliferation, or a combination of both, we next assessed each of these processes separately. Cell death was analyzed by PI incorporation, a DNA intercalating agent which stains dead cells regardless of the death mechanism involved. Tf was found to reduce cell death after 2 days in culture both in the presence and absence of db-cAMP (). Furthermore, as cell death may occur through auto-phagocytosis, necrosis, or apoptosis (CitationArya & White, 2015), we next determined the cleaved-Caspase-3 proportion, a protein which plays a pivotal role in the execution of apoptosis and is thus used as a marker of apoptotic events. The proportion of apoptotic cells was significantly smaller in the aTf-treated condition than in controls after 2 days in the presence or absence of db-cAMP (). Finally, and in order to determine Tf effects on cell proliferation, cultures were treated with BrdU, a synthetic analog of thymidine which can be incorporated into newly synthesized DNA and can therefore stain newly divided cells. Results showed unaltered N2a cell proliferation rates after 2-day Tf treatment ().
Figure 3 Tf increases cell survival, dampens cell death and apoptosis, and does not affect proliferation in N2a cells. (Panel A) MTT assays on cell viability after 2 days of Tf treatment and 3-h incubation with MTT (0.5 mg/ml). (Panel B) PI incorporation assays on cell death after 2 days of Tf treatment and 15-min incubation with PI (0.02 mg/ml). Cells were photographed alive. (Panel C) Representative immunofluorescence images showing the immunodetection of cleaved-caspase-3 (red) and quantitation analysis. Cleaved-caspase-3 (red) co-localization with Höechst (blue) is indicated with arrows. (Panel D) Representative immunofluorescence images showing the immunodetection of BrdU (red) and quantitation analysis. Höechst dye is shown in blue. Scale bars represent 40 µm for all images in Panels C and D. Bars in A–D represent the mean ± SEM for three independent experiments using Student’s t-tests. ***p < 0.001, **p < 0.01, *p < 0.05, ns = non-significant. Symbols above bars indicate significance compared to corresponding control. Note. aTf = human apoTransferrin; BrdU = 5-bromo-2′-deoxyuridine; Cas-3 cleavage = caspase 3 cleaved; Ctl = control; db-cAMP = N6,2′-O-dibutyryladenosine 3′,5′-cyclic monophosphate sodium salt; MTT = 3-(4,5-dimethylthiazol-2-Yl)-2,5-diphenyltetrazolium bromide.
Tf Promotes Neurite Outgrowth in N2a Cells
As the pro-maturational effects of aTf had been previously established in the oligodendroglial lineage (CitationPaez et al., 2002), we further assessed its impact on neurons by measuring neurite outgrowth, a parameter commonly used to estimate neuronal differentiation. In order to unequivocally determine Tf effects on maturation, we removed the db-cAMP conditions from the original experimental design. The remaining experiments were therefore performed in the presence or absence of aTf in the culture medium during differentiation.
The following criteria were established to quantify differentiated N2a cells according to their morphology: neurites were defined as processes which measured at least twice the soma diameter, and cells were considered differentiated when they bore at least one neurite. Additionally, four differentiation parameters were measured: (1) the proportion of differentiated cells measured as the ratio of neurite-bearing cells over total cell nuclei; (2) the average number of neurites per cell; (3) neurite length; and (4) a differentiation score defined as the rate of total neurite length over total nuclei in a given field (CitationLiu et al., 2014).
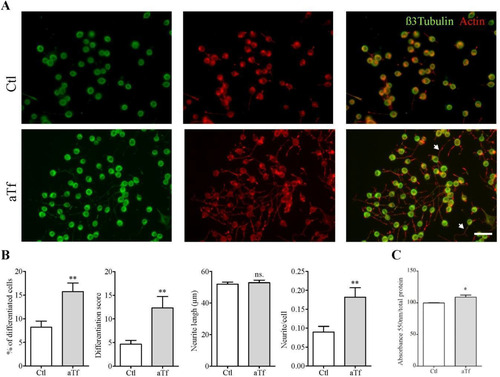
The proportion of neurite-bearing cells was significantly larger in the Tf condition than in controls, as were the average number of neurites per cell and the differentiation score. However, neurite length did not differ between conditions. These results seem to indicate that Tf exerts a pro-differentiating effect on N2a cells ( and (B)). Given that aTf can be loaded with iron before interacting with its receptor and being internalized by cells, and that this protein is involved in cellular iron acquisition, we analyzed intracellular iron concentrations in aTf-treated and untreated conditions after 2-day culture using a colorimetric ferrozine-based assay. Results showed significantly higher levels of intracellular iron in aTf-treated cells than in controls ().
Figure 4 Tf treatment promotes neurite outgrowth and increases intracellular iron levels. (Panel A) Immunocytochemistry images of N2a cells after 2 days of Tf treatment and stained with neuronal marker β-III-tubulin (green) and actin marker phalloidin (red). Neurites are shown with white arrowheads in merge image. Scale bar represents 40 µm for all images in Panel A. (Panel B) Quantitation of four neuronal differentiation parameters after 2 days of Tf treatment: (1) the proportion of differentiated cells measured as the ratio of neurite-bearing cells over total cell nuclei; (2) a differentiation score defined as the rate of total neurite length over total nuclei in a given field; (3) neurite length; and (4) the average number of neurites per cell. (Panel C) Colorimetric ferrozine-based assay on intracellular iron levels after 2 days of Tf treatment. Bars in B and C represent the mean ± SEM for three independent experiments using Student’s t-test. **p < 0.01, *p < 0.05, ns = non-significant. Symbols above bars indicate significance compared to corresponding control. Note. aTf = human apoTransferrin; Ctl = control.
Iron Modulates Tf Pro-Differentiating Effects on N2a Cells
As aTf treatment increased the proportion of differentiated cells and also enhanced intracellular iron concentrations, we wondered whether N2a differentiation could be explained by a direct effect of aTf or by iron intracellular accumulation. To test these alternatives, we cultured cells in either an iron-deficient or an iron-enriched medium. Iron deficiency was induced by the addition of deferoxamine (DFO), a potent iron chelator which renders this ion unavailable to cells; iron enrichment was induced through the addition of two different iron salts, that is, iron sulfate (FeSO4), which provides Fe2+, and iron chloride (FeCl3), which provides Fe3+.
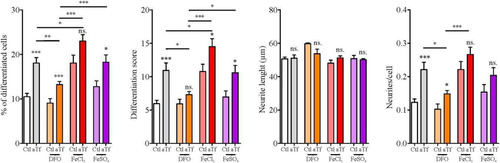
When administered in an iron-deficient medium, Tf was still able to exert its pro-differentiating effect, but the proportion of differentiated cells, the differentiation score, and the number of neurites per cell were significantly lower than those observed with normal iron levels (). When cells were oversupplied with iron, Tf exhibited two different effects, depending on the compound used. In the presence of FeSO4, values were comparable to those obtained with normal iron levels for all parameters measured (). Instead, in the presence of FeCl3, the proportion of differentiated cells and the differentiation score were significantly higher than those obtained in normal iron levels, both in the presence and absence of Tf. These results indicate that iron is capable of modulating the effects of Tf on N2a cells, especially when in a Fe3+ state.
Figure 5 Tf prodifferentiating effect on N2a cells is modulated by iron. Quantitation of neuronal differentiation parameters (1) the proportion of differentiated cells measured as the ratio of neurite-bearing cells over total cell nuclei; (2) a differentiation score defined as the rate of total neurite length over total nuclei in a given field; (3) neurite length; and (4) the average number of neurites per cell in the presence of normal iron levels (white and grey bars), iron deficiency (DFO, orange bars) or iron surplus (FeCl3 and FeSO4, red and purple bars, respectively). Bars represent the mean ± SEM for three independent experiments using one-way ANOVA followed by Dunnett’s comparison test. ***p < 0.001, **p < 0.01, *p < 0.05, ns = non-significant. Symbols above bars indicate significance compared to corresponding control. Note. aTf = human apoTransferrin; Ctl = control; DFO = deferoxamine; FeCl3 = iron (III) chloride; FeSO4 = iron (II) sulfate.
Tf Pro-Differentiating Effects are Mediated by the PI3K-Akt Signaling Pathway
Even if neuronal differentiation is known to involve PI3K-Akt and MEK/ERK signaling (Eagleson, et al., Citation2016), it is a complex process in which several other signaling pathways may be at play. Moreover, aTf maturational effects on OLG are mediated by Fyn/MEK/ERK as well as PI3K/Akt signaling (CitationPerez et al., 2013).To test whether these two signaling pathways are involved in Tf effects on N2a cells, we carried out differentiation experiments in the presence of selective inhibitors of constitutive proteins in both signaling cascades, that is, MEK inhibitor UO126and PI3K inhibitor LY294002.
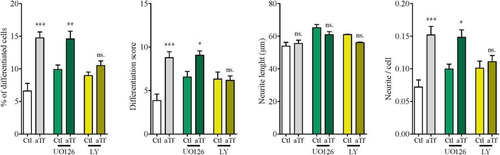
When UO126 was used, differentiation parameters were not affected; Tf increased the proportion of differentiated cells, the differentiation score, and the average number of neurites per cell, while neurite length was not affected. These results suggest that the MEK/ERK pathway is not involved in aTf effects (). In contrast, in the presence of LY209002, Tf failed to increase the proportion of differentiated cells, the differentiation score, or the average number of neurites per cell (). Therefore, Tf pro-differentiating effects were lost when the PI3K-Akt pathway was inhibited, which hints at a critical role for PI3K-Akt signaling in Tf action.
Figure 6 Tf prodifferentiating effect on N2a cells is dependent on PI3K/Akt but not on MEK/ERK signaling. Quantitation of four neuronal differentiation parameters (1) the proportion of differentiated cells measured as the ratio of neurite-bearing cells over total cell nuclei; (2) a differentiation score defined as the rate of total neurite length over total nuclei in a given field; (3) neurite length; and (4) the average number of neurites per cell in the presence of MEK 1/2 inhibitor UO126 (green bars) and PI3K inhibitor LY294002 (yellow bars). Bars represent the mean ± SEM for three independent experiments using one-way ANOVA followed by Dunnett’s comparison test. ***p < 0.001, **p < 0.01, *p < 0.05, ns = non-significant. Symbols above bars indicate significance compared to corresponding control. Note. aTf = human apoTransferrin; Ctl = control; LY = LY294002.
Tf Promotes Cortical Neuron Differentiation
Further assays were carried out to establish whether the pro-differentiating effects of Tf on N2a cells could be replicated in primary cultures of mouse cortical neurons. Firstly, we confirmed that these cells were able to internalize Tf added to the culture medium through a Tf-red incorporation assay (). Given that primary culture neurons establish processes which are much longer and intermingled than N2a cells, images were more complex to analyze. Therefore, two new parameters were defined as indicators of differentiation: the area occupied by doublecortin (DCX), a microtubule-associated protein expressed by immature neurons, and the proportion of NeuN-positive cells, a marker of mature neurons.
Figure 7 Tf treatment promotes neuronal differentiation in primary cultures of cortical neurons. (Panel A) Immunocytochemistry images of Tf-red incorporation by cortical neurons incubated with Tf-red (100 mg/ml, red) for 15 min. TfR is stained in green. (Panel B) Immunocytochemistry images of cortical neurons stained with immature neuronal marker DCX (yellow) and quantitation of DCX area after 4 and 8 days of treatment. (Panel C) Immunocytochemistry images of cortical neurons stained with mature neuronal marker NeuN (red) and quantitation of NeuN+ cells after 4 and 8 days of treatment. Scale bars represent 10 µmin A and 30 µm for all images in panels Band C. Bars in B and C represent the mean ± SEM for three independent experiments using Student’s t-test. **p < 0.01, ns = non-significant. Symbols above bars indicate significance compared to corresponding control. Note. aTf = human apoTransferrin; Ctl = control; DCX = doublecortin; TfR = transferrin receptor; Tf-red = Human transferrin-Texas Red.
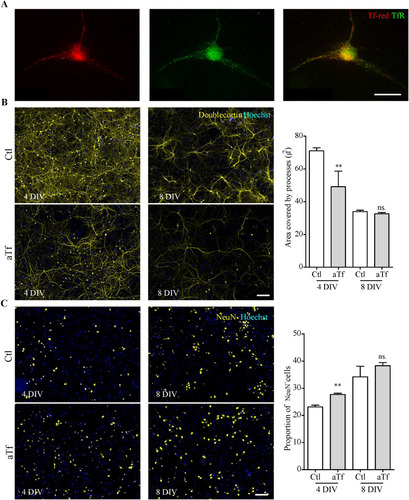
Studies of cortical neuron cultures revealed a significantly smaller area covered by DCX-positive processes after 4-day aTf treatment, although differences were lost after 8-day treatment (). In agreement with this result, more NeuN-positive cells were found at 4 days, but no differences were found 8 days post-treatment (). These results indicate that Tf pro-differentiating effects are conserved in primary cortical cultures. Also, the temporal dynamics of marker expression suggests that neuron differentiation is initially accelerated by Tf but reaches a plateau at longer times.
Tf Does not Affect N2a Maturation in N2a-OPC Co-Cultures
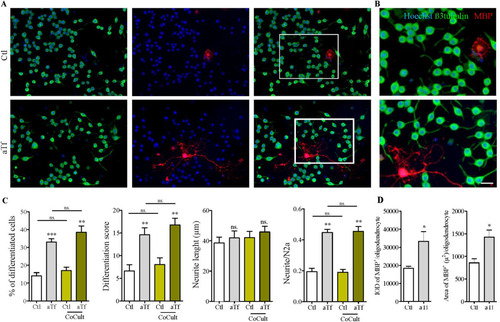
As OPC is one of the main sources of aTf, the impact of OPC on neuronal maturation was next assessed in N2a-OPC co-cultures, with results comparable to those observed in single N2a cultures. Briefly, the proportion of mature neurons, the differentiation index, and the number of neurites per cell increased upon co-culture treatment with aTf, while the average neurite length was unaltered (). In addition, the effect of Tf on N2a-OPC co-cultures and their capacity to express myelin basic protein (MBP) was evaluated using the area of MBP per cell as an indicator of differentiation (CitationFranco et al., 2015; Citationde Faria et al., 2019). Interestingly, results showed an increase in MBP integrated optical density (IOD) and area in OPC after aTf treatment as compared to control co-cultures (). Overall, while aTf affected the maturation of OPC, they exerted no effects on the maturation of neurons.
Figure 8 Tf promotes neuronal differentiation in co-cultures of N2a and oligodendrocyte. (Panel A) Immunocytochemistry images of co-cultures of N2a cells and OPC labeled with antibodies against neuronal marker β-III-tubulin (green) and mature oligodendrocyte marker MBP (red). (Panel B) Insets in A are shown at higher magnification on the right side of each panel. Scale bar in B represents 30 µm for all images in panels A and B. (Panel C) Quantitation of neuronal differentiation parameters (1) the proportion of differentiated cells measured as the ratio of neurite-bearing cells over total cell nuclei; (2) a differentiation score defined as the rate of total neurite length over total nuclei in a given field; (3) neurite length; and (4) the average number of neurites per cell in single N2a cultures (white and grey bars) and co-cultures (yellow bars). (Panel D) Quantitation of MBP IOD and area as oligodendrocyte differentiation parameters in co-cultures of N2a cells and OPC. Bars represent the mean ± SEM for three independent experiments using one-way ANOVA followed by Dunnett’s comparison test. ***p < 0.001, **p < 0.01, *p < 0.05, ns = non-significant. Symbols above bars indicate significance compared to corresponding control. Note. aTf = human apoTransferrin; Ctl = control; IOD = integral optical density; MBP = myelin basic protein.
Tf Protects N2a Cells Upon Microglial Activation in N2a-Microglia Co-Cultures
Cytokine analysis in co-cultures of N2a and non-activated microglia after aTf treatment showed an increase in the synthesis of IL-10 (, grey bars) and a decrease in the synthesis of TNFα, IL-1β, and IL-6 (, grey bars) by microglial cells, although these changes were not statistically significant. In contrast, two differences were observed after microglial activation with LPS (10 ng/mL) as compared to the basal state; first, the synthesis of all cytokines increased regardless of the presence of Tf and, second, the effects produced by Tf became significant, strengthening the hypothesis that aTf modulates microglia toward an M2 phenotype. Worth pointing out, no cytokines were detected in any condition in pure N2a cultures.
Figure 9 Tf induces anti-inflammatory responses in co-cultures of N2a and microglial cells. ELISA of A, IL-10, B, TNF-α, C, IL-1β, and D, and IL-6 release to the culture medium in co-cultures in basal state (white and grey bars) and in the presence of LPS (10 ng/mL, blue bars) after 2 days of Tf treatment (100 µg/mL). Bars in A–D represent the mean ± SEM for three independent experiments using one-way ANOVA followed by Dunnett’s comparison test. ***p < 0.001, **p < 0.01, *p < 0.05, ns = non-significant. Symbols above bars indicate significance compared to corresponding control. Note. aTf = human apoTransferrin; Ctl = control; LPS = lipopolysaccharide.
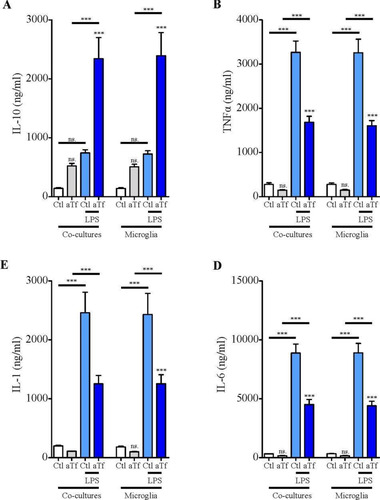
Finally, cytokine concentration assays in supernatants from N2a-microglia co-cultures rendered results similar to those observed in microglial cultures. However, significant differences were observed upon microglial activation with LPS (10 ng/mL); cytokine release in the absence of Tf increased as compared to the basal condition for all the molecules assayed, with the exception of IL-10. In contrast, LPS stimulation in the presence of Tf produced a significant increase in the synthesis of IL-10 and a marked decrease in IL-1β, IL-6, and TNFα (, blue bars).
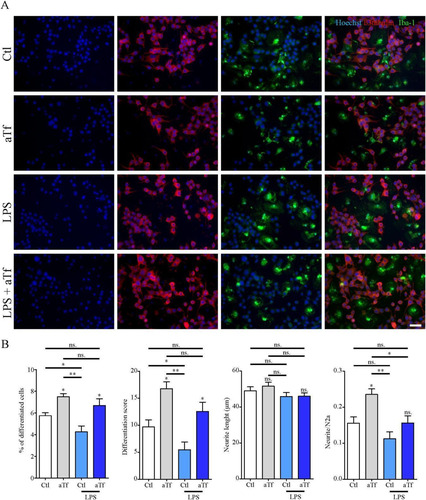
On the basis of Tf effects on cytokine expression in N2a-microglia co-cultures, we next evaluated N2a differentiation parameters to determine whether microglial modulation by Tf has protective effects on neurons (). Microglial activation with LPS reduced both the proportion of differentiated N2a and the differentiation index as compared to control. In contrast, microglial activation in the presence of Tf rendered normal differentiation index values (). These results unveil a neuroprotective function for Tf in the presence of activated microglia.
Figure 10 Tf promotes neurite outgrowth in co-cultures of N2a and microglial cells. (Panel A) Immunocytochemistry images of co-cultures of N2a and microglial cells labeled with neuronal marker β-III-tubulin (red) and microglial marker Iba-1 (green).Scale bar in A represents 40 µm. (Panel B) Quantitation of neuronal differentiation parameters (1) the proportion of differentiated cells measured as the ratio of neurite-bearing cells over total cell nuclei; (2) a differentiation score defined as the rate of total neurite length over total nuclei in a given field; (3) neurite length; and (4) the average number of neurites per cell in basal state (white and grey bars) and in the presence of LPS (10 ng/mL, yellow bars). Bars in B represent the mean ± SEM for three independent experiments one-way ANOVA followed by Dunnett’s comparison test. **p < 0.01, *p < 0.05, ns = non-significant. Symbols above bars indicate significance compared to the corresponding control. Note. aTf = human apoTransferrin; Ctl = control; LPS = lipopolysaccharide.
Discussion
In the CNS, Tf is not expressed by neurons but is synthesized and released to the brain parenchyma by OLG and choroid plexus (Citationde Arriba Zerpa et al., 2000; CitationEspinosa de los Monteros et al., 1990). Also, a small proportion of liver-synthesized Tf crosses the blood–brain barrier (BBB) from the plasma by transcytosis (CitationBradbury, 1997; CitationMalecki et al., 1999). As most mammalian cells, neurons can internalize Tf-bound iron through TfR, which is expressed on their cellular membrane (CitationGiometto et al., 1990; CitationMoos, 1996; CitationJi & Kosman, 2015). In line with this evidence, our N2a cell cultures incorporated Tf by endocytic mechanisms through TfR. To our knowledge, this is the first report on the positive effects of Tf on neuronal cells and suggests that Tf might be a molecular ligand participating in the crosstalk between OLG and neurons. In particular, axonal signals may influence myelinogenesis, while Tf produced by OLG may provide trophic support for neurons and promote neurite outgrowth (CitationMarta et al., 2000, Citation2003).
ApoTf has been previously characterized by our group as a pro-differentiating factor in other CNS cell types. An intracranial injection of aTf in young rats was shown to increase myelination (CitationEscobar Cabrera et al., 1994, Citation1997; CitationMarta et al., 2000; Saleh et al., 2003), which was later concluded to result from acceleration in oligodendroglial maturation (CitationPaez et al., 2002; CitationGarcia et al., 2003). These in vivo effects were in turn reproduced in vitro in OLG primary cultures and in cell lines such as N19 and N20.1 (CitationFranco et al., 2015). Other reports have shown that Tf is not secreted by immature OLG in vitro. These findings are in stark contrast with protein expression in hepatocytes and Sertoli cells and may be attributed to the synthesis of a specific transcript lacking a signal peptide sequence. These results hint at a functional difference between Tf synthesized in the brain and other organs and suggest a specific role, other than iron transport, in OLG maturation and myelination (Citationde Arriba Zerpa et al., 2000).
Tf has the capacity to modulate a variety of cellular processes ranging from cell survival and differentiation to metal detoxification and transport (CitationWang et al., 2016; CitationLevina et al., 2016). Despite the great body of literature supporting Tf capacity to promote cell cycle progression in various cellular systems (CitationBrock et al., 1986; CitationCam et al., 1989; CitationDjeha et al., 1993), our results show no impact of Tf on N2a cell proliferation in culture media lacking FCS. Moreover, our findings showing that Tf prevented neuronal death are in agreement with in vivo results obtained in a hypoxia-ischemia model in mice, where the intranasal administration of aTf prevented white matter and neuronal damage and OLG loss (CitationGuardia Clausi et al., 2012). Moreover, the administration of exogenous aTf has shown neuroprotective effects in experimental ischemic stroke promoting holoTf extravasation (CitationDe Gregorio-Rocasolano et al., 2018). Overall, the reduction observed in cell death may be considered at least partly due to a decrease in apoptosis, which could also be responsible for increased overall metabolic activity.
The differentiation of neural tissue has also been studied in mouse embryonic stem cells. A report by CitationBelovari et al. (2001) confirmed that Tf single-handedly improved neural tissue differentiation not only in vitro but also in transplants of cultured embryos. Both TfR and Tf have been found in embryonic regions where the neural tube is in progress, and Tf is also known to be a growth factor for differentiation contributing iron to the embryo (Hoyle et al., Citation1996).
Regarding the possible molecular mechanisms involved in Tf-dependent differentiation processes, signaling through the MAPK cascade has been shown to play a critical role in the differentiation of various neuronal cell lines (CitationCowley et al., 1994; CitationWaetzig & Herdegen, 2003). In our laboratories, treatment of primary cultures of OPC with aTf has revealed TfR involvement in Fyn kinase activation mechanisms and, in turn, a key role for Fyn kinase activation in MEK-mediated transient phosphorylation of ERK1/2 (CitationPerez et al., 2013). Other reports have linked the differentiating effects observed in different neuroblastoma cell lines, including N2a, with an activation of the MAPK cascade. Reports by CitationChen et al. (2016) have demonstrated that the inhibition of ERK/MAPK hinders neurite outgrowth in N2a cells. Moreover, the forced activation of this cascade rescues cell differentiation, even in the presence of inhibitor stimuli. CitationSarina et al. (2013) established that the induction of neurite growth in PC12 cells in the presence of artemisinin is mediated by ERK phosphorylation. In agreement with these and other reports (CitationChen et al., 2009; CitationChen et al., 2010; CitationWang et al., 2011), our results offer further proof of ERK involvement in Tf-induced neurite outgrowth. In addition, PI3K inhibition through LY294002 offset the differentiating effects of Tf, in line with evidence of PI3K essential role in neuronal polarity (CitationShi et al., 2003; CitationMénager et al., 2004). Furthermore, our group has previously reported that aTf effects on OLG are mediated by PI3K/Akt and that TfR endocytosis is fundamental for triggering signal transduction, which subsequently spurs differentiation (CitationPerez et al., 2013)
In terms of N2a cell differentiation parameters, we observed a greater proportion of neurite-bearing cells upon Tf treatment but, unexpectedly, no significant changes in average neurite length, which could be due to the fact that such neurites have reached their maximum potential growth. These pro-differentiating effects of Tf are again in line with those described by CitationSriramoju et al. (2015), who showed lactoferrin-induced neuroblastoma cell differentiation. The greater proportion of microtubule-associated protein 2-positive cells promoted by Tf in primary cultures of cortical neurons can be interpreted as a higher number of postmitotic, differentiated cells. Worth pointing out, CitationMarta et al. (2003) reported an increase in the percentage of myelinated axons in different areas of the brain such as the corpus callosum and optic nerve in vivo after an intracranial injection of aTf, These results allow us to speculate that Tf synthesized by choroid plexus cells and secreted to the media (CitationEspinosa de los Monteros et al., 1999) could be incorporated by neuronal cells, thus inducing their differentiation and generating an increase in myelin production by OLG to meet axon myelination demands.
The pro-differentiating effects of Tf on neurons may result from either an increase in iron transport by Tf, as it has a major role in brain maturation, or the triggering of intracellular signals. Indeed, it is well documented that the lack of iron alters dendritic morphology and blocks communication between neuronal synapses (CitationJorgenson et al., 2003; CitationBrunette et al., 2010). On the other hand, CitationEscobar Cabrera et al. (1994) postulated that the maturational effect of aTf was independent of iron and demonstrated that the administration of iron-dextran failed to reproduce the effects of aTf. Also, CitationRosato-Siri et al. (2010) observed that hypomyelination in an iron deficiency model was corrected by aTf treatment when the hematocrit was low, which indicates that iron is not involved in myelin recovery. Experiments will be carried out mutating the site of iron binding in Tf to clarify this point. The second hypothesis has been tested through the activation of canonical signaling pathways associated to the endocytosis mechanism mediated by TfR in response to aTf treatment (CitationPerez et al., 2013; CitationEnglish et al., 2018; CitationYarwood et al., 2017). Experiments carried out at low and high iron concentrations confirmed that iron can partly modulate the pro-differentiating effects of Tf, while the signal originated when Tf is internalized by endosomes may also be involved. If this were the case, and given that Tf affinity for its receptor increases with iron binding, a larger amount of iron in the medium could favor its uptake and, as a consequence, trigger intracellular signals. Whether these effects are mediated by aTf without iron or by the Tf-iron complex remains to be fully elucidated. However, results obtained in DFO-treated cultures suggest that both aTf and/or Tf-iron complexes may take part in pro-differentiating effects.
Microglia are the resident immune cells of the CNS and represent about 5–12% of total brain cells in healthy conditions. It has been well established that microglial cells are in close contact with neurons, as well as with OLG and astrocytes. Interestingly, it has been demonstrated that IL-10, which could also be released by microglia, may antagonize certain functions of IL-1β, TNF-α, and the expression of iNOS (Park et al., Citation2006). In addition, IL-10 can also abrogate IL-1β-induced inhibition of glutamate release (Kelly et al. Citation2011). These data are in agreement with our results showing an increase in IL-10, which antagonizes TNF-α, IL-1β, and IL-6 in the presence of Tf and LPS and induces neuronal differentiation.
It is well known that, in vitro, microglial cells express TfR and can incorporate Tf added to the medium. Studies by our group demonstrate that treatment with Tf modifies the microglial response, producing an increase in metabolic activity in basal, non-LPS stimulated conditions due to cellular proliferation. Tf in activated microglia produces an even sharper proliferative effect, as a decrease in nitrite release increases their phagocytic capacity (CitationCarden et al., 2019) and probably induces an M2 phenotype or an anti-inflammatory profile associated with regeneration (CitationCameron & Landreth, 2010). In this work, cytokine expression profiles showed no differences between cultures of microglia and co-cultures with N2a, which is consistent with N2a inability to synthesize cytokines. However, microglial activation with LPS blocked N2a differentiation in co-culture conditions. Of note, this effect was offset by Tf, which induced a recovery in N2a differentiating capacity and differentiation index and rendered control non-LPS-activated values. Even if this work did not address other potentially neuroprotective cytokines such as TGF-β, results suggest an important role for Tf in neuroregeneration, not only by promoting neural cell differentiation, but also by inducing an increase in IL-10 and modulating microglia toward an anti-inflammatory phenotype.
Although further studies will determine whether the pro-differentiating effects are mediated by aTf or Tf-transported iron, the current findings suggest that Tf reduces neuronal cell death and favors the differentiation process. Altogether, our results make Tf a promising candidate to be used in regenerative strategies in the context of neurodegenerative diseases.
Author Contributions
Pasquini JM, Correale JD, and Paez PM constructed the hypothesis of research. Carden TR, Perez MJ, and dos Santos Claro PA conducted the experiments. Carden TR, Perez MJ, Paez PM, Correale JD, and Pasquini JM planned the methodology to reach the conclusions. Silberstein S and Cheli V collaborated with some of the experiments and manuscript editing. Pasquini JM, Carden TR, and Perez MJ wrote the manuscript and all the authors read and scientifically reviewed the article before submission.
Declaration of Conflicting Interests
The author(s) declared no potential conflicts of interest with respect to the research, authorship, and/or publication of this article.
ORCID iDs
María Julia Pérez https://orcid.org/0000-0002-4184-4838
Jorge Correale https://orcid.org/0000-0003-4756-9889
Juana M. Pasquini https://orcid.org/0000-0001-7683-0228
Acknowledgments
The authors are grateful to Dr. Lucas Silvestroff for helpful experiments and discussion, Dr. Laura Morelli for providing the N2a cell line, and María Marta Rancez for editing this work.
Funding
The author(s) disclosed receipt of the following financial support for the research, authorship, and/or publication of this article: This work was supported by grants from Consejo Nacional de Investigaciones Científicas y Técnica (CONICET) (PIP 0356).
References
- Adamo A. M., Paez P. M., Escobar Cabrera O. E., Wolfson M., Franco P. G., Pasquini J. M., Soto E. F. (2006). Remyelination after cuprizone-induced demyelination in the rat is stimulated by apotransferrin. Experimental Neurology, 198(2), 519–529. https://doi.org/10.1016/j.expneurol.2005.12.027
- Adler A. F., Cardoso T., Nolbrant S., Mattsson B., Hoban D. B., Jarl U., Wahlestedt J. N., Grealish S., Björklund A., Parmar M. (2019). hESC-derived dopaminergic transplants integrate into basal ganglia circuitry in a preclinical model of Parkinson’s disease. Cell Reports, 28(13), 3462–3473. https://doi.org/10.1016/j.celrep.2019.08.058
- Arya R., White K. (2015). Cell death in development: Signaling pathways and core mechanisms. Seminars in Cell & Developmental Biology, 39, 12–19. https://doi.org/10.1016/j.semcdb.2015.02.001
- Badaracco M. E., Ortiz E. H., Soto E. F., Connor J., Pasquini J. M. (2008). Effect of transferrin on hypomyelination induced by iron deficiency. Journal of Neuroscience Research, 86(12), 2663–2673. https://doi.org/10.1002/jnr.21709
- Badaracco M. E., Siri M. V., Pasquini J. M. (2010). Oligodendrogenesis: The role of iron. Biofactors, 36(2), 98–102. https://doi.org/10.1002/biof.90
- Barnes A. P., Polleux F. (2009). Establishment of axon-dendrite polarity in developing neurons. Annual Review of Neuroscience, 32, 347–381. https://doi.org/10.1146/annurev.neuro.31.060407.125536
- Belovari T., Buliæ-Jakuš F., Juriæ-Lekiæ G., Mariæ S., Je’ek D., Vlahoviæ M. (2001). Differentiation of rat neural tissue in a serum-free embryo culture model followed by in vivo transplantation. Croatian Medical Journal, 42(6), 611–617. http://www.cmj.hr/2001/42/6/11740842.pdf
- Bradbury M. W. (1997). Transport of iron in the blood-brain-cerebrospinal fluid system. Journal of Neurochemistry, 69(2), 443–454. https://doi.org/10.1046/j.1471-4159.1997.69020443.x
- Brock J. H., Mainou-Fowler T., Webster L. M. (1986). Evidence that transferrin may function exclusively as an iron donor in promoting lymphocyte proliferation. Immunology, 57(1), 105–110.
- Brunette K. E., Tran P. V., Wobken J. D., Carlson E. S., Georgieff M. K. (2010). Gestational and neonatal iron deficiency alters apical dendrite structure of CA1 pyramidal neurons in adult rat hippocampus. Developmental Neuroscience, 32(3), 238–248. https://doi.org/10.1159/000314341
- Cam Y., Boukari A., Ruch J. V. (1989). Stimulatory effect of transferrin on the proliferation of embryonic mouse molar pre-odontoblasts and pre-ameloblasts in organ culture. Archives of Oral Biology, 34(3), 153–159. https://doi.org/10.1016/0003-9969(89)90002-2
- Cameron B., Landreth G. E. (2010). Inflammation, microglia, and Alzheimer’s disease. Neurobiology of Disease, 37(3), 503–509. https://doi.org/10.1016/j.nbd.2009.10.006
- Carden T. R., Correale J. D., Pasquini J. M., Pérez M. J. (2019). Transferrin enhances microglial phagocytic capacity. Molecular Neurobiology, 56, 6324–6340. https://doi.org/10.1007/s12035-019-1519-0
- Casaccia-Bonnefil P., Aibel L., Chao M. V. (1996). Central glia and neuronal populations display differential sensitivity to ceramide-dependent cell death. Journal of Neuroscience Research, 43(3), 382–389. https://doi.org/10.1002/(SICI)1097-4547(19960201)43:3<382::AID-JNR13>3.0.CO;2-7
- Chen J., Zacharek A., Cui X., Shehadah A., Jiang H., Roberts C., Lu M., Chopp M. (2010). Treatment of stroke with a synthetic liver X receptor agonist, TO901317, promotes synaptic plasticity and axonal regeneration in mice. Journal of Cerebral Blood Flow and Metabolism: Official Journal of the International Society of Cerebral Blood Flow and Metabolism, 30(1), 102–109. https://doi.org/10.1038/jcbfm.2009.187
- Chen L., Feng P., Zhu X., He S., Duan J., Zhou D. (2016). Long non-coding RNA Malat1 promotes neurite outgrowth through activation of ERK/MAPK signalling pathway in N2a cells. Journal of Cellular and Molecular Medicine, 20(11), 2102–2110. https://doi.org/10.1111/jcmm.12904
- Chen X., Fu W., Tung C. E., Ward N. L. (2009). Angiopoietin-1 induces neurite outgrowth of PC12 cells in a Tie2-independent, beta1-integrin-dependent manner. Neuroscience Research, 64(4), 348–354. https://doi.org/10.1016/j.neures.2009.04.007
- Cowley S., Paterson H., Kemp P., Marshall C. J. (1994). Activation of MAP kinase is necessary and sufficient for PC12 differentiation and for transformation of NIH 3T3 cells. Cell, 77(6), 841–852. https://doi.org/10.1016/0092-8674(94)90133-3
- de Arriba Zerpa G. A., Saleh M. C., Fernandez P. M., Guillou F., Espinosa de los Monteros A., de Vellis J., Zakin M. M., Baron B. (2000). Alternative splicing prevents transferrin secretion during differentiation of a human oligodendrocyte cell line. Journal of Neuroscience Research, 61(4), 388–395. https://doi.org/10.1002/1097-4547(20000815)61:4<388::AID-JNR5>3.0.CO;2-Q
- de Faria O., Dhaunchak A. S., Kamen Y., Roth A., Kuhlmann T., Colman D. R., Kennedy T. (2019). TMEM10 promotes oligodendrocyte differentiation and is expressed by oligodendrocytes in human remyelinating multiple sclerosis plaques. Scientific Reports, 9(1), 3606. https://doi.org/10.1038/s41598-019-40342-x
- De Gregorio-Rocasolano D., Martí-Sistac O., Ponce J., Castelló-Ruiz M., Millán M., Guirao V., García-Yébenes I., Salom J. B., Ramos-Cabrer P., Alborch E., Lizasoain I., Castillo J., Dávalos A., Gasull T. (2018). Iron-loaded transferrin (Tf) is detrimental whereas iron-free Tf confers protection against brain ischemia by modifying blood Tf saturation and subsequent neuronal damage. Redox Biology, 15, 143–158. https://doi.org/10.1016/j.redox.2017.11.026
- Djeha A., Perez-Arellano J. L., Brock J. H. (1993). Transferrin synthesis by mouse lymph node and peritoneal macrophages: Iron content and effect on lymphocyte proliferation. Blood, 81(4), 1046–1050. https://doi.org/10.1182/blood.V81.4.1046.1046
- Eagleson K. L., Lane C. J., Mcfadyen-Ketchum L., Solak S., Wu H. H., Levitt P. (2016). Distinct intracellular signaling mediates C-MET regulation of dendritic growth and synaptogenesis. Developmental Neurobiology, 76(10), 1160–1181. https://doi.org/10.1002/dneu.22382
- English E. J., Mahn S. A., Marchese A. (2018). Endocytosis is required for CXC chemokine receptor type 4 (CXCR4)-mediated Akt activation and antiapoptotic signaling. Journal of Biological Chemistry, 293(29), 11470–11480. https://doi.org/10.1074/jbc.RA118.001872
- Escobar Cabrera O. E., Bongarzone E. R., Soto E. F., Pasquini J. M. (1994). Single intracerebral injection of apotransferrin in young rats induces increased myelination. Developmental Neuroscience, 16(5-6), 248–254. https://doi.org/10.1159/000112116
- Escobar Cabrera O. E., Zakin M. M., Soto E. F., Pasquini J. M. (1997). Single intracranial injection of apotransferrin in young rats increases the expression of specific myelin protein mRNA. Journal of Neuroscience Research, 47(6), 603–608. https://doi.org/10.1002/(SICI)1097-4547(19970315)47:6<603::AID-JNR5>3.0.CO;2-H
- Espinosa de los Monteros A., Kumar S., Scully S., Cole R., de Vellis J. (1990). Transferrin gene expression and secretion by rat brain cells in vitro. Journal of Neuroscience Research, 25(4), 576–580. https://doi.org/10.1002/jnr.490250416
- Espinosa de los Monteros A., Kumar S., Zhao P., Huang C. J., Nazarian R., Pan T., Scully S., Chang R., de Vellis J. (1999). Transferrin is an essential factor for myelination. Neurochemical Research, 24(2), 235–248. https://doi.org/10.1007/s11064-004-1826-2
- Franco P. G., Pasquini L. A., Pérez M. J., Rosato-Siri M. V., Silvestroff L., Pasquini J. M. (2015). Paving the way for adequate myelination: The contribution of galectin-3,transferrin and iron. FEBS Letters, 589(2015), 3388–3395. https://doi.org/10.1016/j.febslet.2015.08.001
- Garcia C. I., Paez P., Soto E. F., Pasquini J. M. (2003). Differential effects of apotransferrin on two populations of oligodendroglial cells. Glia, 42(4), 406–416. https://doi.org/10.1002/glia.10227
- Giometto B., Bozza F., Argentiero V., Gallo P., Pagni S., Piccinno M. G., Tavolato B. (1990). Transferrin receptors in rat central nervous system. An immunocytochemical study. Journal of the Neurological Sciences, 98(1), 81–90. https://doi.org/10.1016/0022-510X(90)90183-N
- Gkouvatsos K., Papanikolaou G., Pantopoulos K. (2012). Regulation of iron transport and the role of transferrin. Biochimicaetbiophysicaacta, 1820(3), 188–202. https://doi.org/10.1016/j.bbagen.2011.10.013
- Guardia Clausi M., Paez P. M., Campagnoni A. T., Pasquini L. A., Pasquini J. M. (2012). Intranasal administration of aTf protects and repairs the neonatal white matter after a cerebral hypoxic-ischemic event. Glia, 60(10), 1540–1554. https://doi.org/10.1002/glia.22374
- Guardia Clausi M., Pasquini L. A., Soto E. F., Pasquini J. M. (2010). Apotransferrin-induced recovery after hypoxic/ischaemic injury on myelination. ASN neuro, 2(5), e00048. https://doi.org/10.1042/an20100020
- Hoyle C., Henderson D. J., Matthews D. J., Copp A. J. (1996). Transferrin and its receptor in the development of genetically determined neural tube defects in the mouse embryo. Developmental Dynamics, 207(1), 35–46. https://doi.org/10.1002/(SICI)1097-0177(199609)207:13.0.CO;2-X
- Ji C., Kosman D. J. (2015). Molecular mechanisms of non-transferrin-bound and transferring-bound iron uptake in primary hippocampal neurons. Journal of Neurochemistry, 133(5), 668–683. https://doi.org/10.1111/jnc.13040
- Jorgenson L. A., Wobken J. D., Georgieff M. K. (2003). Perinatal iron deficiency alters apical dendritic growth in hippocampal CA1 pyramidal neurons. Developmental Neuroscience, 25(6), 412–420. https://doi.org/10.1159/000075667
- Kelly B. T., Owen D. J. (2011). Endocytic sorting of transmembrane protein cargo. Current Opinion in Cell Biology, 23(4), 404–412. https://doi.org/10.1016/j.ceb.2011.03.004
- Levina A., Pham T. H., Lay P. A. (2016). Binding of chromium(III) to transferrin could be involved in detoxification of dietary chromium(III) rather than transport of an essential trace element. AngewandteChemie (International ed in English), 55(28), 8104–8107. https://doi.org/10.1002/anie.201602996
- Little D., Luft C., Mosaku O., Ketteler R., Devine M. J., Gissen P. (1994). High-content autophagy analysis in iPSC-derived neurons using immunofluorescence. Methods in Molecular Biology, 165–174. https://doi.org/10.1007/978-1-4939-9477-9_15
- Liu D. J., Hammer D., Komlos D., Chen K. Y., Firestein B. L., Liu A. Y. (2014). SIRT1 Knockdown promotes neural differentiation and attenuates the heat shock response. Journal of Cellular Physiology, 229(9), 1224–1235. https://doi.org/10.1002/jcp.24556
- Malecki E. A., Devenyi A. G., Beard J. L., Connor J. R. (1999). Existing and emerging mechanisms for transport of iron and manganese to the brain. Journal of Neuroscience Research, 56(2), 113–122. https://doi.org/10.1002/(SICI)1097-4547(19990415)56:2<113::AID-JNR1>3.0.CO;2-K
- Marta C. B., Escobar Cabrera O. E., Garcia C. I., Villar M. J., Pasquini J. M., Soto E. F. (2000). Oligodendroglial cell differentiation in rat brain is accelerated by the intracranial injection of apotransferrin. Cellular and Molecular Biology (Noisy-le-Grand, France), 46(3), 529–539.
- Marta C. B., Paez P., Lopez M., Pellegrino de Iraldi A., Soto E. F., Pasquini J. M. (2003). Morphological changes of myelin sheaths in rats intracranially injected with apotransferrin. Neurochemical Research, 28(1), 101–110. https://doi.org/10.1023/A:1021604413737
- McCarthy K. D., de Vellis J. (1980). Preparation of separate astroglial and oligodendroglial. The Journal of Cell Biology, 85(3), 890–902. https://doi.org/10.1083/jcb.85.3.890
- Ménager C., Nariko A., Yuko F., Kozo K. (2004). PIP3 is involved in neuronal polarization and axon formation. Journal of Neurochemistry, 89(1), 109–118. https://doi.org/10.1046/j.1471-4159.2004.02302.x
- Mochizuki Y., Furukawa K. (1987). Application of coomassie brilliant blue staining to cultured hepatocytes. Cell Biology International Reports, 11(5), 367–371. https://doi.org/10.1016/0309-1651(87)90003-8
- Moos T. (1996). Immunohistochemical localization of intraneuronal transferrin receptor immunoreactivity in the adult mouse central nervous system. The Journal of Comparative Neurology, 375(4), 675–692. https://doi.org/10.1002/(SICI)1096-9861(19961125)375:4<675::AID-CNE8>3.0.CO;2-Z
- Moos T., Morgan E. H. (2000). Transferrin and transferrin receptor function in brain barrier systems. Cellular and Molecular Neurobiology, 20(1), 77–95. https://doi.org/10.1023/A:1006948027674
- Moos T., Rosengren Nielsen T., Skjorringe T., Morgan E. H. (2007). Iron trafficking inside the brain. Journal of Neurochemistry, 103(5), 1730–1740. https://doi.org/10.1111/j.1471-4159.2007.04976.x
- Morris C. M., Candy J. M., Keith A. B., Oakley A. E., Taylor G. A., Pullen R. G., Bloxham C. A., Gocht A., Edwardson J. A. (1992). Brain iron homeostasis. Journal of Inorganic Biochemistry, 47(3-4), 257–265. https://doi.org/10.1016/0162-0134(92)84071-T
- Mosmann T. (1983). Rapid colorimetric assay for cellular growth and survival: Application to proliferation and cytotoxicity assays. Journal of Immunological Methods, 65(1-2), 55–63. https://doi.org/10.1016/0022-1759(83)90303-4
- Musa H., Veenstra R. D. (2003). Voltage-dependent blockade of connexin40 gap junctions by spermine. Biophysical Journal, 84(1), 205–219. https://doi.org/10.1016/s0006-3495(03)74843-7
- Nakamura Y., Hashimoto R., Amano M., Nagata K., Matsumoto N., Goto H., Fukusho E., Mori H., Kashiwagi Y., Kudo T., Inagaki M., Takeda M. (2000). Localized phosphorylation of vimentin by rho-kinase in neuroblastoma N2a cells. Genes to Cells: Devoted to Molecular & Cellular Mechanisms, 5(10), 823–837. https://doi.org/10.1046/j.1365-2443.2000.00372.x
- Olmsted J. B., Carlson K., Klebe R., Ruddle F., Rosenbaum J. (1970). Isolation of microtubule protein from cultured mouse neuroblastoma cells. Proceedings of the National Academy of Sciences of the United States of America, 65(1), 129–136. https://doi.org/10.1073/pnas.65.1.129
- Paez P. M., Garcia C. I., Davio C., Campagnoni A. T., Soto E. F., Pasquini J. M. (2004). Apotransferrin promotes the differentiation of two oligodendroglial cell lines. Glia, 46(2), 207–217. https://doi.org/10.1002/glia.20001
- Paez P. M., Marta C. B., Moreno M. B., Soto E. F., Pasquini J. M. (2002). Apotransferrin decreases migration and enhances differentiation of oligodendroglial progenitor cells in an in vitro system. Developmental Neuroscience, 24(1), 47–58. https://doi.org/10.1159/000064945
- Park M. J., Lee S. K., Lim M. A., Chung H. S., Cho S. I., Jang C. G., Lee S. M. (2006). Effect of alpha-tocopherol and deferoxamine on methamphetamine-induced neurotoxicity. Brain Research, 1109(1), 176–182. https://doi.org/10.1016/j.brainres.2006.06.030
- Perez M. J., Fernandez N., Pasquini J. M. (2013). Oligodendrocyte differentiation and signaling after transferrin internalization: A mechanism of action. Experimental Neurology, 248, 262–274. https://doi.org/10.1016/j.expneurol.2013.06.014
- Riemer J., Hoepken H. H., Czerwinska H., Robinson S. R., Dringen R. (2004). Colorimetric ferrozine-based assay for the quantitation of iron in cultured cells. Analytical Biochemistry, 331(2), 370–375. https://doi.org/10.1016/j.ab.2004.03.049
- Rosato-Siri M. V., Badaracco M. E., Ortiz E. H., Belforte N., Guardia Clausi M., Soto E. F., Bernabeu R., Pasquini J. M. (2010). Oligodendrogenesis in iron-deficient rats: Effect of apotransferrin. Journal of Neuroscience Research, 88, 1695–1707. https://doi.org/10.1002/jnr.22348
- Rossi F., Cattaneo E. (2002). Neural stem cell therapy for neurological diseases: Dreams and reality. Nature Reviews Neuroscience, 3(5), 401–409. https://doi.org/10.1038/nrn809
- Saleh M. C., Espinosa de los Monteros A., de Arriba Zerpa G. A., Fontaine I., Piaud O., Djordjijevic D., Baroukh N., Garcia Otin A. L., Ortiz E., Lewis S., Fiette L., Santambrogio P., Belzung C., Connor J. R., de Vellis J., Pasquini J. M., Zakin M. M., Baron B., Guillou F. (2003). Myelination and motor coordination are increased in transferrin transgenic mice. Journal of Neuroscience Research, 72(5), 587–594. https://doi.org/10.1002/jnr.10619
- Sarina Yagi Y., Nakano O., Hashimoto T., Kimura K., Asakawa Y., Zhong M., Narimatsu S., Gohda E. (2013). Induction of neurite outgrowth in PC12 cells by artemisinin through activation of ERK and p38 MAPK signaling pathways. Brain Research, 1490, 61–71. https://doi.org/10.1016/j.brainres.2012.10.059
- Shi S. H., Jan L. Y., Jan Y. N. (2003). Hippocampal neuronal polarity specified by spatially localized MPar3/MPar6 and PI 3-kinase activity. Cell, 112(1), 63–75. https://doi.org/10.1016/s0092-8674(02)01249-7
- Sriramoju B., Kanwar R. K., Kanwar J. R. (2015). Lactoferrin induced neuronal differentiation: A boon for brain tumours. International Journal of Developmental Neuroscience: The Official Journal of the International Society for Developmental Neuroscience, 41, 28–36. https://doi.org/10.1016/j.ijdevneu.2014.12.005
- Tsutsumi M., Skinner M. K., Sanders-Bush E. (1989). Transferrin gene expression and synthesis by cultured choroid plexus epithelial cells. Regulation by serotonin and cyclic adenosine 3′,5′-monophosphate. The Journal of Biological Chemistry, 264(16), 9626–9631. https://doi.org/10.1016/S0021-9258(18)60576-9
- Waetzig V., Herdegen T. (2003). The concerted signaling of ERK1/2 and JNKs is essential for PC12 cell neuritogenesis and converges at the level of target proteins. Molecular and Cellular Neurosciences, 24(1), 238–249. https://doi.org/10.1016/S1044-7431(03)00126-X
- Wang J., Wang J., Song W., Yang X., Zong W., Liu R. (2016). Molecular mechanism investigation of the neutralization of cadmium toxicity by transferrin. Physical Chemistry Chemical Physics: PCCP, 18(5), 3536–3544. https://doi.org/10.1039/c5cp06100h
- Wang X., Wang Z., Yao Y., Li J., Zhang X., Li C., Cheng Y., Ding G., Liu L., Ding Z. (2011). Essential role of ERK activation in neurite outgrowth induced by alpha-lipoic acid. Biochimicaetbiophysicaacta, 1813(5), 827–838. https://doi.org/10.1016/j.bbamcr.2011.01.027
- Yarwood R. E., Imlach W. L., Lieu T. M., Veldhuis N. A., Jensen D. D., Herenbrink C. K., Aurelio L., Cai Z., Christie M. D. J., Poole D. P., Porter C. J. H., McLean P., Hicks G. A., Geppetti P., Halls M. L., Canals M., Bunnett N. W. (2017). Endosomal signaling of the receptor for calcitonin gene-related peptide mediates pain transmission. Proceedings of the National Academy of Sciences of the United States of America, 114(46), 12309–12314. https://doi.org/10.1073/pnas.1706656114