Abstract
Background and objective: Diabetes mellitus (DM) has been considered as a ‘prothrombotic state’ with enhanced platelet reactivity. Mean platelet volume (MPV) has been evaluated in DM and correlated with retinopathy. This study was aimed at evaluating platelet indices in diabetic versus non‐diabetic patients and assessing their utility as indicators of presence of complications in patients with DM.
Methods: This study included 75 subjects with DM (50 with one or more microvascular complications) and 50 non‐selected patients from the hospital as controls. Anticoagulated blood (ethylene diamine tetracetic acid) was collected and analyzed in an automated blood cell counter for platelet count and indices [MPV, platelet distribution width (PDW) and platelet‐large cell ratio].
Results: MPV, PDW and platelet‐large cell ratio were all significantly higher in diabetic patients compared to the control subjects (P<0·05 for all). Among the diabetics, PDW was higher in those with complications as compared to those without (P = 0·006). On stepwise discriminant analysis using age, duration of diabetes, platelet count and platelet indices, ∼78·6% of patients with diabetic complications were accurately classified. Interestingly, only two input variables (PDW and MPV) qualified for the final discriminant model.
Conclusion: Platelet indices, especially PDW, are different between diabetics and controls as well as between diabetics with and without microvascular complications. Discriminant analysis using PDW and MPV could classify majority of patients with diabetic complications.
Introduction
Diabetes mellitus (DM) has been recognized as a ‘prothrombotic tendency’ with increased platelet reactivity. This enhanced reactivity has been postulated to play a role in the microvascular complications of diabetes.Citation1 Among platelet indices, mean platelet volume (MPV) reflects changes in either platelet stimulation or the rate of platelet production. Platelet distribution width (PDW) is a measure of platelet heterogeneity, which in turn may be due to aging of platelets or heterogeneous demarcation of megakaryocytes. The third platelet index, platelet‐large cell ratio (P‐LCR) is the measure of larger platelets.Citation2 MPV has been evaluated in few studies in diabetic patients. Increase in MPV has been demonstrated in metabolic syndrome, stroke and diabetes.Citation3 Higher MPV values have recently been shown in patients with proliferative diabetic retinopathy.Citation4 Since microvascular complications of DM are important causes of morbidity and health care costs, early indication of the presence of such complications would help in reducing these adverse events.
The present study was aimed at evaluating the platelet indices in patients with diabetes and comparing them with healthy controls. At the same time, an attempt has been made to assess the difference in these indices between diabetics with and without complications. Discriminant analysis was performed on our study subjects to evaluate the utility of certain features in being indicators of diabetic microvascular complications.
Materials and Methods
This study included 75 patients with type 2 DM as the ‘study group’ and 50 non‐diabetic patients from the outpatient department of our hospital as controls for comparison. Patients with abnormal hematocrit and/or abnormal platelet number were excluded from the study. Diagnosis of DM was established using the American Diabetes Association criteria of fasting blood glucose level of ⩾126 mg/dl and/or 2 hours post‐prandial blood glucose of ⩾140 mg/dl on two occasions. Control subjects had a blood glucose level of <110 mg/dl. The group of diabetic patients was divided into those without complications (25 patients) and those with one or more of the three microvascular complications, i.e. retinopathy, nephropathy or neuropathy (50 patients).
Detailed clinical history, with special emphasis on symptoms related to complications of DM, was elicited in the study group. A thorough clinical examination and relevant clinical investigations were conducted for detection of diabetic complications in the study group. Retinopathy was defined as presence of at least two microaneurysms and/or retinal hemorrhage.Citation5 Diabetic nephropathy was defined as microalbuminuria (30–300 mg/24 hours urinary protein excretion) or macroalbuminuria. Neuropathy was diagnosed based on clinical symptoms of hyperesthesia/paresthesia/motor weakness or polyradiculopathy. Of the 75 patients with DM, 66 were being treated with oral hypoglycemics, four patients were receiving injectable insulin while five recently diagnosed cases were not on therapy.
For platelet count and indices, 2 ml of venous blood was collected directly in an ethylene diamine tetracetic acid vacutainer in sitting position from antecubital vein and analyzed after exactly 2 hours in an automated blood cell counter (Sysmex SF 3000; Transasia, Mumbai, Inida). At the same time, blood was collected and analyzed for fasting and post‐prandial blood glucose levels. Routine haematological investigations, including peripheral smear analysis were performed for all the patients included in the study.
Appropriate statistical tests were applied to assess the significance of difference between groups. For data with normal distribution, Student’s t‐test was applied to assess the significance of difference otherwise Mann–Whitney test was used. In this study, stepwise discriminant function was used. Wilks’ lambda of individual variable was used as entry (partial F 3·84)/removal (partial F 2·71) criteria. Overall model’s Wilks’ lambda was noted and chi‐square was used to determine its significance.
Results
Patient characteristics
The mean age of diabetic patients without complications was 52·13 years (±10·3 years), compared to 51·4 years (±12·5 years) in the group with complications and 48·12 years (±13·69 years) in control subjects. There was no statistical difference in age between diabetic subjects and controls (P = 0·122, t‐test for equality of means) as well as between diabetic subjects with and without complications (P = 0·803, t‐test for equality of means). There was an incidental female predominance in both groups (male/female: 1∶2·3 in controls and 1∶2·88 in diabetic patients). Of the 75 patients with diabetes, 50 (66·67%) had one or more microvascular complications, including peripheral neuropathy, retinopathy and nephropathy. The fasting and post‐prandial blood glucose levels in diabetic patients without complications were 189·5±96·6 and 308·67±144·7 mg/dl, respectively. In the group with diabetic complications, the fasting and post‐prandial blood glucose levels were 198·24±103·6 and 307·36±145·7 mg/dl, respectively. There was no significant difference in the blood glucose levels of these two groups (P>0·05, t‐test for equality of means). The corresponding blood glucose levels in control subjects were within reference ranges.
The systolic and diastolic blood pressures were 112±10 and 74·7±8·5 mmHg, respectively in control subjects compared to 129·8±10 and 84·5±7 mmHg in diabetic patients without complications and 129·4±13 and 85±7·5 mmHg in diabetics with complications. On statistical analysis, the difference between the control subjects and the diabetic group was significant (P<0·05, t‐test for equality of means), though no significant difference was found between diabetics with and without complications (P>0·05).
The duration of diabetes (i.e. months after diagnosis till the time of inclusion in study) in the subjects without complications was 56·5 months (±79·12 months), compared to 82·26 months (±78·53 months) in patients with vascular complications of DM. The difference in the duration of diabetes was statistically significant (P = 0·03, Mann–Whitney test).
Platelet indices
The platelet counts were comparable in the controls and diabetic patients [229·52(±65·80)×103/μl and 229·33(±70·27)×103/μl, respectively] with a P value of 0·99 (t‐test for equality of means). All the three platelet indices were higher in the study group (diabetes) compared to the controls, as tabulated in and depicted in .
Figure 1. Peripheral smear from a patient with diabetic complication showing occasional giant platelets (arrow) with normocytic normochromic erythrocytes (Giemsa, ×100).
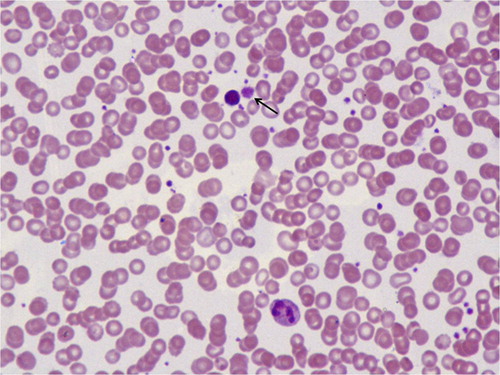
Table 1. Platelet indices in controls and patients with DM
The platelet indices were also compared between diabetic patients with microvascular complications to those without, as tabulated in .
Table 2. Platelet indices in DM patients with and without complications
On statistical analysis, only PDW was significantly higher in diabetic patients with complications compared to patients without complications while the other two platelet indices, though higher in patients with complications, were not significantly different.
Prediction of diabetic vascular complications
Discriminant analysis was performed taking presence and absence of vascular complications in subjects with DM as the outcome variable, as shown in . Age of the patient, duration of DM, platelet count, MPV, PDW and P‐LCR were taken as input variables. At the last step of analysis, only two variables were present in the model obtained. Variables selected were PDW (P = 0·006) and MPV (P = 0·000). The overall Wilks’ lambda of the model was 0·773 with an overall significance of the model P = 0·000 (chi‐square). When all the subjects were taken, 77·3% were correctly classified to one or the other category using these input variables. Of the group of diabetics with microvascular complications, 78·6% were correctly classified by this method.
Figure 2. Result of discriminant analysis. Values of discriminant function (x‐axis) were plotted against the number of cases (y‐axis) in each category (black: diabetics without complications; grey: diabetics with complications). Fair separation of both the groups is evident from graph.

Discussion
DM is a ‘prothrombotic state’ associated with accelerated atherosclerosis and inflammation. Patients with diabetes, particularly those with type 2 DM, have been shown to exhibit increasing platelet reactivity. This has been attributed to both insulin resistance and insulin deficiency. Insulin has been shown to antagonize the effect of platelet agonists like collagen, adenosine diphosphate, epinephrine and platelet activating factor.Citation6 Hyperglycemia contributes to heightened platelet reactivity directly as well as through glycation of platelet proteins. In addition, hypertriglyceridemia also increases platelet reactivity.Citation7 Enhanced platelet aggregation has been implicated in the development of micro‐ and macrovascular disease in patients with DM.Citation1 A study involving uncomplicated insulin‐dependent diabetic patients concluded that platelet function abnormalities were absent in diabetic patients without clinical evidence of vascular disease.Citation8
There have been few studies in the available literature on platelet indices in patients with DM. An increase in MPV has been documented in patients with metabolic syndrome, stroke and DM.Citation3 Increased MPV has also been shown to be an independent risk factor for myocardial infarction, cerebral ischemia and transient ischemic attack.Citation9–Citation11 In earlier studies, MPV was found to be significantly higher in diabetic patients and it was hypothesized that platelets with altered morphology are likely to be associated with increased risk of vascular complications in diabetes.Citation12,Citation13 Larger platelets contain more dense granules and hence are more potent and thrombogenic. A recent study evaluated the association of MPV with the degree of diabetic retinopathy. In this study, patients with proliferative diabetic retinopathy had higher MPV values as compared to controls, though there was no significant difference between non‐complicated diabetes, non‐proliferative diabetic retinopathy and proliferative retinopathy.Citation4 In the present study also, MPV was significantly higher in diabetic patients compared to controls (P = 0·015). In addition, other platelet indices (PDW and P‐LCR) were also higher in diabetic subjects as compared to controls (P = 0·002 and 0·004, respectively). The effect of platelet count on these platelet indices was ruled out, since platelet counts were similar in both the groups.
An occasional earlier study has shown higher MPV values in diabetic patients with retinopathy or other complications.Citation12 In contrast to the earlier study, MPV was not significantly different between diabetic patients with and without complications in our study. However, an interesting finding in the present study was the highly significant difference in PDW in diabetic patients with complications compared to uncomplicated diabetes. In addition to this, we attempted to perform discriminant analysis including age, duration of diabetes, platelet count and the three platelet indices. Our results indicate that such a discriminant analysis can accurately classify ∼78·6% of diabetic patients with complications at presentation. These results are encouraging in that these factors may act as indicators of microvascular complications in diabetic patients. This is particularly important because: (1) these indices are conveniently obtained from automated cell counters; (2) microvascular complications of diabetes are significant causes of morbidity in diabetics and are usually detected quite late in the course of disease; (3) early indication of the presence of one of the complications would go a long way in reducing the morbidity and health care costs in patients with diabetes.
In conclusion, the present study again highlights the significant differences in platelet indices in diabetics compared to control subjects. Also, PDW was significantly higher in diabetics with complications than those without complications. Discriminant analysis, used for the first time in such a study, showed that age, duration of diabetes and platelet indices can indicate the presence of complications in majority of the diabetics.
References
- Koltai K, Feher G, Kesmarky G, Keszthelyi Z, Czopf L, Toth K. The effect of blood glucose levels on hemorheological parameters, platelet activation and aggregation in oral glucose tolerance tests. Clin Hemorheol Microcirc 2006;35:517–25.
- Borkataky S, Jain R, Gupta R, Singh S, Gupta K, Kudesia M. Role of platelet volume indices in the differential diagnosis of thrombocytopenia: a simple and inexpensive method. Hematology 2009;14:182–6.
- Tavil Y, Sen N, Yazici HU, Hizal F, Abaci A, Cengel A. Mean platelet volume in patients with metabolic syndrome and its relationship with coronary artery disease. Thromb Res 2007;120:245–50.
- Ates O, Kiki I, Bilen H, Keles M, Kocer I, Kulacoglu DN, et al.. Association of mean platelet volume with the degree of retinopathy in patients with diabetes mellitus. Eur J Gen Med 2009;6:99–102.
- Fong DS, Aiello L, Gardner TW, King GL, Blankenship G, Cavallerano JD, et al.. Diabetic retinopathy. Diabetes Care 2003;26(Suppl 1):S99–102.
- Westerbacka J, Yki-Jarvinen H, Turpeinen A, Rissanen A, Vehkavaara S, Syrjala M, et al.. Inhibition of platelet-collagen interaction: an in vivo action of insulin abolished by insulin resistance in obesity. Arteroscler Thromb Vasc Biol 2002;22:167–72.
- Schneider DJ. Factors contributing to increased platelet reactivity in people with diabetes. Diabetes Care 2009;32:525–7.
- Hendra TJ, Oughton J, Smith CC, Betteridge DJ, Yudkin JS. Platelet function in uncomplicated insulin-dependent diabetes patients at rest and following exercise. Diabetes Med 1988;5:469–73.
- Khandekar MM, Khurana AS, Deshmukh SD, Kakrani AL, Katdare AD, Inamdar AK. Platelet volume indices in patients with coronary artery disease and acute myocardial infarction: an Indian scenario. J Clin Pathol 2006;59:146–9.
- Kilicli-Camur N, Demirtunc R, Koruralp C, Eskiser A, Basaran Y. Could mean platelet volume be a predictive marker for acute myocardial infarction? Med Sci Monit 2005;11:CR387–92.
- O’Malley T, Langhorne P, Elton RA, Stewart C. Platelet size in stroke patients. Stroke 1995;26:995–9.
- Papanas N, Symeonidis G, Maltezos E, Mavridis G, Karavageli E, Vosnakidis T, et al.. Mean platelet volume in patients with type 2 diabetes mellitus. Platelets 2004;15:475–8.
- Hekimsoy Z, Payzin B, Ornek T, Kandogan G. Mean platelet volume in Type 2 diabetic patients. J Diabetes Complicat 2004;18:173–6.