Abstract
It is accepted that cancer chemoresistance may be due to overexpression of antiapoptotic proteins or P‐gp. This study investigated the effect of downregulation of X‐chromosome‐linked inhibitor of apoptosis (XIAP) and of simultaneous downregulation of XIAP and P‐gp on sensitivity to imatinib. The K562 and K562Dox (P‐gp overexpressing) chronic myeloid leukemia cell lines were used and downregulation of target proteins was achieved with siRNAs. Targeting XIAP moderately enhanced sensitivity to imatinib in both cell lines. Simultaneous targeting of XIAP and P‐gp further enhanced sensitivity to imatinib in the resistant K562Dox cells. In conclusion, simultaneous targeting of P‐gp and XIAP increases sensitivity of P‐gp overexpressing chronic myeloid leukemia cells to imatinib.
Keywords:
Introduction
Chronic myeloid leukemia (CML) is characterized by a translocation between chromosomes 9 and 22, giving rise to the chimeric gene, BCR‐ABL, that produces a fusion protein BCR‐ABL in which ABL tyrosine kinase activity is constitutively activated.Citation1 This increases proliferation and decreases apoptosis.Citation2–Citation4
Imatinib mesylate (STI571) has recently emerged as a new molecular targeted therapy for CML. It is a selective tyrosine kinase inhibitor that binds the catalytic pocket of BCR‐ABL protein promoting growth arrest and apoptosis in cells that express this protein. However, cases of drug resistance have been described. In fact, several mechanisms may be responsible for drug resistance including point mutations, amplification of the BCR‐ABL gene,Citation5–Citation7 or overexpression of drug efflux transporters (such as P‐gp protein).Citation8–Citation10
Apoptosis is an important mechanism through which cytotoxic agents induce cell death (reviewed in Refs. 11 and 12). Indeed, alterations in some apoptotic proteins have been associated with drug resistance (reviewed in Ref. 13). For example, overexpression of members of the inhibitor of apoptosis proteins (IAP) family has been linked with resistance to doxorubicin, paclitaxel, or melphalan.Citation14,Citation15 X‐chromosome‐linked inhibitor of apoptosis (XIAP), the most potent member of the IAP family, is involved in the resistance to conventional chemotherapeutic drugs in a variety of cells including prostate,Citation16 colon,Citation17 or breast.Citation18 XIAP has also been shown to be involved in leukemia cellular resistance to doxorubicin, cytarabine, or etoposide.Citation19,Citation20 However, it is not known if XIAP is involved in the cellular resistance of CML to imatinib.
Even though overexpression of XIAP has been documented in resistant cancer cell lines and patients, it does not seem to be related to the mechanism of P‐gp overexpression.Citation21 Therefore, targeting XIAP and P‐gp simultaneously may be a good approach to revert some forms of resistance to imatinib. The aims of this work were: (1) to validate XIAP as a possible molecular target to increase sensitivity to imatinib in both a sensitive (K562) and a P‐gp overexpressing (resistant; K562Dox) CML cell line; (2) to verify if simultaneous downregulation of XIAP and P‐gp enhances sensitivity to imatinib in a P‐gp overexpressing (resistant; K562Dox) CML cell line.
Materials and Methods
Cell lines
Two CML cell lines were used in this study, K562 (European Collection of Cell Cultures, Salisbury, UK) and K562Dox (a kind gift from Professor JP Marie, Paris, France). K562 and K562Dox were both cultured in Roswell Park Memorial Institute 1640 medium (GIBCO; Invitrogen, Paisley, UK) with 10% fetal bovine serum (FBS). Cells were maintained at 37°C in a humidified atmosphere containing 5%CO2. The K562Dox cell line was previously obtained by others, by selection of the K562 cell line after exposure to doxorubicin. To preserve P‐gp expression in the K562Dox cell line, 1 μM doxorubicin was added to the cells every 2 weeks. All experiments with K562Dox cell line were performed 6 days after doxorubicin was added to the cells, in order to maintain the same P‐gp expression levels throughout the experiments.
Cellular viability and concentration were determined by the trypan blue exclusion assay.
Antibodies and reagents
Anti‐P‐gp mAb (F4 clone) was purchased from Sigma (Dorset, UK), anti‐XIAP Ab from Cell Signalling Technology (Danvers, MA, USA) and anti‐caspase‐3mAb (clone 4‐1‐18) from Upstate Biotechnology (Lake Placid, NY, USA). Anti‐actin Ab, goat anti‐mouse IgG‐horseradish peroxidase (IgG‐HRP), goat anti‐rabbit IgG‐HRP, and donkey anti‐goat IgG‐HRP were from Santa Cruz Biotechnology (Heidelberg, Germany). imatinib was kindly provided by Novartis Inc. (Basel, Switzerland). Verapamil (Sigma) was used at a concentration of 3 μM.
siRNAs
Three different siRNAs were used. Two of them targeted different sites of XIAP mRNA and the other targeted the MDR1 mRNA. The siRNAs targeting XIAP were denominated XIAPseq1 and XIAPseq2 and had the following sequences: XIAPseq1: sense – 5′GGA GAU ACC GUG CGG UGC UdTdT3′ and antisense – 5′AGC ACC GCA CGG UAU CUC CdTdT3′;Citation18 XIAPseq2: sense – 5′GUG GUA GUC CUG UUU CAG CdTdT3′ and antisense – 5′GCU GAA ACA GGA CUA CCA CdTdT3′. The multi‐drug resistant (MDR) siRNA, denominated MDR‐CR, had the following sequences: sense – 5′GGA AAA GAA ACC AAC UGU CdTdT3′ and antisense – 5′GAC AGU UGG UUU CUU UUC CdTdT3′.Citation10 A commercially available negative control siRNA was used with the following sequences: sense – 5′UUC UCC GAA CGU GUC ACG UdTdT3′ and antisense – 5′ACG UGA CAC GUU CGG AGA AdTdT3′.
All siRNAs were purchased from QIAGEN (Hilden, Germany) and resuspended in siRNA suspension buffer, according to the manufacturer’s instructions in order to obtain stock concentrations of 20 μM.
Transfection of K562 and K562Dox cells with siRNAs
K562 and K562Dox cells were transfected with the siRNAs using jetSITM reagent (Polyplus Transfection, Illkirch, France) according to the manufacturer’s instructions. All transfections were carried out under serum free medium conditions for the initial 4 hours using 200 nM of siRNAs (except for the double transfection with XIAPseq1 and MDR‐CR siRNAs and the respective control in which a total of 400 nM siRNAs were delivered to the cells).
Response of K562 and K562Dox cells to treatment with imatinib
Cells from both K562 and K562Dox cell lines were plated in 24‐well plates at 5×10⁵ cells/well in serum free medium (in order to maintain the conditions that were used in the experiments carried out following transfection of siRNAs) and incubated at 37°C in a humidified atmosphere containing 5%CO2 for 4 hours. Following this 4‐hour incubation, 400 μl of medium containing 25%FBS were added to each well, to obtain 10% final FBS concentration in the medium. imatinib mesylate (0·25, 0·5, 1, 2, 4, and 6 μM for K562 cells and 0·5, 1, 4, 6, 10, and 20 μM for K562Dox cells) was added to the cells 24 hours after plating.
In the experiments to investigate sensitization to imatinib after transfection with siRNAs, 1 μM imatinib was added 24 hours after cells were transfected (as described above). A control was included with the equivalent volume of solvent of the drug (water). Cellular viability and concentration were determined 48 hours later, with the trypan blue exclusion assay.
Programmed cell death was also studied in these cells, 48 hours after drug treatment, using the ‘in situ cell death detection kit’ (Roche, Basel, Switzerland). Briefly, cells were centrifuged and fixed in 4% paraformaldehyde solution. Cytospins were prepared, and cells were permeabilized (0·1% Triton X‐100 in 0·1% sodium citrate) and incubated with TUNEL reaction mix, according to manufacturer’s instructions (enzyme dilution 1∶20). Cells were observed in a DM IRE 2 microscope (Leica, Wetzlar, Germany) and a semi‐quantitative evaluation was performed by counting a minimum of 500 cells per slide.
Analysis of protein expression: XIAP and P‐gp
For the analysis of XIAP, P‐gp, and actin protein expression, cells were lysed for 20 minutes using Winman’s buffer (1% NP‐40, 0·1M Tris‐HCl pH 8·0, 0·15M NaCl, and 5 mM ethylenediaminetetraacetic acid [EDTA]) with EDTA‐free protease inhibitor cocktail (Boehringer Mannheim, Mannheim, Germany), quantified using a modified Bradford assay (Bio‐Rad Laboratories, Hemel Hempstead, UK), and separated in 8 or 12% acrylamide gels. Proteins were then transferred to a nitro‐cellulose membrane (Amersham Biosciences, Little Chalfont, UK).
Membranes were incubated with mouse monoclonal anti‐P‐gp antibody (1∶3000), rabbit anti‐XIAP antibody (1∶1000), or goat anti‐actin antibody (1∶2000). Secondary antibodies were then used (goat anti‐mouse IgG‐HRP, 1∶2000; goat anti‐rabbit IgG‐HRP, 1∶2000; donkey anti‐goat IgG‐HRP, 1∶2000) and the signal was detected with the ECL Amersham kit (GE, Chalfont St. Giles, UK) and the Kodak GBX developer and fixer (Sigma) as previously described.Citation22
Statistics
The results were statistically analyzed with the two‐tailed Student’s t‐test.
Results
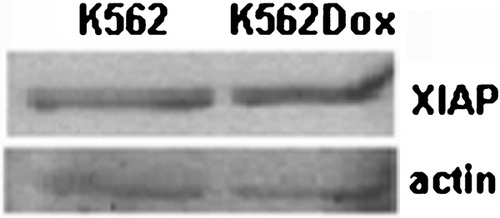
K562 and K562Dox cells were characterized in terms of XIAP protein expression. With that purpose, Western blots were carried out and results showed similar expression of XIAP in both cell lines (). Previous work by some of us had confirmed that P‐gp protein expression was only observed in K562Dox cells and that there was no difference in BCR‐ABL expression levels between the two cell lines.Citation10
Figure 1. XIAP expression levels in K562 and K562Dox cells. Both cell lines express similar levels of XIAP protein.
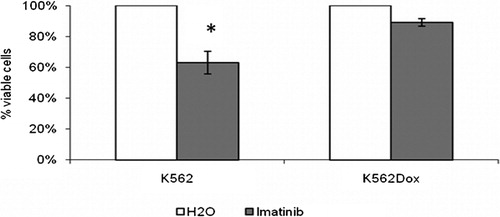
The response of K562 and K562Dox cells to imatinib was also characterized in terms of cellular viability. K562 cells showed more sensitivity to 1 μM of imatinib when compared to K562Dox cells. Appropriate controls were made with the drug’s solvent – water (). This is consistent with a previous study carried out by some of us, in which we had also confirmed that there is an increase in programmed cell death in K562 cells but not in K562Dox cells following 1 μM imatinib treatment.Citation10
Figure 2. Characterization of the response of K562 and K562Dox cells to imatinib. Response in terms of cell viability. Results are presented as % of viable cells when compared to the blank treatment (cells treated only with the solvent of imatinib – water). Results are mean±SE of eight experiments for K562 cells and of five experiments for K562Dox cells.
siRNAs were designed towards two different sequences of XIAP mRNA and both were tested in K562 cells in order to verify their efficiency in downregulating XIAP protein expression. With that purpose, Western blots were performed with proteins from K562 cells transfected with 200 nM siRNAs – a control siRNA (cRNAi) or the two different XIAP siRNAs (XIAPseq1 or XIAPseq2) – along a time‐course (24, 48, and 72 hours after transfection). Results showed a downregulation of XIAP expression with both XIAPseq1 and XIAPseq2 siRNAs at 48 hours after transfection. No major differences were observed at 24 and 72 hours after transfection (, panel A).
Figure 3. Downregulation of XIAP expression in K562 cells by RNAi and subsequent response to imatinib. (A) Analysis of XIAP protein expression by Western blot 24, 48, and 72 hours after transfection with control siRNA (cRNAi) or XIAP siRNAs (XIAPseq1 or XIAPseq2). (B) Effect of XIAP downregulation on sensitization of K562 cells to imatinib. Results are presented as % of the blank cells (treated with imatinib’s solvent – only water). Each group of columns refers to the treatment to which the cells were subjected before the drug was added (blank, cRNAi, XIAPseq1, and XIAPseq2). Columns in white represent the controls (treated with water); columns in grey represent cells treated with 1 μM imatinib. Results are mean±SE of four independent experiments for XIAPseq2, seven independent experiments for XIAPseq1, and eight independent experiments for blank and cRNAi. *Represents P⩽0·05 between treatments with imatinib and the respective controls treated with solvent; #represents P⩽0·05 between treatments with imatinib. (C) Dose‐response curve for imatinib in K562 cells transfected with siRNAs (cRNAi or XIAPseq1) or without transfection (blank). Results are presented as % of viable cells when compared to blank and are mean±SE of four independent experiments. (D) Programmed cell death in K562 cells treated with 1 μM imatinib following transfection with siRNAs (cRNAi or XIAPseq1) or without transfection (blank) analyzed by the TUNEL assay. Results were assessed 48 hours after imatinib was added to the cells. Results represent mean±SE of three independent experiments.
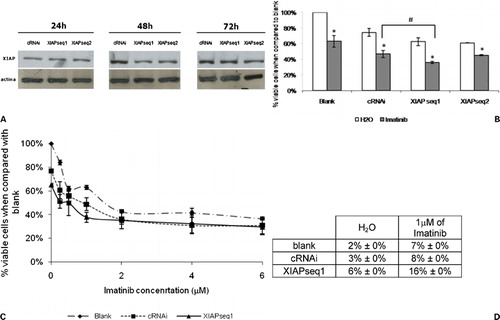
To determine if XIAP downregulation had an effect (on its own) on cellular viability and (when combining XIAP downregulation with imatinib treatment) on the sensitivity of cells to imatinib, the % of viable cells was determined 48 hours following drug treatment (i.e. 72 hours after transfection with cRNAi or siRNAs XIAPseq1 or XIAPseq2). The downregulation of XIAP expression, on its own, caused a decrease in the viable K562 cell number, from 100% in the blank cells to 62% in the K562 XIAPseq1 treated cells. Concomitant treatment with both XIAPseq1 siRNA and imatinib further reduced the % of viable cells to 36% compared to 47% in the cRNAi and imatinib treated cells. This difference was considered statistically significant (, panel B). The reduction in the number of viable cells verified with the cRNAi, when compared to the blank treatment, was believed to be due to cytotoxicity of the siRNAs, i.e. a non‐specific effect.
No significant sensitization to imatinib was observed with XIAPseq2 siRNA when compared to cRNAi, therefore the following work was performed using the XIAPseq1 siRNA only.
A dose‐response analysis of K562 cells treated with increasing concentrations of imatinib was carried out, to confirm sensitization to imatinib following downregulation of XIAP. At low imatinib concentrations, there was a slight shift of the dose‐response curve of the cells treated with XIAPseq1 siRNA to the left, further indicating an increase in sensitivity to imatinib. However, there was no alteration of the IC50 of imatinib (, panel C).
To clarify if the reduction in the number of viable cells upon transfection of K562 cells with XIAPseq1 siRNA and treatment with imatinib was due to an increase in programmed cell death, cells were analyzed by the TUNEL assay 48 hours after drug treatment (, panel D). There were no differences in the % of cells undergoing programmed cell death between cells transfected with cRNAi and the blank cells. However, cells with downregulation of XIAP expression (treated with XIAPseq1 siRNA) presented a significant increase in programmed cell death, further augmented when using concomitant treatment with 1 μM imatinib.
To verify if the selected XIAP siRNA (XIAPseq1) was also effective in reducing XIAP expression in K562Dox cells, Western blots were performed with proteins from K562Dox cells treated with 200 nM of siRNAs – the control siRNA (cRNAi) or the XIAP siRNA (XIAPseq1) – along a time‐course (24 and 48 hours following transfection). Results showed no alteration in XIAP levels 24 hours after transfection but there was a consistent downregulation of XIAP expression 48 hours after transfection (, panel A).
Figure 4. Downregulation of XIAP or P‐gp expression in K562Dox cells by RNAi and subsequent response to imatinib. (A) Analysis of XIAP protein expression by Western blot 24 and 48 hours after transfection with control siRNA (cRNAi) or XIAP siRNAs (XIAPseq1) and analysis of P‐gp protein expression 24 hours after transfection with control siRNA (cRNAi) or MDR siRNA (MDR‐CR). (B) Effect of XIAP downregulation on sensitization of K562Dox cells to imatinib. Results are presented as % of the blank cells (treated with imatinib’s solvent – water). Each group of columns refers to the treatment to which the cells were subjected before the drug was added (blank, cRNAi, and XIAPseq1). Columns in white represent the controls (treated with water); columns in grey represent the cells treated with 1 μM of imatinib. Results are mean±SE of five independent experiments. *Represents P⩽0·05 between treatments with imatinib and the respective controls treated with solvent; #represents P⩽0·05 between treatments with imatinib. (C) Dose‐response curve for imatinib in K562Dox cells transfected with siRNAs (cRNAi or XIAPseq1) or without transfection (blank). Results are presented as % of viable cells when compared to blank without imatinib. Results are mean±SE of three independent experiments. (D) Effect of P‐gp downregulation on sensitization of K562Dox cells to imatinib using either siRNA – MDR‐CR – or a P‐gp inhibitor – verapamil. Results are presented as % of the blank. Each group of columns refers to the treatment to which the cells were subjected before the drug was added (blank, VP, or MDR‐CR). Columns in white represent the controls (treated with water); columns in grey represent cells treated with 1 μM of imatinib. Results are mean±SE of three independent experiments. *Represents P⩽0·05 between treatments with imatinib and the respective controls treated with solvent; #represents P⩽0·05 between treatments with imatinib. (E) Programmed cell death in K562Dox cells treated with 1 μM of imatinib following transfection with siRNAs (cRNAi, XIAPseq1 or MDR‐CR) or without transfection (blank) analyzed by the TUNEL assay. Results were obtained 48 hours after imatinib was added to the cells. Results represent mean±SE of three independent experiments.
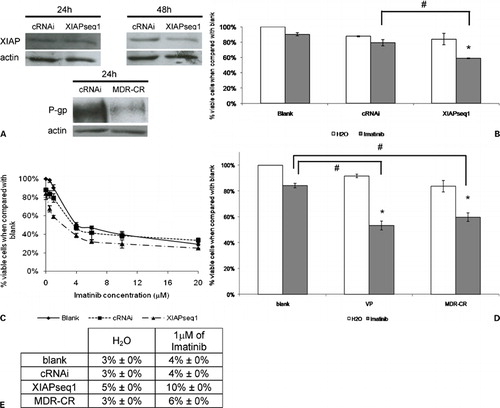
To study the involvement of both XIAP and P‐gp in resistance to imatinib, an siRNA intending to decrease P‐gp expression, previously designed and tested by some of us,Citation10 was also transfected into K562Dox cells. Proteins from K562Dox cells treated with 200 nM of this siRNA (MDR‐CR) or with a control siRNAs (cRNAi) were analyzed by Western blot. As shown in (panel A), a consistent decrease in P‐gp expression was confirmed 24 hours after transfection.
Downregulation of XIAP expression, on its own, decreased the % of viable cells from 100% (in the blank K562Dox cells) to 81% in XIAP‐siRNA treated cells (, panel B). Downregulation of P‐gp expression on its own also reduced the viable cell number from 100% in the blank cells to 81% in the P‐gp‐siRNA treated cells (, panel D).
To determine whether XIAP downregulation had any effect on the sensitivity of K562Dox cells to imatinib, viable cells were counted 48 hours after drug treatment (72 hours after transfection with either cRNAi or XIAPseq1 siRNA). Results showed a significant reduction in the number of viable cells following concomitant treatment with XIAPseq1 siRNA and imatinib, when compared to cells transfected with cRNAi and treated with imatinib. The reduction in the % of viable XIAPseq1 treated cells was to 56% of blank while cRNAi treated cells were only reduced to 75% of blank (, panel B). A dose‐response curve of K562Dox cells to increasing concentrations of imatinib was also carried out, to verify the IC50 of imatinib in blank cells or in cells previously treated with cRNAi, or XIAPseq1 siRNA. Results showed a clear shift to the left of the curve representing the XIAPseq1 siRNA treated cells, when compared to the curve representing the cRNAi siRNA treated cells. Accordingly, a decrease in the IC50 of imatinib from ∼4·25 to 3·25 μM was verified (, panel C).
To determine if P‐gp downregulation had an effect on K562Dox cells sensitivity to imatinib, K562Dox cells were treated with a siRNA for P‐gp – MDR‐CR – or with a P‐gp inhibitor – verapamil. Cells were counted 48 hours following drug treatment. Results indicated a significant decrease in the % of viable cell number following concomitant treatment with both verapamil or MDR‐CR siRNA and imatinib, when compared to K562Dox cells treated with imatinib on its own. Indeed, the % of viable cells was reduced to 60% of the blank cells, when cells were concomitantly treated with siRNA for P‐gp and imatinib. Accordingly, the % of viable cells was reduced to 52% when cells were concomitantly treated with verapamil and imatinib (, panel D).
Programmed cell death was analyzed with the TUNEL assay, in order to clarify if the reduction in the number of viable cells was due to this mechanism of cell death (, panel E). Cells transfected with cRNAi showed no differences in programmed mechanism of cell death when compared to blank. However, cells with P‐gp or XIAP downregulation presented increased programmed cell death following treatment with imatinib, when compared to the appropriate controls.
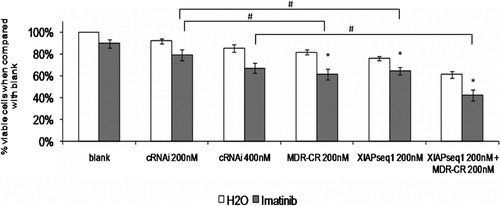
To determine if the simultaneous downregulation of XIAP and P‐gp further enhanced the sensitivity of K562Dox cells to imatinib, cells were transfected with the appropriate siRNAs and treated with imatinib. Viable cell number was evaluated 48 hours after drug treatment (72 hours after transfection). Results showed that the simultaneous downregulation of XIAP and P‐gp had a more pronounced effect on K562Dox cell sensitivity to 1 μM of imatinib (). Indeed, concomitant downregulation of both XIAP and P‐gp and further treatment with imatinib resulted in a decrease in viable cell number to 42% of blank cells.
Figure 5. Effect of simultaneous XIAP and P‐gp downregulation on sensitization of K562Dox cells to imatinib. Results are presented as % of the blank cells (treated with imatinib’s solvent – water). Each group of columns refers to the treatment to which the cells were subjected before the drug was added (blank, cRNAi 200 nM, cRNAi 400 nM, MDR‐CR 200 nM, XIAPseq1 200 nM or XIAPseq1 200 nM+MDR‐CR 200 nM). Columns in white represent the controls treated with water; columns in grey represent the cells treated with 1 μM of imatinib. Results are mean±SE of five independent experiments. *Represents P⩽0·01 between treatments with imatinib and the respective controls treated with solvent; #represents P⩽0·01 between treatments with imatinib.
Discussion
Apoptosis is an important mechanism in order to maintain cellular homeostasis and tissue development. It can be triggered by several stimuli such as DNA damage, chromosomal abnormalities, or oncogene activation. However, this cellular mechanism is often deregulated in cancer cells and is a well‐known cause of pharmacological resistance to drugs.Citation23,Citation24 Most often, this is due to overexpression of proteins from the Bcl‐2 familyCitation25,Citation26 or the IAP family.Citation24 For example, XIAP, the most potent member of the IAP family has been found to be overexpressed in renal cell carcinoma,Citation27 prostate cancer,Citation28 and melanoma.Citation29 Drug resistance can also be due to overexpression of P‐gp, a multi‐drug resistant protein, coded by the ABCB1 gene and which functions as an ATP‐dependent drug efflux pump for xenobiotic compounds.Citation23,Citation30 P‐gp has been reported as being particularly relevant in drug resistance in cases of leukemia.Citation31
Although it has been shown that drug resistance due to overexpression of P‐gp or overexpression of antiapoptotic proteins is not mechanistically related,Citation21 these two drug resistance mechanisms are often simultaneously deregulated.Citation32,Citation33 In conformity with this, a recent study demonstrated that siRNA downregulation of antiapoptotic genes reversed chemoresistance in P‐gp expressing chondrosarcoma cells.Citation34 Therefore, the simultaneous downregulation of both P‐gp and some antiapoptotic proteins could have a major impact on the viability of cancer cells. Indeed, this has been previously demonstrated in breast and ovarian cancer cell lines for the drug doxorubicin.Citation35
Imatinib is a tyrosine kinase inhibitor that targets BCR‐ABL protein in CML. Resistance to imatinib has been reported and may be due to BCR‐ABL mutations or to overexpression of P‐gp, amongst other reasons.Citation5,Citation36 Even though there is no published data relating XIAP overexpression with resistance to imatinib, we hypothesized, based on our previous data with other drugs,Citation20 that XIAP could be also involved in resistance to imatinib. Therefore, the objective of the present work was to target and downregulate XIAP or/and P‐gp expression and to further evaluate sensitivity to imatinib. This was possible by using, as models, a sensitive CML cell line (K562) and a P‐gp overexpressing resistant cell line derived from K562 (K562Dox).
To address the hypothesis, we used an RNAi based approach. The levels of inhibition of the targeted proteins using this approach with siRNAs depend on several factors, such as the thermodynamic structure of the siRNAs themselves and the structure of the target mRNA.Citation37 Furthermore, cells from leukemia cell lines are difficult to transfect.Citation38 All these explain the fact that we were not able to achieve complete silencing of the targeted mRNAs. Nonetheless, with the levels of XIAP downregulation obtained, we observed a consistent slight increase in sensitivity to imatinib, in both K562 and K562Dox cells. This increased sensitivity to imatinib was not due to alterations in cellular proliferation, as verified by the BrdU incorporation assay (data not shown), but was due to a significant increase in programmed cell death, verified by the TUNEL assay.
XIAP downregulation by itself caused, in both cell lines, a slight increase in the number of cells undergoing programmed cell death. This has been previously observed by usCitation18,Citation20 and suggests that XIAP may have a role in the maintenance of cellular viability.
Increased sensitivity to imatinib was also observed after downregulation of P‐gp expression in K562Dox cells, as was previously demonstrated by our group.Citation10 Downregulating P‐gp expression by RNAi had approximately the same effect as treatment with verapamil, a known P‐gp inhibitor.Citation39
As downregulation of either XIAP or P‐gp increased sensitivity to imatinib, we further investigated if the simultaneous downregulation of both targets would further increase sensitivity to this drug. The concomitant downregulation of these two independent mechanisms of pharmacological resistance had a significant effect on increasing sensitivity to imatinib in the resistant cell line (K562Dox). Indeed, simultaneous downregulation of XIAP and P‐gp had a stronger effect on sensitizing K562Dox cells to imatinib than the independent downregulation of either of these proteins. This result suggests that a successful approach to overcome some forms of resistance to imatinib may be to simultaneously target different mechanisms involved in drug resistance, such as drug efflux and apoptosis resistance. We suggest that this may be possible by specifically targeting P‐gp and XIAP proteins.
The authors would like to thank Novartis Oncology Portugal for financial support and Novartis Pharma for the STI571 used in this study. We would also like to thank Professor Clara Sambade and Professor Paula Soares for general advice.
References
- Lugo TG, Pendergast AM, Muller AJ, Witte ON. Tyrosine kinase activity and transformation potency of bcr‐abl oncogene products. Science 1990;247:1079–82.
- Bedi A, Zehnbauer BA, Barber JP, Sharkis SJ, Jones RJ. Inhibition of apoptosis by BCR‐ABL in chronic myeloid leukemia. Blood 1994;83:2038–44.
- Cortez D, Stoica G, Pierce JH, Pendergast AM. The BCR‐ABL tyrosine kinase inhibits apoptosis by activating a Ras‐dependent signaling pathway. Oncogene 1996;13:2589–94.
- Cambier N, Chopra R, Strasser A, Metcalf D, Elefanty AG. BCR‐ABL activates pathways mediating cytokine independence and protection against apoptosis in murine hematopoietic cells in a dose‐dependent manner. Oncogene 1998;16:335–48.
- Mahon FX, Deininger MW, Schultheis B, Chabrol J, Reiffers J, Goldman JM, et al.. Selection and characterization of BCR‐ABL positive cell lines with differential sensitivity to the tyrosine kinase inhibitor STI571: diverse mechanisms of resistance. Blood 2000;96:1070–9.
- Gorre ME, Mohammed M, Ellwood K, Hsu N, Paquette R, Rao PN, et al.. Clinical resistance to STI‐571 cancer therapy caused by BCR‐ABL gene mutation or amplification. Science 2001;293:876–80.
- Shah NP, Nicoll JM, Nagar B, Gorre ME, Paquette RL, Kuriyan J, et al.. Multiple BCR‐ABL kinase domain mutations confer polyclonal resistance to the tyrosine kinase inhibitor imatinib (STI571) in chronic phase and blast crisis chronic myeloid leukemia. Cancer Cell 2002;2:117–25.
- Mahon FX, Belloc F, Lagarde V, Chollet C, Moreau‐Gaudry F, Reiffers J, et al.. MDR1 gene overexpression confers resistance to imatinib mesylate in leukemia cell line models. Blood 2003;101:2368–73.
- Illmer T, Schaich M, Platzbecker U, Freiberg‐Richter J, Oelschlagel U, von Bonin M, et al.. P‐glycoprotein‐mediated drug efflux is a resistance mechanism of chronic myelogenous leukemia cells to treatment with imatinib mesylate. Leukemia 2004;18:401–8.
- Lima RT, Guimarães JE, Vasconcelos MH. Overcoming K562Dox resistance to STI571 (Gleevec) by downregulation of P‐gp expression using siRNAs. Cancer Ther 2007;5:67–76.
- Johnstone RW, Ruefli AA, Lowe SW. Apoptosis: a link between cancer genetics and chemotherapy. Cell 2002;108:153–64.
- Debatin KM, Krammer PH. Death receptors in chemotherapy and cancer. Oncogene 2004;23:2950–66.
- Pommier Y, Sordet O, Antony S, Hayward RL, Kohn KW. Apoptosis defects and chemotherapy resistance: molecular interaction maps and networks. Oncogene 2004;23:2934–49.
- Nakagawa Y, Abe S, Kurata M, Hasegawa M, Yamamoto K, Inoue M, et al.. IAP family protein expression correlates with poor outcome of multiple myeloma patients in association with chemotherapy‐induced overexpression of multidrug resistance genes. Am J Hematol 2006;81:824–31.
- Lopes RB, Gangeswaran R, McNeish IA, Wang Y, Lemoine NR. Expression of the IAP protein family is dysregulated in pancreatic cancer cells and is important for resistance to chemotherapy. Int J Cancer 2007;120:2344–52.
- Amantana A, London CA, Iversen PL, Devi GR. X‐linked inhibitor of apoptosis protein inhibition induces apoptosis and enhances chemotherapy sensitivity in human prostate cancer cells. Mol Cancer Ther 2004;3:699–707.
- Ndozangue‐Touriguine O, Sebbagh M, Merino D, Micheau O, Bertoglio J, Breard J. A mitochondrial block and expression of XIAP lead to resistance to TRAIL‐induced apoptosis during progression to metastasis of a colon carcinoma. Oncogene 2008;27:6012–22.
- Lima RT, Martins LM, Guimaraes JE, Sambade C, Vasconcelos MH. Specific downregulation of bcl‐2 and xIAP by RNAi enhances the effects of chemotherapeutic agents in MCF‐7 human breast cancer cells. Cancer Gene Ther 2004;11:309–16.
- Carter BZ, Milella M, Tsao T, McQueen T, Schober WD, Hu W, et al.. Regulation and targeting of antiapoptotic XIAP in acute myeloid leukemia. Leukemia 2003;17:2081–9.
- Lima RT, Martins LM, Guimaraes JE, Sambade C, Vasconcelos MH. Chemosensitization effects of XIAP downregulation in K562 leukemia cells. J Chemother 2006;18:98–102.
- Shi Z, Liang YJ, Chen ZS, Wang XH, Ding Y, Chen LM, et al.. Overexpression of Survivin and XIAP in MDR cancer cells unrelated to P‐glycoprotein. Oncol Rep 2007;17:969–76.
- Vasconcelos MH, Beleza SS, Quirk C, Maia LF, Sambade C, Guimaraes JE. Limited synergistic effect of antisense oligonucleotides against bcr‐abl and transferrin receptor mRNA in leukemic cells in culture. Cancer Lett 2000;152:135–43.
- O’Connor R. The pharmacology of cancer resistance. Anticancer Res 2007;27:1267–72.
- LaCasse EC, Mahoney DJ, Cheung HH, Plenchette S, Baird S, Korneluk RG. IAP‐targeted therapies for cancer. Oncogene 2008;27:6252–75.
- Kang MH, Reynolds CP. Bcl‐2 inhibitors: targeting mitochondrial apoptotic pathways in cancer therapy. Clin Cancer Res 2009;15:1126–32.
- Labi V, Grespi F, Baumgartner F, Villunger A. Targeting the Bcl‐2‐regulated apoptosis pathway by BH3 mimetics: a breakthrough in anticancer therapy? Cell Death Differ 2008;15:977–87.
- Mizutani Y, Nakanishi H, Li YN, Matsubara H, Yamamoto K, Sato N, et al.. Overexpression of XIAP expression in renal cell carcinoma predicts a worse prognosis. Int J Oncol 2007;30:919–25.
- Hongo F, Huerta‐Yepez S, Yu H, Goodglick L, Chia D, Horvath S, et al.. Overexpression of inhibitor of apoptosis protein XIAP in human prostate cancer. Proc Am Assoc Cancer Res 2005;46:abstract 4205.
- Kluger HM, McCarthy MM, Alvero AB, Sznol M, Ariyan S, Camp RL, et al.. The X‐linked inhibitor of apoptosis protein (XIAP) is up‐regulated in metastatic melanoma, and XIAP cleavage by Phenoxodiol is associated with Carboplatin sensitization. J Transl Med 2007;5:6.
- Vaalburg W, Hendrikse NH, Elsinga PH, Bart J, van Waarde A. P‐glycoprotein activity and biological response. Toxicol Appl Pharmacol 2005;207:257–60.
- Trnkova Z, Bedrlikova R, Markova J, Michalova K, Stockbauer P, Schwarz J. Semiquantitative RT‐PCR evaluation of the MDR1 gene expression in patients with acute myeloid leukemia. Neoplasma 2007;54:383–90.
- Notarbartolo M, Cervello M, Dusonchet L, Cusimano A, D’Alessandro N. Resistance to diverse apoptotic triggers in multidrug resistant HL60 cells and its possible relationship to the expression of P‐glycoprotein, Fas and of the novel anti‐apoptosis factors IAP (inhibitory of apoptosis proteins). Cancer Lett 2002;180:91–101.
- Notarbartolo M, Cervello M, Poma P, Dusonchet L, Meli M, D’Alessandro N. Expression of the IAPs in multidrug resistant tumor cells. Oncol Rep 2004;11:133–6.
- Kim DW, Kim KO, Shin MJ, Ha JH, Seo SW, Yang J, et al.. siRNA‐based targeting of antiapoptotic genes can reverse chemoresistance in P‐glycoprotein expressing chondrosarcoma cells. Mol Cancer 2009;8:28.
- Pakunlu RI, Cook TJ, Minko T. Simultaneous modulation of multidrug resistance and antiapoptotic cellular defense by MDR1 and BCL‐2 targeted antisense oligonucleotides enhances the anticancer efficacy of doxorubicin. Pharm Res 2003;20:351–9.
- Weisberg E, Griffin JD. Mechanism of resistance to the ABL tyrosine kinase inhibitor STI571 in BCR/ABL‐transformed hematopoietic cell lines. Blood 2000;95:3498–505.
- Schubert S, Grunweller A, Erdmann VA, Kurreck J. Local RNA target structure influences siRNA efficacy: systematic analysis of intentionally designed binding regions. J Mol Biol 2005;348:883–93.
- Dykxhoorn DM, Novina CD, Sharp PA. Killing the messenger: short RNAs that silence gene expression. Nat Rev Mol Cell Biol 2003;4:457–67.
- Biscardi M, Teodori E, Caporale R, Budriesi R, Balestri F, Scappini B, et al.. Multidrug reverting activity toward leukemia cells in a group of new verapamil analogues with low cardiovascular activity. Leuk Res 2006;30:1–8.