Abstract
This study evaluates the diagnostic reliability of 11 red blood cells indices, together with our new index, referred to as ‘11T’, in differentiation of beta‐thalassemia minor (BTm) from iron deficiency anemia (IDA). A total of 129 patients with microcytic anemia were involved in a retrospective study, 80 with IDA and 49 with BTm. Using an automatic program, we calculated 11 discrimination indices and a new score, 11T, based on the results of these 11 tests. To confirm the interest of 11T, we performed a prospective study with 53 patients. 11T was most effective in differentiating BTm from IDA: 11T had the highest Youden’s index (83%) and the best percentage of correctly identified patients (93%) and gave optimal performance in our prospective study. We proposed a score, 11T, which is able to discriminate between IDA and BTm with high specificity and high sensitivity in order to conduct the appropriate confirmatory examination.
Introduction
Iron deficiency anemia (IDA) is the most common cause of microcytic anemia. However, differential diagnosis with beta‐thalassemia minor (BTm) requires measuring levels of serum ferritin, transferrin saturation, and hemoglobin (Hb) A2. These methods are both costly and time consuming. Consequently, since 1973Citation1 several erythrocyte indices using simple red blood cell parameters from automated cell counting have been introduced in an attempt to distinguish between these two conditions, and are used for mass‐screening programs. The differential performance of these indices remains unclear and none is definitive. The aim of this retrospective study was to examine the diagnostic accuracy of 11 discrimination indices in a series of 129 patients (80 IDA and 49 BTm) and to propose their combination in a new score called ‘11T’, for assessment of differential diagnosis of IDA and BTm. We tested our observations with a prospective study on 53 patients.
MATERIALS AND METHODS
A total of 129 patients with microcytic anemia were included in the retrospective study: 80 IDA cases, 47 women and 33 men, mean age 36±20 years (mean±SD) (6–87 years) and 49 BTm cases, 25 women and 24 men, mean age 39±23 years (mean±SD) (4–85 years). These patients had no inflammatory syndrome based on C Reactive Protein values. We completed a prospective study, including 53 patients with microcytic anemia, 23 women and 20 men, mean age 36±18 years (mean±SD) (5–67 years).
The study has been approved by the Ethical Committee of the CHU Clermont Ferrand, and the study subjects gave informed consent for participation in the study.
Red blood cell count (RBC), Hb, red blood cell distribution width (RDW), mean corpuscular volume (MCV), and mean corpuscular hemoglobin (MCH) were obtained with an electronic cell counter XE‐2100 (Sysmex Corporation, Kobe, Japan). The other discrimination indices were calculated using red blood cells indices as defined below:
| 1. | red blood cells: RBC;Citation2 | ||||
| 2. | Mentzer index (MI): MCV/RBC;Citation1 | ||||
| 3. | |||||
| 4. | England and Fraser index (EF): MCV−RBC−(5×Hb)−5·19;Citation4 | ||||
| 5. | Srivastava index (S): MCH/RBC;Citation5 | ||||
| 6. | Green and King index (GK): MCVCitation2×RDW/100×Hb;Citation6 | ||||
| 7. | red blood cell distribution width: RDW;Citation7Citation7,8 | ||||
| 8. | red blood cell distribution width index (RDWI): MCV×RDW/RBC;Citation9 | ||||
| 9. | Ricerca index (R): RDW/RBC;Citation10 | ||||
| 10. | Ehsani index (E): MCV−10×RBC;Citation11 | ||||
| 11. | Sirdah index (Si): MCV−RBC−3×Hb;Citation12 | ||||
| 12. | new score 11T. | ||||
We apply a quotation for each of the precedent indices as 1 = in favor of BTm, 0 = in favor of IDA, and 11T is the addition of the quotation of all the indices.
Data were entered into an Excel (Microsoft, Redmond, WA, USA) spreadsheet which calculated automatically these 11 indices, the 11T score and gave a conclusion.
Ferritin and transferrin saturations were determined immunoturbidimetrically on an automatic analyser (Modular Roche Diagnostics, Meylan, France). The value of Hb A2 was determined by electrophoresis performed at alkaline pH with Hydrogel Hemoglobin agarose gel kits K20 (Sebia, Issy‐les‐Moulineaux, France) and by High Performance Liquid Chromatography on Bio‐Rad variant II (Biorad SA, Ivry‐sur‐Seine, France). The diagnosis of IDA was based on serum ferritin levels <15 ng/ml.Citation13 The diagnosis of BTm was based on microcytosis (microcytis pseudopolyglobulia), normal ferritin levels and elevated Hb A2 levels above 3·5%.
Data from combined BTm and IDA subjects are not included in this study.
For each test the sensitivity, specificity, and positive and negative predictive values were calculated as follows: sensitivity: true positive/(true positive+false negative); specificity: true negative/(true negative+false positive); positive predictive value: true positive/(true positive+false positive); negative predictive value: true negative/(true negative+false negative); Youden’s index was calculated as: sensitivity+specificity–100. The percentage of correctly identified patients was: (true positive+true negative)/(true positive+true negative+false positive+false negative). Furthermore, receiver operative characteristic (ROC) curves were constructed to calculate the area under the curve (AUC) for each index. The collected data were processed using Medcalc® statistical programs (version 9·6·4·0; Med Calc Software Company, Mariake, Belgium). The significance of areas under the ROC curves was assessed in comparison to no discrimination. Statistical significances of differences between groups were determined using a Student’s t‐test.
Results
The hematological data of the two groups of the retrospective study are shown in .
Table 1. Hematological data of the two patient groups
Comparative statistical evaluations of the different indices based on AUC are presented in and . GK, RDWI, 11T, and Si were the most effective indices to differentiate BTm from IDA, with AUC ∼0·95. No significant differences were observed between these four indices (P>0·05). However, they were significantly different to RDW, SL, and S (P<0·001).
Figure 1. Receiver operative characteristic curves of different RBC indices. (A) 11T: ROC curves of our new score; EF: England and Fraser; GK: Green and King; S: Srivastava; SL: Shine and Lal. (B) 11T: ROC curves of our new score; MI: Mentzer index; RBC: red blood count; RDW: red blood distribution; RDWI: red blood distribution width index. (C) 11T: ROC curves of our new score; E: Ehsani; R: Ricerca; Si: Sirdah.
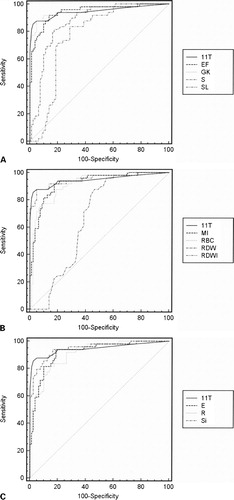
Table 2. Evaluation of different RBC indices in the differentiation of BTm from iron deficiency
Firstly, we analyzed the performance of 11 indices using the cut‐off value published in the literature. The results were mediocre and commonplace (unpublished data). Thus, we established, for each index, our own cut‐off values based on the studied population data and corresponding to the highest accuracy (minimal false negative and minimal false positive results) ().
Sensitivity, specificity, positive predictive value, negative predictive value, Youden’s index, and the percentage of correctly identified patients are presented in . The cut‐off value used corresponded to the greatest accuracy. In this way, 11T was determined in favor of a BTm when it was superior or equal to 8. 11T, GK, and RDWI had the highest Youden’s index (more than 82%) and 11T had the highest percentage of correctly identified patients (93%). In particular, 11T had the highest positive predictive value for BTm in our population studied (more than 95%). In our prospective study, the results were similar with more than 95% of correctly identified patients (18/18 BTm and 33/35 IDA).
Table 3. The differential values of each discrimination index and the correctly identified number of the patients using these indices in each group and group totals
Discussion
Thalassemia was originally thought to be a disease limited to the Mediterranean region; however, it is now known that it occurs widely throughout many parts of the world. In France and in the rest of the world, iron deficiency is the first cause of microcytic anemia,Citation14 but recent migration movements from Portugal, Spain, Italy, and North Africa frequently require differential diagnosis between BTm and IDA. It is important to differentiate between these two forms of anemia because each has an entirely different cause, pathogenesis, treatment, and prognosis. Iron metabolism study is expensive. Determination of Hb A2 level is not possible in all laboratories and requires several time‐consuming methods that are not available daily in many laboratories. Reticulocyte indices are potentially interestingCitation15 but these parameters are also expensive and not available with all automated counters. None of the erythrocyte indices proposed can be relied on for safe differential diagnosis between BTm and IDA.Citation16 In this work, we proposed a new score, based on indices described in previous studies using parameters given by routine blood count automates, which is able to discriminate between IDA and BTm with high specificity and high sensitivity in order to conduct the appropriate second examination.
In BTm population, a relationship between the haematological phenotype and the type of hemoglobin mutation existsCitation17 and, in this case, a significant correlation between MCV and the severity of the thalassemia mutation was observed.Citation18 These data could explain the differences observed in many studies and the necessity to define new cut‐off values for each population analyzed.
There are few published studies that compare the validity of all the defined discrimination indices in differentiation between BTm and IDA. In their work in a pediatric population, Demir et al. calculated eight discrimination indices and concluded that none of the discrimination indices showed 100% sensitivity and specificity. RBCs and RDWI had the highest Youden’s index value (82 and 80% respectively) and could differentiate BTm from IDA in 90% of the patients with RBC and 92% with RDWI.Citation19 In a Turkish population, none of the indices were higher than RBC.Citation20 In contrast, in a population of Greek adults patients, among six indices, GK was the most reliable index, followed by EF, RBC, MI, and RDWI. GK had the highest sensitivity with 75% but the authors concluded that these six indices cannot be relied on for safe differential diagnosis because their sensitivity was not satisfactory.Citation21 In a Palestinian population, Sirdah et al. showed that GK and RDWI were the most reliable indices for differentiating BTm from IDA.Citation12 They proposed a new index (MCV−RBC−3×Hb) which may be useful in this discrimination but their formula is not more efficient than GK and RDWI in our study.
11T provided the largest AUC with GK, RDWI, and Si, suggesting that they are the most reliable discrimination indices in differentiating BTm from IDA. These results were in accordance to previous studies published.Citation12,Citation16,Citation19,Citation21 Youden’s index takes account of both sensitivity and specificity and gives an appropriate measure of a particular technique. In our study, the 11T score had the highest Youden’s index and, moreover, allowed the highest percentage (more than 93%) of correctly identified patients. In our prospective study, in the daily work, the results were similar with more than 95% of correctly identified patients. Despite of the fact that none of the indices was sufficient to confirm the diagnosis, the new score 11T could be used as a better screening tool.
We demonstrated the efficiency of this new score with a high AUC, the highest Youden’s index, and the best percentage of correctly identified patients. Our new score, 11T, should be used as a very good screening tool, provided that cut‐off values are correctly determined for the population studied. Moreover, we conducted our study in a heterogeneous population. Consequently, our index also applies to infants and pregnant women.
Our 11T score is less time‐consuming and could be used in mass‐screening programs, to determine whether the blood sample is more suggestive of BTm or IDA, especially in developing countries where the resources are limited. Carriers of BTm do not have any disease, nor any physical or mental symptoms and do not require medical treatment, but screening of BTm is of increasing importance in genetic counselling and it is important to give appropriate medicine in the event of IDA. In our laboratory, we now use the computer program developed to calculate the 11T score from the red blood cells parameters. This approach, accessible to all laboratory biologists, allows us to save time and money because it leads to recommendation of the appropriate confirmatory examination in nearly all cases.
To our knowledge, there is no published study that has compared the validity of so many common defined discrimination indices for BTm and IDA in the same study group. Furthermore, this is the first time that a combination of these indices has been studied. Through an original approach, we developed a combination of 11 indices, the 11T score, accessible in few seconds by an informatics program. Finally, our 11T score is successful in our region, with a multi‐ethnic population, in which IDA is much more frequent than BTm, and should be also performing in homogeneous populations all around the world.
References
- Mentzer WC. Differentiation of iron deficiency from thalassemia trait. Lancet 1973;1:882.
- Klee GG, Fairbanks VF, Pierre RV, O’Sullivan MB. Routine erythrocyte measurements in diagnosis of iron deficiency anemia and thalassemia minor. Am J Clin Pathol 1976;66:870–7.
- Shine I, Lal S. A strategy to detect beta‐thalassemia minor. Lancet 1977;1:692–4.
- England JM, Bain BJ, Fraser PM. Differentiation of iron deficiency from thalassemia trait by routine blood‐count. Lancet 1973;1:449–52.
- Srivastava PC, Bevington JM. Iron deficiency and/or thalassemia trait. Lancet 1973;1:832.
- Green R, King R. A new red blood cell discriminant incorporating volume dispersion for differentiating iron deficiency anemia from thalassemia minor. Blood Cells 1989;15:481–95.
- Bessman JD, Feinstein DI. Quantitative anisocytosis as a discriminant between iron deficiency and thalassemia minor. Blood 1979;53:288–93.
- Roberts GT, El Badawi SB. Red blood cell distribution width index in some hematologic diseases. Am J Clin Pathol 1985;83:222–6.
- Jayabose S, Giavanelli J, Levendoglu‐Tugal O, Sandoval C, Özkaynak F, Visintainer P. Differentiating iron deficiency anemia from thalassemia minor by using an RDW‐based index. J Pediatr Hematol Oncol 1999;21:314.
- Ricerca BM, Storti S, d’Onofrio G, Mancini S, Vittori M, Campisi S, et al.. Differentiation of iron deficiency from thalassemia trait: a new approach. Haematologica 1987;72:409–13.
- Ehsani M, Darvish A, Aslani A, Seighali F. A new formula for differentiation of iron deficiency anemia (IDA) and thalassemia trait (TT). Turk J Haematol 2005;22:268.
- Sirdah M, Tarazi I, Al Najjar E, Al Haddad R. Evaluation of the diagnostic reliability of different RBC indices and formulas in the differentiation of the β‐thalassemia minor from iron deficiency in Palestinian population. Int J Lab Hematol 2007;30:324–30.
- Guyatt GH, Oxman AD, Ali M, Willan A, McIlroy W, Patterson C. Laboratory diagnosis of iron‐deficiency anemia: an overview. J Gen Intern Med 1992;7:145–53.
- DeMaeyer E, Adiels‐Tegman M. The prevalence of anaemia in the world. World Health Stat Q 1985;38:302–16.
- Agorasti A, Trivellas T, Papadopoulos V, Konstantinidou D. Innovative parameters RET‐Y, sTfR, and sTfR‐F index in patients with microcytic, hypochromic anemia – their special value for hemoglobinopathies. Lab Hematol 2007;13:63–8.
- Beyan C, Kaptan K, Ifran A. Discrimination indices have no predictive value in differential diagnosis of iron deficiency anemia and beta‐thalassemia trait. Int J Lab Hematol 2008;30:344–5.
- Rosatelli C, Leoni GB, Tuveri T, Scalas MT, Mosca A, Galanello R, et al.. Heterozygous beta‐thalassemia: relationship between the hematological phenotype and the type of beta‐thalassemia mutation. Am J Hematol 1992;39:1–4.
- Rund D, Filon D, Strauss N, Rachmilewiz E, Oppenheim A. Mean corpuscular volume of heterozygotes for beta‐thalassemia correlates with the severity of the mutations. Blood 1992;79:238–43.
- Demir A, Yarali N, Fisgin T, Duru F, Kara A. Most reliable indices in differentiation between thalassemia trait and iron deficiency anemia. Pediatr Int 2002;44:612–6.
- Beyan C, Kaptan K, Ifran A. Predictive value of discrimination indices in differential diagnosis of iron deficiency anemia and beta‐thalassemia trait. Eur J Haematol 2007;78:524–6.
- Ntaios G, Chatzinikolaou A, Saouli Z, Girtovitis F, Tsapanidou M, Kaiafa G, et al.. Discrimination: indices as screening tests for beta‐thalassemic trait. Ann Hematol 2007;86:487–91.