Abstract
Microarray analysis makes it possible to determine thousands of gene expression values simultaneously. Changes in gene expression, as a response to diseases, can be detected allowing a better understanding and differentiation of diseases at a molecular level. By comparing different kinds of tissue, for example healthy tissue and cancer tissue, the microarray analysis indicates induced gene activity, repressed gene activity or when there is no change in the gene activity level. Fundamental patterns in gene expression are extracted by several clustering and machine learning algorithms. Certain kinds of cancer can be divided into subtypes, with different clinical outcomes, by their specific gene expression patterns. This enables a better diagnosis and tailoring of individual patient treatments.
Introduction
Cancer is a complex genetic disease characterized by the accumulation of multiple molecular alterations. Current diagnostic and prognostic classifications of tumours are mainly based on clinical and pathologic factors. The clinical experience shows that they are often insufficient to describe the whole heterogeneity of tumours. A lot of current anticancer agents do not differentiate between tumour subtypes, leading sometimes to disastrous adverse effects. The gene expression profiling by microarray is a method of characterization of cancer (and other diseases) at a molecular level.Citation1–Citation10 It enables the simultaneous mapping of thousands of gene expressions in a single tumour sample. The identification of specific groups of genes, known as signature genes, provides more accurate prognostic factors than current clinical factors. The interpretation of the vast amount of microarray data and the detection of subtle patterns is done automatically by machine learning algorithms. Such algorithms predict the class of a gene, by means of its expression pattern, while fitting it with predefined training patterns. They are used as decision tools to differentiate between healthy cells and tumour cells or between cancer subtypes. The focus of this introductory paper lies on haematological applications for DNA microarrays and how they can help to improve diagnosis. The principles of the DNA microarray technology and the automated interpretation of the resulting gene expression data are presented. By means of a machine learning method, known as the support vector machine, the prediction of cancer subtypes and its use as a diagnostic tool is discussed. The principle of the algorithm is presented in a geometrical manner. The procedures are illustrated using the example of the diffuse large B-cell lymphomas. Further clinical applications are presented by means of several types of haematologic cancer.
Microarrays
The functional behaviour of a genome can be studied by determining which genes are induced and which genes are repressed in a cell during a defined snapshot.Citation11–Citation24 The microarray technology makes it possible to explore gene expression patterns of entire genomes. A microarray is usually a small glass slide (approximately 2·0×2·0 cm) covered with a great number (20·000 or more) of precisely placed spots. Each spot contains a different single stranded DNA sequence fragment, which is linked covalently to the slide. The spots are arranged in an array and a specific DNA sequence fragment is unequivocally determined by the position of its spot on the slide. Then, any reaction that results in a change of the gene expression can be assigned to a specific DNA sequence. Because one strand of DNA hybridizes with its complementary strand, each DNA sequence fragment on a microarray serves as a probe to detect and identify a unique complementary DNA.
In a microarray experiment, first the DNA sequence fragments complementary to the genes of interest are placed on the class slide (). Such gene chips are manufactured robotically. Then a set of different cell populations is selected – these are the targets. For example: the set contains normal cells of a tissue and cancer cells related to this tissue. The cell populations of the set are screened for expressed genes. The indicator for a gene expression is an enhanced cytoplasmatic concentration of the corresponding mRNA. Then the mRNA is isolated from the cell population. The complementary DNA (cDNA) sequence, needed for the hybridization on the microarray, is produced out of the mRNA by reverse transcriptase. To distinguish the mRNA from different cells, for example normal cells versus cancer cells, the nucleotides, used for the biosyntheses of the cDNA sequence during the reverse transcription, are labelled with different fluorescent dyes. In our example, the cDNA from the normal cells is used as a reference cDNA and labelled with green fluorescent dye. The cDNA from the cancer cells is used as a test cDNA and labelled with red fluorescent dye. Often used dyes are Cyanine fluorescent dyes: the green Cy3 and the red Cy5 (Amersham Pharmacia Biotech, Santa Clara, CA, USA). Then, the samples are mixed together and incubated with the single stranded probe DNA on the microarray. At the microarray inside the spots, competitive hybridisations of the labelled cDNAs with the respective complementary DNA strand results. Because of the competitive hybridization, the gene expression is determined relative to the reference. After the incubation time, the cDNA molecules that did not bind to any of the spots are washed off. The location and intensities of the fluorescent dyes are scanned by use of a confocal scanner or a CCD camera and the degree of hybridization is measured. During the scanning procedure, the fluorescent dyes are excited by laser light. First, a green laser light excites the Cy3 fluorescent dye and then a red laser light excites the Cy5 fluorescent dye. The fluorescent radiations are measured by detectors. The separate detection of the green and red fluorescent light during the scanning process produces two digital images of the microarray: one for the green dyes and the other for the red dyes. In a further step, the two digital images are pseudo-coloured (false colours) and merged to a ratio image of the microarray (). The relative intensities of the gene expression are then expressed by the ratio (Cy5/Cy3). A red spot indicates that a gene produces more mRNA in the test probe than in the reference probe. Then the gene activity is induced within the test probe. A green spot indicates that the gene has a lower activity in the test probe than in the reference probe. The gene activity is repressed in the test probe. A yellow spot (equal intensities of green and red labels) indicates that there is no change in the gene activity level in the two probes. After the generation of the microarray, several post-processing operations are necessary: the generation of replicates reduces the variability in the summary statistics; the removing of spots with insufficient quality; the normalization within and between slides and the rescaling of the relative intensity ratios. These operations have been discussed, in more details, in a previous publication.Citation24
Figure 1. To perform a microarray experiment, first, fragments of single stranded DNA are arranged in an array and bounded on a glass slide. They serve as probes. During gene expression a certain amount of mRNA occurs in the cytoplasm of target tissue cells. Reference mRNA is isolated from healthy cells of a tissue. Test mRNA is gained from the tissue related cancer cells. The mRNA from reference and test samples are converted into cDNA by reverse transcription, labelled with different fluorescent dyes and mixed together. Then the mixture is incubated with the single stranded DNA on the microarray slide. The different cDNA molecules hybridize competitively with the respective complementary DNA parts and the colours indicate different states of gene expression.
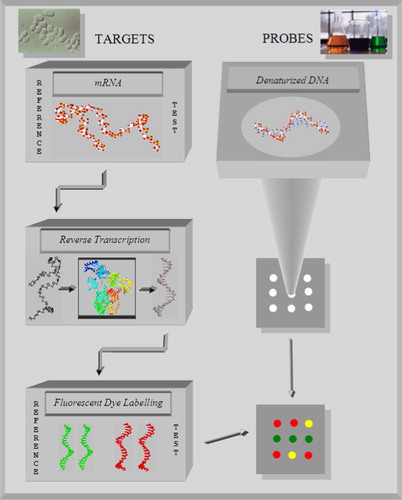
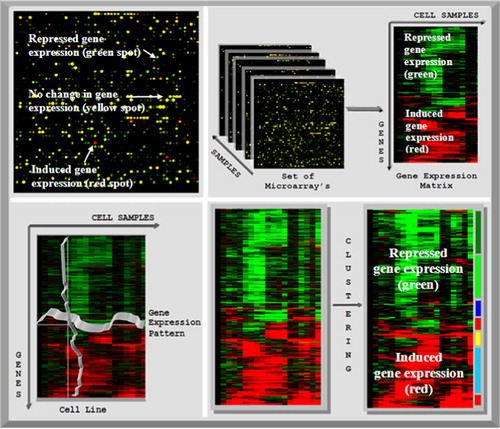
Figure 2. Left top: scan of a microarray. Green dye was used for the cDNA extracted from the reference cells and red dye was used for the cancer cells. Red spots indicate induced genes in cancer cells, green spots indicate repressed genes and yellow spots indicate no change between healthy cell and cancer cells. Right top: the microarray samples are converted into the expression matrix. In the expression matrix, the genes are arranged in the rows and the columns represent the gene expression values. Left bottom: the gene expression matrix can be clustered in two ways: if the genes are clustered, then the similar gene expression patterns are grouped together. By clustering according to the samples, all cells with similar gene expression profiles are grouped together. Right bottom: by clustering the unstructured gene expression matrix (left), the genes with similar expression patterns are grouped together in a structured data set (right).
In a microarray experiment, all the immobilized representative genes on the chip are reacting and therefore deliver information about the global transcription state of the considered tissue, as well as about the local expression state of single genes. The amount of data resulting from microarray experiments is too vast and complex to be interpreted manually by a human observer. Therefore adequate, automated analysis is needed.
Microarray Analysis
The detection of genes with similar expression patterns leads to the conclusion that the genes are co-regulated. Such genes work together and form a specific class. Goal of the classification is the partition of a set of genes into groups with similar regulation behaviour.
Unstructured and structured gene expression data sets
For further investigations, the measured values from microarray experiments are represented as gene expression matrix. If the overall gene set emphasis N genes and the number of performed experiments is P, then the data are arranged in a gene expression matrix with N rows and P columns (). Each row represents the gene expression pattern of a gene along the P experiments and every column the whole gene expression profile during the considered experiment. The kind of experiment can be determined either by measuring the gene expression of a cell at P different points of time (development phases of a cell) or by the gene expression profiles of P different tissues (healthy and disease). As illustrated in , the gene expression pattern of the gene yn is described geometrically by a vector:xnk is the expression value of the gene number n during the experiment number k. These gene vectors are used for comparing gene expression patterns. Let us assume that the gene expression vector yn is compared with the vector ym. The similarity of the gene expression patterns is measured by the distance between the two vectors. If the expression patterns of two genes are very similar then the distance between the vectors is small. If the expression patterns differ, then the distance is bigger. The task of clustering is the reorganisation of the inhomogeneous gene expression data so that the genes are grouped together according to the similarity of their homogeneous expression patterns ().
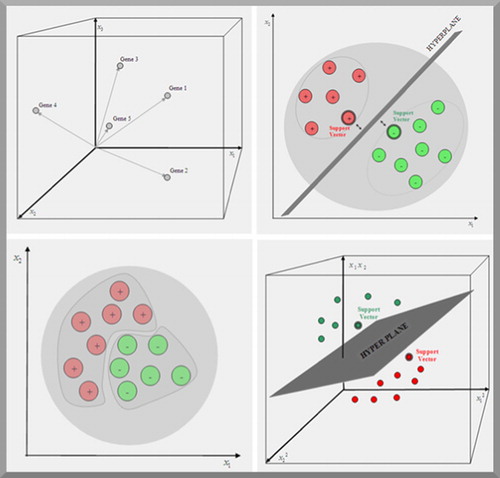
Figure 3. Left top: every gene is represented by a point in a P dimensional space, where the position of the point is determined by the P expression values xk on each axis of the coordinate system. Right top: a support vector machine tries to find a hyperplane which separates two predefined classes of genes in a training set. The first class is labelled positive and the second class is labelled negative. The genes (with double edges) in each class that are closest to the hyperplane are called support vectors. Bottom left and right: if genes cannot be linearly separated in the initial expression space, their vectors are mapped in a higher dimensional space spanned by all products, with a predefined factor, of the expression values. In this space a hyperplane separating the instances can be found.
Clustering and classification of gene expression data
The clustering algorithms decide whether or not two genes belong to the same class. The similarity of the gene expression patterns in a class leads to the assumption that they have common regulative factors. Furthermore, genes with an unknown function can be characterized by the function of the class. Methods used for the partitioning of genes into groups with similar expression patterns, are for example: hierarchical clustering; k-means clustering and self organizing maps.Citation25–Citation31 These algorithms were described in more detail in a previous publication.Citation24 The gene expression matrix can be clustered either by the gene expression pattern or by the samples; the gene expression profiles (). By clustering according to the gene expression patterns, the similar patterns are grouped together. By clustering according to the samples, all genes with similar gene expression profiles are grouped together (). Once distinct classes of gene expression patterns are identified, the resulting information is used to search systematically for specific expression patterns in further tissue samples. This task is done by supervised machine learning.
Support vector machines and diagnostic decisions
Supervised algorithms learn, by means of a training set to specify which gene expression pattern is assigned to a predefined class.Citation32 For illustration, let us assume that there is a set of genes sharing a common function, they are labelled positive. Furthermore, let us assume that there is a separate set of genes which belong definitively not to the functional group, they are labelled negative. By using the training set as input, the supervised algorithm learns to discriminate between members and non-members of the functional class. A kind of supervised machine learning algorithms, the so called support vector machines are very helpful when only a fraction of the genes in a cell are functionally annotated. Support vector machines (note: support vector machines are mathematical algorithms, not machines) search for a hyperplane, separating the data sets.Citation33–Citation36
The principle of the support vector machine is geometrically illustrated in . In a two-class data set, a hyperplane that separates all training set of genes correctly can always be drawn. Hyperplanes are planes in higher dimensional spaces; in a P dimensional space the hyperplane has the dimension P−1. The maximum hyperplane is the one that gives the best class separation. The gene vectors that are closest to the maximum margin hyperplane are called support vectors. They uniquely define the maximum margin hyperplane for the learning problem. A simple algorithm for generating a hyperplane that separates data perfectly is the perceptron learning rule.Citation37 This rule is as follows: If a training instance is misclassified (that means, located on the wrong side of the hyperplane), the parameters of the hyperplane are modified so that the instance moves across the hyperplane onto the correct side (that means, it is assigned to the correct class). If the misclassified gene belongs to the first class (labelled positive) then its expression values are added to the parameters of the hyperplane. If the misclassified gene belongs to the second class (labelled negative) then its expression values are subtracted from the parameters of the hyperplane. In this way, the algorithm iterates through all the training instances until all are correctly classified.
However, in real world problems, such as gene expression, the data sets can, in general, not separated in a linear manner as discussed above. That means that a hyperplane, separating the classes, can not be constructed. Therefore the initial space of expression values is mapped into a higher dimensional space.Citation38,Citation39 For example: for a gene with two expression values (x1,x2) in the initial space, the transformation into a space, spanned by all products with two factors, is given by:To generate a linear behaviour in the (four-dimensional) space spanned by these products, the vectors of all training genes are mapped into the higher dimensional space. Now, the support vector machine constructs a hyperplane in the new space (). The learning algorithm of the support vector machine is then applied to the transformed training vectors. To classify an unknown gene vector, the same transformation prior to the classification is done.
For the mathematically interested reader: the equation which defines the maximum margin hyperplane can be written exclusively by a dot product (siym) of the support vectors si and a test gene vector ym. Then the maximum margin hyperplane is given by:The class value ci of a training vector is either 1 (it belongs to the class) or −1 (it does not belong). b and ai are numeric parameters that have to be determined by the learning algorithm, n is the number of factors in the transformation. In the special case of n = 1, the hyperplane of the linear separable data set results.
The focus of this paper lies on biomedical applications for DNA microarrays and how they can improve diagnosis. To find genes, which are suitable for clinical prognosis, the gene pool is searched for clusters that have specific patterns in healthy tissue samples and different patterns in tissues with diseases. The identified genes, the signature genes, are used for the differentiation of healthy and disease related tissue. The support vector machine learns to differentiate between healthy and disease related tissue by means of the expression profile of the signature genes. This makes it useful as a decision aid for molecular diagnosis and prognosis. The method is illustrated by the diagnosis of diffuse large B-cell lymphoma, which led to the discovering of diffuse large B-cell lymphoma subtypes.
Molecular differentiation of diffuse large B-cell lymphoma
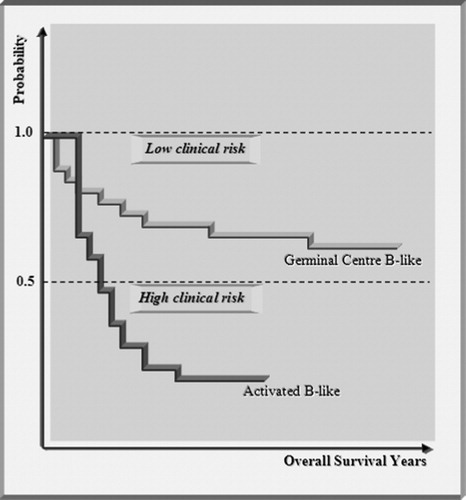
The diffuse large B-cell lymphomas, a very aggressive malignancy of B cells, belong to the non-Hodgkin’s lymphomas.Citation40–Citation44 Somatic hypermutations have been observed in genes in the germinal centres of secondary lymphoid tissue, the lymph nodes. The clinical symptoms are a tumefaction of the lymphatic nodes or the formation of extra nodal tumours. The therapy is based on chemotherapy treatment. A clinical observation is that only about 40% of all patients suffering on diffuse large B-cell lymphoma respond to the chemotherapy. The survival time curve indicates the rate of patients still alive after a certain time delay (). The patients are segregated into high-risk and low-risk categories which are indicated by different survival curves.
Figure 4. Kaplan–Meier plot of patients, treated for diffuse large B-cell lymphoma. The plot shows two distinct clinical outcomes. The patients respond differently to the chemotherapy and segregate into high clinical risk and low clinical risk categories depending on the number of years survival post-diagnosis. By separating the patients with microarray analysis into germinal centre B-like and activated B-like subcategories of diffuse large B-cell lymphoma, it is shown that the two clinical outcomes agree with the two subcategories.
DNA microarrays enable a better understanding of lymphoma cancer. The human samples, used to produce the test cDNAs, emphasize normal and malignant lymphocytes. The test cDNA is labelled with red dye. The reference cDNA is produced from a pool of different lymphoma cell lines and labelled with green dye. Diffuse large B-cell lymphoma cells express a lot of proliferation genes and therefore they have an aggressive malignancy. To classify diffuse large B-cell lymphoma samples, the first step is to identify gene clusters with similar expression patterns. Of interest are signature genes where the expression shows patterns in red (induced expression) for some part of the diffuse large B-cell lymphomas in the sample and patterns in green (repressed expression) for the other part. To enable an identification of such signature genes, the genes are first clustered by hierarchical clustering methods according to their similarity of gene expression patterns. Then the genes expressed in particular cell types or cell processes are grouped together. This facilitates the investigators the detection of significant signature genes by comparing the different clustered patterns. Additionally, in a second step, the samples are clustered on the basis of their similarity of gene expression profiles, whereby tissue samples with similar gene expression profile are grouped together. On hand of the clustering output, signature genes, enabling a description of a particular cell type and the differentiation of different cell types, are identified. Two signature genes, which discriminate the active B-cell types from other cell types, are selected for further investigation: the germinal centre B-cell signature gene and the activated B-cell signature gene (). The first class is based on cell type (germinal centre B cell) and the second class is based on cell process (proliferation). About half of them look like germinal centre B cells and the other half look like activated B cells. The hierarchical clustering shows that the diffuse large B-cell lymphoma samples are contained in the germinal centre B-cell cluster (together with the germinal centre B-cell samples). The germinal centre B-cell signature is heterogeneous and is therefore used to re-cluster the diffuse large B-cell lymphoma samples into new subcategories. The diffuse large B-cell lymphoma and the germinal centre B-cell samples are re-clustered by use of the germinal centre B-cell signature genes alone. Then these samples cluster into a class with induced germinal centre genes and a class with repressed germinal centre genes. By using the full set of genes, the gene expression patterns are re-clustered while retaining the classification of the diffuse large B-cell lymphoma samples. Then, based on the gene expression profiles, one part of the diffuse large B-cell lymphoma samples look like germinal centre B cells and the other part like activated B cells (). For patients where the diffuse large B-cell lymphoma samples are separated into germinal centre B cells or activated B-cell like clusters, the survival rates are different. This information can be used to predict which patients would benefit from the chemotherapy and which would not (or might benefit from bone marrow transplantation). The different expression profiles are used for the training of a support vector machine ().
Figure 5. Signature genes are a set of genes with distinct expression patterns, which are used for describing particular cell types. Two signature genes, the germinal centre B cell and the activated B cell are identified and used for clustering the samples (containing normal and malignant lymphomas) into two subcategories. The subcategories are characterized by cell type and cell process. For this purpose, the genes are clustered first according to their expression patterns and additionally the samples are clustered according to the similarity of their gene expression profiles. The cluster analysis shows that the diffuse large B-cell lymphoma samples are completely contained in the germinal centre B-cell cluster (cell type).
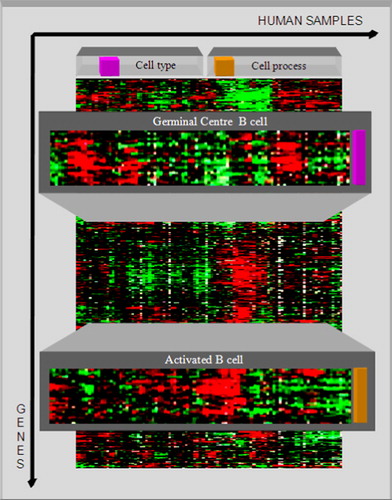
Figure 6. By use of the germinal centre B-cell signature gene, the diffuse large B-cell lymphoma (DLBCL) samples are clustered into two subcategories: germinal centre B-like DLBCL and activated B-like DLBCL. The different gene expression patterns are clearly shown.
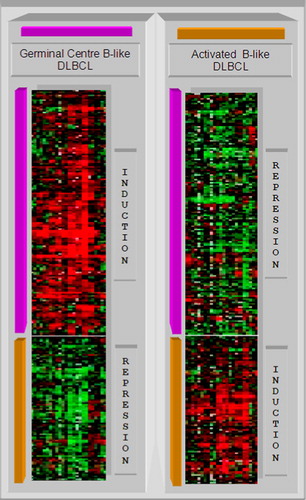
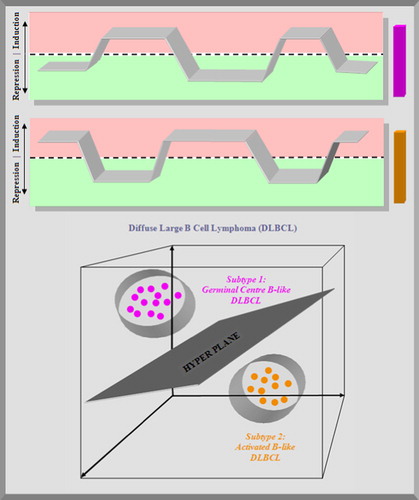
Figure 7. Top: the overall behaviour of the signature genes is shown in the plots. The germinal centre B-cell signature gene shows a repression of the expression in the first columns, an induction in the next columns, then a repression followed by an induction and a repression in the next columns. The activated B-cell signature gene shows a negative correlation with this pattern. Bottom: during the training phase, a support vector machine generates a maximum margin hyperplane that separates the germinal centre B cells and activated B cells diffuse large B-cell lymphomas (DLBCL).
Molecular Diagnosis and Leukaemia
Despite the tremendous advances in the characterization and therapy of cancer which have been made in the last decades, clinicians still have difficulty, in several types of cancer, to accurately predict the prognosis in individual cancer patients. Gene expression profiling is a robust technology for the diagnosis of haematologic malignancies with high accuracy.Citation45 The performance of identified signature genes as molecular diagnostic tools in the classification and separation of malignant tumours is evaluated in several types of leukaemia. Like other cancers too, leukaemia results from somatic mutations in the DNA. Certain mutations activate oncogenes or deactivate tumour suppressor genes, resulting in a disruption of the regulation of cell death. Such mutations may occur as a result of exposure to radiation or carcinogenic substances (like benzene), a virus infection, and are likely to be influenced by genetic factors. Leukaemia is clinically and pathologically subdivided into large groups.
First, leukaemia is divided into an acute and a chronic disease. Acute leukaemia is characterized by the rapid increase of immature blood cells, resulting in the inability of the bone marrow to produce healthy blood cells. Due to the rapid progression an immediate treatment is required. Chromosomal translocations of transcription factors are common in acute leukaemia. Acute forms are the most common forms of leukaemia in children. In contrast to acute leukaemia, chronic leukaemia takes months or years to progress. Relatively mature, but still abnormal, white blood cells are produced at a higher rate than normal. Chronic forms are monitored for a longer time before treatment to ensure the effectiveness of the therapy. Chronic leukaemia mostly occurs in older people. The different forms of leukaemia are additionally differentiated according to which kind of blood cell is affected. This splits leukaemias into lymphocytic (or lymphoblastic) leukaemias and myelogenous leukaemias. In lymphoblastic/lymphocytic leukaemia, marrow cells that normally goes on to form lymphocytes are affected. Most lymphocytic leukaemias involve the B cell as a specific subtype of lymphocyte. In myelogenous leukaemias, a type of marrow cell, which normally goes on to form red blood cells, and platelets are affected by cancerous modifications. In the following, clinical applications of the molecular diagnostic of haematologic cancer are presented by means of: acute myelogenous leukaemia (AML), chronic lymphoid leukaemia, acute lymphoblastic leukaemia (ALL) and T-cell acute lymphoblastic leukaemia (T-ALL).
Acute myelogenous leukaemia
Acute myelogenous leukaemia is a heterogeneous disorder which is characterized by the inhibition of myeloid differentiation in haematopoietic progenitor cells. This results in the accumulation of relatively undifferentiated ‘blasts’, replacing the normal marrow elements. Acute myelogenous leukaemia can be categorized as: AML with recurrent chromosomal abnormalities; therapy-related AML; myelodysplastic syndrome-associated AML and AML not otherwise specified. The most common cause of death is bone marrow failure resulting in anaemia, neutropenia, and thrombocytopenia. The diagnosis is based on a combination of morphology, cytochemistry, flow cytometry, and cytogenetic. The analysis of gene expression profiles has been used to explore ways for the prediction of the therapeutic response in AML and to elucidate the mechanism of pathogenesis. The microarray technology has been applied to the diagnosis and prognosis of AML.Citation46–Citation49 The analysis enabled the confirmation of already known subclasses as well as the prediction of new subclasses. Acute myelogenous leukaemia subclasses with prognostic relevant chromosomal abnormalities were predicted. A cluster with a distinctive gene expression signature associated with significantly poor outcome was identified. This demonstrates the prognostic power of gene expression signatures. Array technology has also been applied to gain a better understanding of the molecular basis of therapeutic agents commonly used in AML.Citation50
Chronic lymphoid leukaemia
B-cell chronic lymphocytic leukaemia (B-CLL), is the most common type of leukaemia. Chronic lymphocytic leukaemia affects B-cell lymphocytes, which are fighting infections by producing antibodies. They are produced in the bone marrow and develop in the lymph nodes. The CLL is a low malignant, leukaemic B-cell non-Hodgkin’s lymphoma. In western world it is the main form of leukaemia and affects adults over the age of 55. Symptoms are, beside high white blood cell count, swollen lymph nodes, spleen, and liver. The early CLL is not treated and, at a later stage, it is treated with chemotherapy and monoclonal antibodies. The survival rates are 85% in children and 50% in adults. The DNA methylation in CLL cases was determined by microarray studies. It could be demonstrated that CLL is affected by CpG island methylation in some genes that segregate with CD38 expression levels.Citation51 The CpG island methylation in certain functional gene groups and pathway-associated genes that are known to be deregulated in CLL provides insights into the CLL methylome.
Acute promyelocytic leukaemia
A subtype of AML is the acute promyelocytic leukaemia (APL). In APL the promyelocytic leukaemia-retinoic-acid alpha receptor acts as transcriptional repressor and blocks the neutrophil differentiation. By microarray studies, signature genes which are deregulated in APL could be indentified. This was done by comparing gene expression profiles of APL cells and normal PM cells at the same stage of differentiation.Citation52 It could be found that the gene expression and transcriptional of APL cells show properties like stem cell. Candidate drugs and drug targets for therapeutic interventions could be identified, leading to the effective drug treatment of individual leukaemia patients.
T-cell acute lymphoblastic leukaemia
T-cell acute lymphoblastic leukaemia is a subtype of acute lymphocytic leukaemia. It is a heterogenic disease. The clinical features of T-ALL are not predictive for diagnosis and therefore an adequate and optimal therapeutic treatment is not possible. By microarray analysis of T-ALL gene expressions, several clinically relevant molecular subtypes could be identified. Five different multistep molecular pathways have been detected that lead to T-ALL by activating different oncogenes.Citation53 By supervised automated learning, a group of signature genes with expression values that enable to distinguish high-risk patients could be identified. For example: overexpression of the HOX11 genes occurs in 5–10% of childhood and 30% of adult T-ALL cases. For patients with HOX11-positive lymphoblasts which are treated with combination chemotherapy an excellent prognosis is possible. Patients at high risk of early failure are included in TAL1- and LYL1-positive groups.
Outlook
Beside the presented investigations of leukaemia types, there are further microarray analyses in haematology.Citation54–Citation59 A microarray experiment enables the investigation of the transcriptomic alterations in tumour cells. But the functional mRNA does not completely reflect the tumour biology due to several preceding modifications of the transcription product in the cell nuclei such as alternative splicing; successive post-translational modifications, etc. Additionally, the influence of carcinogenic alterations on the translation process is not considered. The resulting modified proteins cause alterations in the cellular process, which are of importance for our understanding of diseases and their treatments. Therefore, the integrated analysis of genomic and proteomic data is essential for understanding the underlying factors that are involved in cancer. This leads to an increasing need of fusing microarray data with other genome-wide data such as genomic; proteomic and epigenomic data. Currently, such data result from the integration of microarray and mass spectrometry technologies. Subsequently, novel computational approaches, enabling the extraction of meaningful data, are needed. Goal of these efforts is to develop bioinformatics methods with optimal sensitivity, specificity, and predictive capabilities. DNA microarray technologies are currently moving from research projects to clinical diagnostics. Clinical validation of different array designs and technical platforms will be of growing importance in the near future.
References
- Golub TR, Slonim DK, Tamayo P, Huard C, Gaasenbeek M, Mesirov JP, et al.. Molecular classification of cancer: class discovery and class prediction by gene expression monitoring. Science 1999;286(5439):531–7.
- Perou CM, Sørlie T, Eisen MB, van de Rijn M, Jeffrey SS, Rees CA, et al.. Molecular portraits of human breast tumours. Nature 2000;406(6797):747–52.
- Forus A, Sørlie T, Børresen-Dale AL, Myklebost O. Microarray technology–potential in cancer research. Tidsskr Nor Laegeforen 2001;121(21):2498–503.
- Shen Y, Wu BL. Microarray-based genomic DNA profiling technologies in clinical molecular diagnostics. Clin Chem 2009;55(4):659–69.
- Bejjani BA, Theisen AP, Ballif BC, Shaffer LG. Array-based comparative genomic hybridization in clinical diagnosis. Expert Rev Mol Diagn 2005;5(3):421–9.
- Geyer FC, Decker T, Reis-Filho JS. Genome-wide expression profiling as a clinical tool: are we there yet? Pathologe 2009;30(2):141–6.
- Hoek KS. Melanoma progression, gene expression and DNA microarrays. G Ital Dermatol Venereol 2009;144(1):39–49.
- Chun H, Lee DS, Kim HC. Bio-cell chip fabrication and applications. Methods Mol Biol 2009;509:145–58.
- Dufva M. Microchips for cell-based assays. Methods Mol Biol 2009;509:135–44.
- Liotta L, Petricoin E. Molecular profiling of human cancer. Nat Rev Genet 2000;1:48–56.
- Schena M, Shalon D, Davis RW, Brown PO. Quantitave monitoring of gene expression patterns with a complementary DNA microarray. Science 1995;270(5235):467–70.
- DeRisi JL, Iyer VR, Brown PO. Exploring the metabolic and genetic control of gene expression on a genomic scale. Science 1997;278(5338):680–6.
- Lockhart DJ, Winzeler EA. Genomics, gene expression and DNA arrays. Nature 2000;405(6788):827–36.
- Young RA. Biomedical discovery with DNA arrays. Cell 2000;102(1):9–15.
- Zhang MQ. Large-scale gene expression data analysis: a new challenge to computational biologists. Genome Res 1999;9(8):681–8.
- Schimek MG, Wiltgen M. Microarray gene expression analysis basics for biometricians. Colloquium Biometryczne 2004;34a:141–59.
- Sherlock G, Hernandez-Boussard T, Kasarskis A, Binkley G, Matese JC, Dwight SS, et al.. The Stanford Microarray database. Nucleic Acids Res 2001;29:152–5.
- Tseng GC, Oh M, Rohlin L, Liao JC, Wong WH. Issues in cDNA microarray filtering: quality filtering, channel normalization, models of variations and assessment of gene effects. Nucleic Acids Res 2001;29:2549–57.
- Churchill GA. Fundamentals of experimental design for cDNA microarrays. Nat Genet 2002;32:490–5.
- Yang YH, Speed T. Design issues for cDNA microarray experiments. Nat Rev Genet 2002;3:579–88.
- Kooperberg C, Fazzio TG, Delrow JJ, Tsukiyama T. Background correction for spotted DNA microarrays. J Comput Biol 2002;9:55–66.
- Quackenbush J. Microarray data normalization and transformation. Nat Genet 2002;32:496–501.
- Clarke PA, te Poele R, Wooster R, Workman P. Gene expression microarray analysis in cancer biology, pharmacology and drug development: progress and potential. Biochem Pharmacol 2001;62:1311–36.
- Wiltgen M, Tilz GP. DNA microarray analysis: principles and clinical impact. Hematology 2007;12(4):271–87.
- Alon U, Barkai N, Notterman DA, Gish K, Ybarra S, Mack D, et al.. Broad patterens of gene expression revealed by clustering analysis of tumour and normal colon tissues probed by oligonucleotide arrays. Proc Natl Acad Sci USA 1999;96:6745–50.
- Eisen MB, Spellman PT, Brown PO, Botstein D. Cluster analysis and display of genome-wide expression patterns. Proc Natl Acad Sci USA 1998;95:14863–8.
- Wen X, Fuhrman S, Michaels GS, Carr DB, Smith S, Barker JL, et al. Large-scale temporal gene expression mapping of CNS development. Proc Natl Acad Sci USA 1998;95:334–9.
- Tavazoie S, Hughes JD, Campbell MJ, Cho RJ, Church GM. Systematic determination of genetic network architecture. Nat Genet 2000;22:281–5.
- Herwig R, Poustka A, Müller C, Bull C, Lehrach H, O’Brien J. Large-scale clustering of genetic fingerprinting data. Genome Res 1999;9:1093–105.
- Tamayo P, Slonim D, Mesirov J, Zhu Q, Kitareewan S, Dmitrovsky E, et al.. Interpreting patterns of gene expression with self-organizing maps: methods and applications to hematopoietic differentiation. Proc Natl Acad Sci USA 1999;96:2907–12.
- Törönen P, Kolehmainen M, Wong G, Castren E. Analysis of gene expression data using self-organizing maps. FEBS Lett 1999;451:142–6.
- Brown M, Grundy W, Lin D, Christianini N, Sugnet C, Furey TS, et al.. Knowledge-based analysis of microarray gene expression data using support vector machines. Proc Natl Acad Sci USA 1999;97:262–7.
- Cristianini N, Shawe-Taylor J. An introduction to support vector machines. Cambridge: Cambridge University Press, 2000.
- Furey TS, Christianini N, Duffy N, Bednarski DW, Schummer M, Haussler D. Support vector machine classification and validation of cancer tissue samples using microarray expression data. Bioinformatics 2000;16:906–14.
- Brown MPS, Grundy WN, Lin D, Christianini N, Sugnet C, Ares M, et al.. Support vector machine classification of microarray gene expression data. UCSC-CRL-99-9, Department of Computer Science, University of California Santa Cruz, 1999.
- Gaasterland T, Bekiranov S. Making the most of microarray data. Nat Genet 2000;24(3):204–6.
- Minsky M, Papert S. Perceptrons. Cambridge, MA: MIT Press; 1969.
- Shawe-Taylor J, Cristianini N. Kernel methods for pattern analysis. Cambridge: Cambridge University Press; 2004.
- Cortes C, Vapnik V. Support vector networks. Machine Learning 1995;20(3):273–97.
- Wallentine JC, Perkins SL, Tripp SR, Bruggman RD, Bayerl MG. Diffuse large B-cell lymphoma with coexpression of CD3 in a pediatric patient: a case report, review of the literature, and tissue microarray study. J Pediatr Hematol Oncol 2009;31(2):124–7.
- Jabłońska J, Jesionek-Kupnicka D. Usefulness of immunohistochemistry in identification of prognostically important subgroups (GCB and ABC) in a heterogeneous group of diffuse large B-cell lymphomas-a review article. Pol J Pathol 2008;59(3):121–7.
- de Jong D, Xie W, Rosenwald A, Chhanabhai M, Gaulard P, Klapper W, et al.. Immunohistochemical prognostic markers in diffuse large B-cell lymphoma: validation of tissue microarray as a prerequisite for broad clinical applications (a study from the Lunenburg Lymphoma Biomarker Consortium). J Clin Pathol 2009;62(2):128–38.
- Jehan Z, Siraj AK, Abubaker J, Ruiz C, Simon R, Sultana M, et al.. Distinct gene expression profiles: nodal versus extranodal diffuse large B-cell lymphoma. Oncology 2008;75(1–2):71–80.
- Jang KY, Hwang SH, Kwon KS, Kim KR, Choi HN, Lee NR, et al.. SIRT1 expression is associated with poor prognosis of diffuse large B-cell lymphoma. Am J Surg Pathol 2008;32(10):1523–31.
- Haferlach T, Kohlmann A, Wieczorek L, Basso G, Kronnie GT, Béné MC, et al.. Clinical utility of microarray-based gene expression profiling in the diagnosis and subclassification of leukemia: report from the International Microarray Innovations in Leukemia Study Group. J Clin Oncol 2010;28(15):2529–37.
- Berg T, Fliegauf M, Burger J, Staege MS, Liu S, Martinez N, et al.. Transcriptional upregulation of p21/WAF/Cip1 in myeloid leukemic blasts expressing AML1-ETO. Haematologica 2008;93(11):1728–33.
- Baldus CD, Bullinger L. Gene expression with prognostic implications in cytogenetically normal acute myeloid leukemia. Semin Oncol 2008;35(4):356–64.
- Suzuki T, Ishigami Y, Okada N, Kaneko A, Fukutomi R, Isemura M. Differentiation- associated alteration in gene expression of importins and exportins in human leukemia HL-60 cells. Biomed Res 2008;29(3):141–5.
- Marcucci G, Radmacher MD, Maharry K, Mrózek K, Ruppert AS, Paschka P, et al.. MicroRNA expression in cytogenetically normal acute myeloid leukemia. J Clin Oncol 2008;26(31):5078–87.
- Cowan-Jacob SW, Fendrich G, Floersheimer A, Furet P, Liebetanz J, Rummel G, et al.. Structural biology contributions to the discovery of drugs to treat chronic myelogenous leukaemia. N Engl J Med 2008;358(18):1919–28.
- Rahmatpanah FB, Carstens S, Hooshmand SI, Welsh EC, Sjahputera O, Taylor KH, et al.. Large-scale analysis of DNA methylation in chronic lymphocytic leukemia. Epigenomics 2009;1(1):39–61.
- Marstrand TT, Borup R, Willer A, Borregaard N, Sandelin A, Porse BT, et al.. A conceptual framework for the identification of candidate drugs and drug targets in acute promyelocytic leukemia. Leukemia 2010;24(7):1265–75.
- Ferrando AA, Look AT. Gene expression profiling in T-cell acute lymphoblastic leukemia. Semin Hematol 2003;40(4):274–80.
- Okamoto R, Ogawa S, Nowak D, Kawamata N, Akagi T, Kato M, et al.. Genomic profiling of adult acute lymphoblastic leukemia by single nucleotide polymorphism oligonucleotide microarray and comparison to pediatric acute lymphoblastic leukemia. Haematologica 2010;95(9):1481–8.
- Haouas H, Haouas S, Uzan G, Hafsia A. Identification of new markers discriminating between myeloid and lymphoid acute leukemia. Hematology 2010;15(4):193–203.
- Hömme C, Krug U, Tidow N, Schulte B, Kühler G, Serve H, et al.. Low SMC1A protein expression predicts poor survival in acute myeloid leukemia. Oncol Rep 2010;24(1):47–56.
- Verhaak RG, Valk PJ. Genes predictive of outcome and novel molecular classification schemes in adult acute myeloid leukemia. Cancer Treat Res 2010;145:67–83.
- Leuenberger M, Frigerio S, Wild PJ, Noetzli F, Korol D, Zimmermann DR, et al.. AID protein expression in chronic lymphocytic leukemia/small lymphocytic lymphoma is associated with poor prognosis and complex genetic alterations. Mod Pathol 2010;23(2):177–86.
- Burguillo FJ, Martin J, Barrera I, Bardsley WG. Meta-analysis of microarray data: the case of imatinib resistance in chronic myelogenous leukemia. Comput Biol Chem 2010;34(3):184–92.