Abstract
In haematological malignancy, cell-mediated immunity has been shown to be suppressed in advanced disease. This immune dysfunction may be due, in part, to altered expression of the T cell receptor (TCR)–CD3 complex. The distribution and clonality of the TCR Vbeta repertoire and the expression levels of CD3gamma, CD3delta, CD3epsilon, and CD3zeta genes in T cells from patients with multiple myeloma (MM) were investigated. Specific Vbeta subfamily primers, reverse transcription polymerase chain reaction, and the GeneScan® technique were used to analyse the expression of the TCR Vbeta subfamily and the clonality of Vbeta T cells in 11 patients with MM. Real-time reverse transcription polymerase chain reaction was used to detect the expression levels of CD3gamma, CD3delta, CD3epsilon, and CD3zeta genes in peripheral blood mononuclear cells from 19 patients with MM. The beta2-microglobulin gene was used as an endogenous reference. A total of 5–22 Vbeta subfamily T cells were detected in different patients (mean value of expressed Vbeta subfamilies was 12·55±6·11), whereas all 24 Vbeta genes were identified in all control samples. The most frequently expressed Vbeta subfamilies were Vbeta1 (100%), Vbeta2, Vbeta3, Vbeta9, Vbeta13, and Vbeta16 (81·8%), while the expression of Vbeta20 was undetectable in all MM samples. Oligoclonal expansion of one or more Vbeta subfamily of T cells was detected in all patients. Such expansions involved different MM stages, and the numbers of expanded clonal Vbeta subfamilies seemed higher in stage I/II groups than in stage III; however, there was no significant difference. Among MM samples, of the Vbeta subfamily members, Vbeta13, Vbeta1, and Vbeta21, were expanded most frequently. A significant decrease in the expression level of the CD3gamma gene was observed in MM samples; in contrast, a higher expression of CD3epsilon was found in the MM group than in the healthy group. The expression pattern of the four CD3 chains was epsilon>zeta>delta>gamma in peripheral blood mononuclear cells from MM, while a gamma>epsilon>zeta>delta expression pattern was found in healthy controls. In conclusions, the present study presents precise data on changes in the variability of Vbeta patterns and expression of TCR signal transduction molecules in MM patients compared to controls, which may be associated with immune dysfunction. This study contributes to a better understanding of the cellular immune features in MM patients.
Introduction
Multiple myeloma (MM) is a B-cell malignancy characterized by the accumulation and proliferation of clonal plasma cell-producing immunoglobulin in bone marrow, leading to the gradual replacement of normal haemopoiesis. MM accounts for ∼10% of all haematological malignancies.Citation1
In patients with haematological malignancies, cell-mediated immunity is often suppressed, being most profound in those with advanced disease. Such immune dysfunction, as demonstrated in many patients with leukaemia, may be due to reduced thymic output, skewed expression of T cell receptor (TCR) repertoire, and/or altered expression of the TCR–CD3 complex.Citation2–Citation6 Various phenotypic and functional abnormalities, not only of B cells but also of T cells, have been recognized in MM patients.Citation7–Citation9 The first investigation of changes in cellular immunity in MM patients showed significantly lower peripheral blood mononuclear cell (PBMC) responses to CD3 monoclonal antibodies and phytohaemagglutinin, as well as a lower ratio of CD45RA to CD45RO in both CD4 and CD8 subpopulations, indicating that T cells from MM patients require significantly fewer accessory signals to fully express the IL-2 receptor, secrete IL-2, and proliferate on multivalent cross-linking of the CD3–TCR complex.Citation10
Most circulating mature T cells use the alpha/beta heterodimeric TCR for specific recognition of antigenic peptides in major histocompatibility complex molecules. T cell differentiation in the thymus is characterized by a hierarchical order of rearrangement steps in the TCR genes, resulting in the joining of multiple variable (V), diversity (D), or joining (J) gene segments. Specific recognition of an antigen results in a clonal expansion of T cells expressing unique Vbeta genes with a characteristic CDR3 size.Citation11 Analysis of TCRbeta CDR3 size distribution has been used to define the degree of T cell clonality in complex cell populations.Citation12 Oligoclonal T cells have been identified among tumour infiltrating T cells and peripheral blood T cells in some malignancies and in autoimmune diseases.Citation13,Citation14 Several studies on TCR Vbeta repertoire have shown that skewed expression of Vbeta subfamilies is a common feature in leukaemia patientsCitation3,Citation4,Citation15 and that clonally expanded T cells, with restricted Vbeta usage, recognize tumour cells in patients with malignant disease.Citation16,Citation17
The first demonstration that rearranged TCRbeta genes can occur in MM was described by Berenson and Lichtenstein,Citation18 who described the arrangement of the TCRbeta gene in 14 patients with MM using southern blot and found only clonal rearrangement in marrow T cells from one patient with stage IIA IgA-lambda myeloma. Another study that used an extensive range of TCR V-region-specific monoclonal antibodies assessed TCR Valpha and TCR Vbeta expressions in patients with myeloma and paraproteinaemia.Citation19 Using reverse transcription polymerase chain reaction (RT-PCR) and GeneScan® analyses (ABI, Foster City, CA, USA), the expanded TCR Vbeta T-cell clones can be identified in both CD4+ and CD8+ T cells in the peripheral blood from MM patients.Citation20–Citation22 The majority of these T cell expansions (monoclonal or biclonal) have the cytotoxic T cell phenotype (CD8+, CD57+, and perforin positive),Citation23,Citation24 which might indicate the ability of a host T cell immune response to an anti-MM-associated antigen. However, little is known regarding the details of the specific response of anti-MM cells in these clonally expanded T cells.
Antigen recognition of T cells is based on a heterodimer composed of either the TCR alpha beta chain or the TCR gamma delta chain, which is asociated with four transmembrane proteins named CD3gamma, CD3delta, CD3epsilon, and CD3zeta.Citation25,Citation26 They form three distinct dimers, namely, CD3gamma epsilon, CD3delta epsilon, and CD3zeta zeta.Citation27–Citation30
The absence of the CD3zeta chain not only influences TCR expression on the cell membrane and the number of single positive (CD4+ or CD8+) circulating T cells, but also impairs the proliferative response and the level of activation of mature T cells. T cells from patients with systemic lupus erythematosus,Citation31 aplastic anaemia,Citation32 and leukaemiaCitation6,Citation33 are all functionally impaired as indicated by decreased CD3zeta chain expression. CD3zeta chain expression is significantly downregulated in all T cell subsets in more than 90% of chronic myeloid leukaemia (CML) patients, and such abnormalities result in increased ex vivo susceptibility to apoptosis.Citation5 CD3zeta chain expression in CD4+ and CD8+ T cells from MM patients was found to be markedly reduced, particularly in advanced stage MM.Citation34 In addition, there was a significantly lower expression of the CD3epsilon chain in CML patients.Citation5
Patients with primary immunodeficiency diseases may exhibit a deficiency of CD3gamma, CD3delta, or CD3epsilon.Citation30 Homozygous mutation of CD3delta and CD3epsilon genes leads to a complete block of T cell development and thus to an early-onset severe combined immunodeficiency phenotype.Citation30 Deficiency of CD3gamma may cause partial T cell immunodeficiency.Citation30 However, there is no information about the change in the expression levels of CD3gamma, CD3delta, or CD3epsilon in cancer patients.
The TCR–CD3 complex plays a key role in T cell activation and TCR signal transduction. Although there now seems to be significant evidence to support a role for T cells in the immunoregulation of MM,Citation34 little is known about the features of their repertoire distribution and expression profile in MM patients. To further examine the characteristics of immunodeficiency in MM patients, we investigated the distribution and clonality of the TCR Vbeta repertoire and the expression levels of signaling transduction factors CD3gamma, CD3delta, CD3epsilon, and CD3zeta genes in T cells from patients with MM.
Materials and Methods
Samples
The study included 19 de novo and untreated MM patients (14 males and 5 females with a median age of 51 years and a range of 36–68 years). According to the clinical staging system of Durie and Salmon,Citation35 six patients were classified as Stage I, five were Stage II, and eight were Stage III. The clinical data of the patients are listed in . The samples were collected at Department of Hematology, Guangdong Province People’s Hospital, and all the procedures were conducted according to the guidelines of the Medical Ethics Committees of the Health Bureau of Guangdong Province of China. A total of 11 cases were used for TCR Vbeta repertoire analysis, and all 19 cases were used for CD3 gene analysis. A total of 19 healthy individuals (9 males and 10 females with a median age of 53 years and a range of 25–72 years) served as the control group.
Table 1. Clinical data of MM patients
RNA isolation and cDNA synthesis
Ficoll–Hypaque gradient centrifugation was used to isolate PBMCs. RNA was extracted from the PBMCs of MM and healthy individuals according to the manufacturer’s recommendations (TRIzol; Invitrogen, Carlsbad, CA, USA). The quality of RNA was analysed in 0·8% agarose gel stained with ethidium bromide. RNA of 2 μg was reversely transcribed into the first single-strand cDNA with random hexamer primers using reverse transcriptase Superscript II Kit (Gibco; Invitrogen). The quality of cDNA was confirmed by RT-PCR for beta2 microglubin (beta2M) gene amplification.
RT-PCR for TCR Vbeta subfamily amplification
Twenty-four TCR Vbeta sense primers and a single TCR Cbeta primer were used in unlabelled PCR for amplification of the TCR Vbeta subfamilies. Subsequently, a runoff PCR was performed with fluorescent primers labelled at the 5′ end with the FAM fluorophore (Cbeta-FAM), the sequences of these primers are described in a previous study.Citation36 PCR was performed as described by Puisieux et al.Citation14 Aliquots of the cDNA (1 μl) were amplified in 25 μl reactions with one of 24 Vbeta primers and a Cbeta primer. The final reaction mixture contained 0·5 μM sense primer and antisense primer, 0·1 mM dNTP, 1·5 mM MgCl2, 1×PCR buffer, and 1·25 U Taq polymerase (Promega, Madison, WI, USA). The amplification was performed on a DNA thermal cycler (BioMetra, Goettingen, Germany). After 3-minute denaturation at 94°C, 40 PCR cycles were performed, each cycle at 94°C for 1 minute, 60°C for 1 minute, and 72°C for 1 minute, with a final 7-minute elongation at 72°C.Citation3,Citation14
GeneScan analysis for TCR Vbeta subfamily clonality analysis
Aliquots of the unlabelled PCR products (2 μl) were subjected to a cycle of runoff reaction with fluorophore-labelled Cbeta-FAM primers. The labelled runoff PCR products (2 μl) were heat-denatured at 94°C for 4 minutes with 9·5 μl formamide (Hi-Di Formamide; ABI) and then 0·5 μl Size Standards (GeneScan-500-LIZTM; PerkinElmer, ABI) was loaded onto a 3100 POP-4TM gel (Performance Optimized Polymer-4; ABI) and resolved by electrophoresis in a 3100 DNA sequencer (PerkinElmer, ABI) for size and fluorescence intensity determination using GeneScan software.Citation3,Citation14
Real-time relative quantitative PCR for CD3gamma, delta, epsilon, and zeta genes
Real-time PCR using the SYBR Green I technique was used to examine CD3gamma, delta, epsilon, and zeta gene expression levels in cDNA of PBMCs from 19 patients. The sequence of primers used in the study was described as previous study.Citation38 PCR was performed as described by Stams et al.Citation37,Citation38 Briefly, PCR of a 25-μl total volume was performed with ∼1 μl cDNA, 0·5 μM each primer (CD3gamma/delta/epsilon/zeta-for and CD3gamma/delta/epsilon/zeta-back primers for CD3gamma, CD3delta, CD3epsilon, and CD3zeta, and beta2M-for and beta2M-back primers for beta2M gene amplification), and 11·25 μl 2·5×RealMastrMix (Tiangen, Beijing, China). After initial denaturation at 95°C for 2 minutes, 45 cycles consisting of the following procedures were performed using MJ Research DNA Engine Opticon 2 PCR cycler (BIO-RAD, Hercules, CA, USA): 15 seconds at 95°C; 1 minute at 58·9°C for beta2M and CD3gamma, 60°C for CD3zeta, 60·8°C for CD3delta, and 62°C for CD3epsilon; and 1 second at 82°C. The relative mRNA expression levels of CD3gamma, delta, epsilon, and zeta in each sample were calculated using the comparative cycle time (Ct) method.Citation37,Citation38 Briefly, the target PCR Ct value (the cycle number at which emitted fluorescence exceeds 10×SD of baseline emissions) is normalized by subtracting the beta2M Ct value from the target PCR Ct value, which gives the ΔCt value. From this ΔCt value, the relative expression level of beta2M for each target PCR can be calculated using the following equation: where x is anyone of CD3gamma, delta, epsilon, or zeta genes.Citation37,Citation38
Statistical analysis
Univariate analyses were performed using the Mann–Whitney test to compare the means of detectable TCR Vbeta subfamilies between MM and control groups. The Mann–Whitney test was also used to compare the expression levels of CD3 genes between the two groups. The chi-square test was used to compare the frequencies of TCR Vbeta subfamily expression between the groups; the Kruskal–Wallis test was used to compare the expression levels of CD3 genes in different MM stages; and Spearman’s correlation analysis was used to estimate the correlation between different gene expression levels from different CD3 genes. Only values with P<0·05 were considered statistically significant.
Results
The expression pattern of TCR Vbeta repertoire in patients with MM
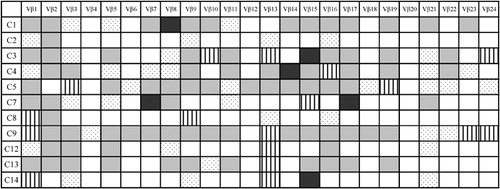
Expression of the 24 TCR Vbeta subfamily genes was analysed in peripheral blood T cells from 11 MM patients. A total of 5–22 Vbeta subfamily T cells were detected in different patients. The mean value of the number of expressed Vbeta subfamilies was 12·55±6·11, whereas all 24 TCR Vbeta genes were identified in all control samples (P<0·0001). The numbers of expressed Vbeta subfamilies were higher in Stage I (12·40±5·50, n = 5) and Stage II (12·33±8·74, n = 3) groups than in Stage III (9·00±3·61, n = 3); however, there was no statistical significance. The most frequently expressed Vbeta subfamilies were Vbeta1 (100%) and Vbeta2, Vbeta3, Vbeta9, Vbeta13, and Vbeta16, which were detected in nine of 11 cases (81·8%), while the expression of Vbeta20 was undetectable in all MM samples ().
Figure 1. Clonality pattern of expressed TCR Vbeta subfamilies from PBMCs in patients with MM. : polyclonality;
: oligoclonality;
: biclonality;
: oligoclonal tendency.
Clonally expanded T cells in peripheral blood of MM patients
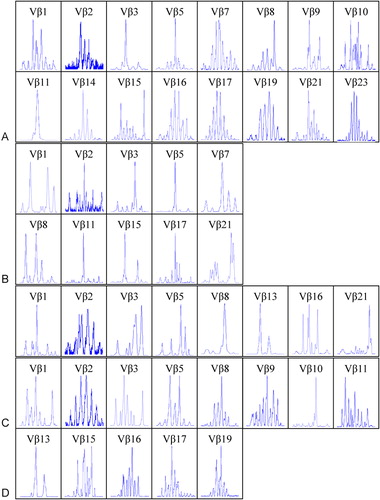
The clonality of TCR Vbeta T cells were identified by GeneScan analysis of CDR3 size TCR Vbeta subfamilies. Oligoclonal expansion of one or more TCR Vbeta subfamily of T cells was detected in all patients. In most cases, more than four Vbeta subfamilies displayed clonal expansion. Eight clonally expanded Vbeta subfamily T cells were found in two cases, and seven were found in the other two cases. The expansions involved different MM stages, and the number of clonally expanded Vbeta subfamilies was higher in Stage I (6·40±1·82, n = 5) and Stage II (5·00±1·73, n = 3) groups than in Stage III (3·67±2·52, n = 3); however, there was no significant difference in multiple clonally expanded Vbeta subfamilies between different MM stages (). Among MM samples, the most frequently expanded subfamily members were Vbeta13 (seven of 11 cases) and Vbeta1 and Vbeta21 (six of 11 cases). The clonally expanded T cells were distributed in most Vbeta subfamilies, with the exception of Vbeta2, Vbeta12, and Vbeta17 ( and ). In contrast, multiple peaks were found in all PCR products of TCR Vbeta from control peripheral blood (data not shown).
Figure 2. The results of GeneScan of TCR Vbeta subfamilies in PBMCs from four cases with MM. (A) C1 (Stage I), (B) C7 (Stage II), (C) C12 (Stage III), and (D) C13 (Stage III). Clonal expanded T cells could be found in Vbeta3 (A, B), Vbeta5 (A, B), Vbeta8 (C), Vbeta10 (D), Vbeta11 (A, B), Vbeta13 (C, D), Vbeta15 (B) and Vbeta21(C).
Expression pattern of CD3gamma, delta, epsilon, and zeta genes in MM
The expression levels of CD3gamma, CD3delta, CD3epsilon, and CD3zeta genes in cDNA of PBMCs from 19 MM patients and 19 age-matched healthy individuals were quantitatively assessed by real-time PCR using the SYBR Green I technique.
All four genes were detected in every healthy sample. However, among MM samples, the CD3gamma and CD3delta genes were absent in sample C16 (Stage III); the CD3gamma gene was also absent in C4 (Stage I).
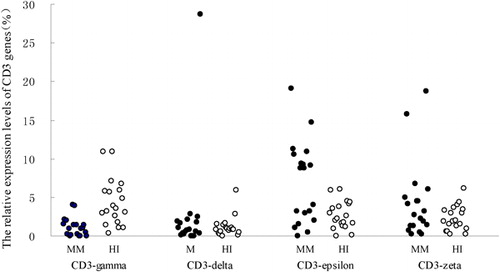
A significantly lower expression level of the CD3gamma gene (mean rank = 12·74%) was observed in MM samples compared to healthy controls (mean rank = 26·26%; P<0·0001); in contrast, a higher expression of CD3epsilon was found in the MM group (mean rank = 23·66%) than in controls (mean rank = 15·34%; P = 0·021). There was no significant difference in CD3delta (mean rank = 19·0% versus 20·0%) and CD3zeta (mean rank = 21·29% versus 17·71%) expression levels between MM and healthy groups (P = 0·781 and P = 0·321, respectively; ).
Figure 3. The relative expression levels of CD3gamma, CD3delta, CD3epsilon, and CD3zeta genes in PBMCs from MM and healthy (HI) groups.
Because the expression levels of CD3 genes may be affected by the advancement of disease and tumour burden, we further analysed its expression in different MM stages using the Kruskal–Wallis test. It did not differ significantly for any of the genes [CD3gamma: mean rank = 11·08, 12·42, and 7·00% for Stages I, II, and III, respectively (P = 0·190); CD3delta: mean rank = 9·33, 12·60, and 8·88% (P = 0·479); CD3epsilon: mean rank = 10·50, 10·40, and 9·38% (P = 0·918); CD3zeta: mean rank = 9·33, 11·80, and 9·38% (P = 0·707)].
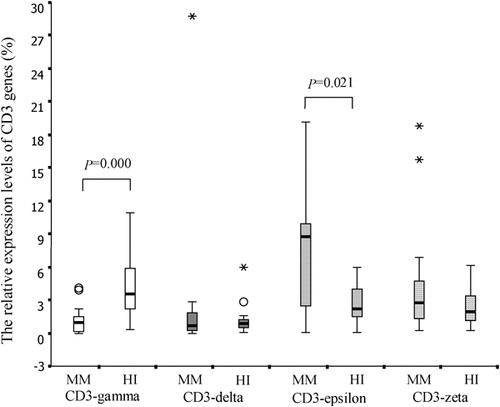
The expression pattern of the four CD3 chains was epsilon>zeta>delta>gamma in MM PBMCs. In contrast, that in healthy control PBMCs was gamma>epsilon>zeta>delta (). Spearman’s correlation analysis was performed for the relative expression levels of the CD3gamma, delta, epsilon, and zeta chain genes. There was a significant positive correlation between the relative expression levels of CD3gamma and CD3delta (rs = 0·556, P = 0·013), CD3gamma and CD3epsilon (rs = 0·654, P = 0·002), CD3gamma and CD3zeta (rs = 0·636, P = 0·003), CD3delta and CD3epsilon (rs = 0·467, P = 0·044), CD3delta and CD3zeta (rs = 0·835, P<0·0001), and CD3epsilon and CD3zeta (rs = 0·791, P<0·0001).
Figure 4. The pattern of CD3 genes expression levels in PBMCs from 19 cases with MM and healthy controls (HI). Significant difference was found in CD3gamma and CD3epsilon groups.
Discussion
In haematological malignancy, cell-mediated immunity is suppressed with advanced disease. The abnormal expression of the TCR repertoire and altered expression of the TCR–CD3 complex may be the primary reasons for T cell immunodeficiency.Citation39
TCR Valpha/Vbeta repertoire analysis was used to evaluate TCR Valpha/Vbeta subfamily distribution and clonally expanded T cells.Citation11 T cell clonal absence in cancer patients, which can be identified by TCR Valpha/Vbeta repertoire analysis, indicates T cell immunodeficiency; however, clonal expansion is thought to be a specific anti-cancer response.Citation14 In healthy individuals, diverse TCR Vbeta repertoires and polyclonal CDR3 size characteristics for T cells indicate the random rearrangement of TCR Vbeta genes in the thymus.Citation40 Few attempts have been made to characterize TCR Vbeta usage in different types of haematological malignancies, and most previous studies have reported a restricted TCR Vbeta repertoire and oligoclonal expansion of T cells.Citation3,Citation4,Citation7,Citation15,Citation41 Restricted expression and clonally expanded TCR Vbeta T cells in MM patients have been identified by southern blot, flowcytometry, and RT-PCR.Citation18–Citation24 In the present study, we analysed the expression and clonal expansion patterns of TCR Vbeta T cells in Chinese MM patients. Restricted expression of TCR Vbeta subfamily genes was found in all patients, which is similar to the results of other reports;Citation18–Citation24 however, the expression pattern and frequently expressed Vbeta subfamilies [Vbeta1 (100%), Vbeta2, Vbeta3, Vbeta9, Vbeta13, and Vbeta16 (all 81·8%)] might show different features in Chinese patients. In the present study, oligoclonal TCR Vbeta subfamily T cells were detected in all MM patients. Clonally expanded TCR Vbeta subfamily T cells were found most frequently in Vbeta13, Vbeta1, and Vbeta21, which differs from other reports (e.g., Vbeta3, Vbeta5, and Vbeta22 were identified by Halapi et al.Citation20). The different expression patterns of the TCR Vbeta repertoire and distribution of clonally expanded TCR Vbeta subfamily T cells might be due to the difference in dominant usage of the TCR Vbeta repertoire in individuals of different ethnicities and human leukocyte antigen typing.
Unlike in some leukaemia cases and solid cancers in which specific tumour antigens have been identified (such as MART-1 in melanoma or bcr-abl in CML, bcr-abl fusion proteins are CML-specific antigens that can elicit specific anti-CML cytotoxic T cells;Citation42 with the exception of the idiotype,Citation20 the specific tumour antigen in MM is unclear. Polymorphic epithelial mucin (MUC1) was detected in myeloma cells and in sera of MM patients. Human leukocyte antigen-unrestricted CTL that recognizes tumour-associated epitopes on MUC1 is induced in MM patients.Citation43 In the present study, the clonally expanded Vbeta T cells were a consequence of a host-specific immune response to MM-associated antigens. Further work is needed to identify the relevance of such T cells to MM cell proliferation.
Clonally expanded T cells are associated with a better prognosis.Citation22 Multiple expanded CD8+ T cells (two or more) are more common in monoclonal gammopathy of undetermined significance and MM I patients than in those with advanced disease MM II/III.Citation20 Similar results were found in the present study. When we compared the expression and numbers of clonally expanded Vbeta subfamilies in different MM stages, we found that the frequency of expression and numbers of clonally expanded Vbeta subfamilies was: Stage I>Stage II>Stage III. However, no significant difference in the number of clonally expanded Vbeta subfamilies was found between different MM stages. Further work is needed to analyse more samples and follow up on the outcome of the MM patients.
To gain more insight into the TCR–CD3 complex and the transduction of TCR signals, which is important for T cell activation, we analysed the expression levels of all four CD3 genes (CD3gamma, CD3delta, CD3epsilon, and CD3zeta) in PBMCs from MM patients. All four genes were detected in most MM samples. Deregulation of CD3zeta gene expression has been identified in several types of leukaemia, including CML, T-lineage acute lymphoblastic leukaemia, and B cells-chronic lymphocytic leukaemia,Citation4,Citation5,Citation34,Citation44 which is thought to be related to T cell immunodeficiency. In the present study, the expression level of CD3zeta was not significantly different between the MM and healthy groups. This differs from the results by Mozaffari et al.,Citation34 which reported a marked reduction in the proportion of CD4 and CD8 cells expressing CD3zeta, as well as CD28, CD152, p56lck, ZAP-70, and PI3-k, particularly in advanced stage MM. In contrast, we found lower expression levels of the CD3gamma gene in MM samples. No information exists regarding the downregulation of CD3gamma in cancer or leukaemia, which may be a feature in Chinese MM patients. All T cell responses are reduced or abrogated in T cells derived from CD3gamma null-mutant mice, probably due to decreased expression levels of the mature TCR complex lacking CD3gamma.Citation45 Thus, low expression of CD3gamma in MM might be a new feature related to T cell immunodeficiency, unlike CD3zeta downregulation in some solid tumours and leukaemia patients.
Interestingly, we found greater expression of CD3epsilon in MM patients than in healthy controls. There are no comparisons of the expression patterns of all CD3 genes in leukaemia or other diseases. In the present study, we analysed the expression patterns of all four CD3 genes, and not only demonstrated lower expression in one of these genes, but also found overexpression in another. Studies using gene-specific mutations in mice have identified an essential role of CD3 genes in T cell development;Citation46 however, further research has indicated that signals transduced by CD3epsilon are not specifically required for T cell maturation, but instead contribute quantitatively to TCR signaling.Citation47 This suggests that, in the case of CD3gamma downregulation, the overexpression of CD3epsilon in MM might contribute in a similar manner as the semi-conserved functional motif, immunoreceptor tyrosine-based activation motif, does in TCR signaling. However, in the present study, all CD3 gene expression levels had a significantly positive correlation. This means that higher expression levels of all CD3 genes might exist in some cases, while lower expression levels might exist in others. Thus, differences in activation of TCR signal transduction might be found in different individuals. The question remains whether the role of CD3epsilon overexpression contributes in the way immunoreceptor tyrosine-based activation motif supplementary does in TCR signaling in MM patients, because the results did not show a complementary phenomenon, but rather a negative correlation between CD3gamma and CD3epsilon expression levels.
There are no descriptions of the expression patterns of all CD3 genes in the literature. In the present study, the expression patterns of the four CD3 chains was epsilon>zeta>delta>gamma in MM PBMCs. In contrast, that of healthy controls was gamma>epsilon>zeta>delta. The significance of the CD3 gene expression profiles is unclear, and whether these gene expression patterns are typical in MM and healthy individuals remains an open question.
Because the number and expression levels of Vbeta subfamilies and multiple clonally expanded Vbeta T cells might be related to advanced MM,Citation20 we further analysed the expression levels of CD3 genes in different MM stages. It did not differ significantly among Stages I, II, and III. Therefore, CD3 gene expression may not be affected by the advancement of disease. However, further work is needed to analyse more samples and follow up on the outcome of the MM patients.
In conclusion, the present study provides a global gene expression profile of CD3gamma, delta, epsilon, and zeta chains, and characterization of the TCR Vbeta repertoire and clonality in PBMCs from MM patients. To the best of our knowledge, this study is the first attempt to analyse the expression pattern of the TCR–CD3 complex in MM patients. Our results provide a better understanding of the cellular immunodeficiency features of MM patients.
The study was supported by grants from the Natural Science Foundation of Guangdong Province, China (no. 9251063201000001) and Medical Science Foundation of Guangdong Province (no. A2008341).
References
- Kyle RA, Rajkumar SV. Multiple myeloma. Blood 2008;111:2962–72.
- Li Y, Geng S, Yin Q, Chen S, Yang L, Wu X, et al.. Decreased level of recent thymic emigrants in CD4+ and CD8+ T cells from CML patients. J Transl Med 2010;8:47.
- Li Y, Chen S, Yang L, Zhou Y, Wu X, Huang M, et al.. Clonal expanded TCR Vbeta T cells in patients with APL. Hematology 2005;10:135–9.
- Rezvany M, Jeddi-Tehrani M, Osterborg A, Kimby E, Wigzell H, Mellstedt H. Oligoclonal TCR BV gene usage in B-cell chronic lymphocytic leukemia: major perturbations are preferentially seen within the CD4 T-cell subset. Blood 1999;94:1063–9.
- Chen X, Woiciechowsky A, Raffegerst S, Schendel D, Kolb HJ, Roskrow M. Impaired expression of the CD3-zeta chain in peripheral blood T cells of patients with chronic myeloid leukaemia results in an increased susceptibility to apoptosis. Br J Haematol 2000;111:817–25.
- Chen S, Yang L, Chen S, Li Y. TCR zeta chain expression in T cells from patients with CML. Hematology 2009;14:95–100.
- Berenson J, Lichtenstein A. Clonal rearrangement of the beta-T cell receptor gene in multiple myeloma. Leukemia 1989;3:133–6.
- Pérez-Andres M, Almeida J, Martin-Ayuso M, Moro MJ, Martin-Nuñez G, Galende J, et al.. Characterization of bone marrow T cells in monoclonal gammopathy of undetermined significance, multiple myeloma, and plasma cell leukemia demonstrates increased infiltration by cytotoxic/Th1 T cells demonstrating a squed TCR-Vbeta repertoire. Cancer 2006;106:1296–305.
- Martín-Ayuso M, Almeida J, éPérez-Andrs M, Cuello R, Galende J, González-Fraile MI, et al.. Peripheral blood dendritic cell subsets from patients with monoclonal gammopathies show an abnormal distribution and are functionally impaired. Oncologist 2008;13:82–92.
- Massaia M, Bianchi A, Attisano C, Peola S, Redoglia V, Dianzani U, et al.. Detection of hyperreactive T cells in multiple myeloma by multivalent cross-linking of the CD3/TCR complex. Blood 1991;78:1770–80.
- Pannetier C, Even J, Kourilsky P. T-cell repertoire diversity and clonal expansions in normal and clinical samples. Immunol Today 1995;16:176–81.
- Sensi M, Parmiani G. Analysis of TCR usage in human tumors: a new tool for assessing tumor-specific immune response. Immunol Today 1995;16:588–95.
- Lozeron P, Chabas D, Duprey B, Lyon-Caen O, Liblau R. T cell receptor V beta 5 and V beta 17 clonal diversity in cerebrospinal fluid and peripheral blood lymphocytes of multiple sclerosis patients. Mult Scler 1998;4:154–61.
- Puisieux I, Even J, Pannetier C, Jotereau F, Favrot M, Kourilsky P. Oligoclonality of tumor-infiltrating lymphocytes from human melanomas. J Immunol 1994;153:2807–18.
- Rezvany MR, Jeddi-Tehrani M, Wigzell H, Osterborg A, Mellstedt H. Leukemia-associated monoclonal and oligoclonal TCR-BV use in patients with B-cell chronic lymphocytic leukemia. Blood 2003;101:1063–70.
- thor Straten P, Guldberg P, Gronbeak K, Hansen MR, Kirkin AF, Seremet T, Zeuthen J, Becker JC:. In situ T cell responses against melanoma comprise high numbers of locally expanded T cell clonatypes. J Immunol 1999;163:443–7.
- Mami-Chouaib F, Echchakir H, éDorothe G, Vergnon I, Chouaib S. Antitumor cytotoxic T-lymphocyte response in human lung carcinoma: identification of a tumor-associated antigen. Immunol Rev 2002;188:114–21.
- Berenson J, Lichtenstein A. Clonal rearrangement of the beta-T cell receptor gene in multiple myeloma. Leukemia 1989;3:133–6.
- Moss P, Gillespie G, Frodsham P, Bell J, Reyburn H. Clonal populations of CD4+ and CD8+ T cells in patients with multiple myeloma and paraproteinemia. Blood 1996;87:3297–306.
- Halapi E, Werner A, öWahlstrm J, Osterborg A, Jeddi-Tehrani M, Yi Q, et al.. T cell repertoire in patients with multiple myeloma and monoclonal gammopathy of undetermined significance: clonal CD8+ T cell expansions are found preferentially in patients with a low tumor burden. Eur J Immunol 1997;27:2245–52.
- Raitakari M, Brown RD, Sze D, Yuen E, Barrow L, Nelson M, et al.. T-cell expansions in patients with multiple myeloma have a phenotype of cytotoxic T cells. Br J Haematol 2000;110:203–9.
- Sze DM, Brown RD, Yuen E, Gibson J, Ho J, Raitakari M, et al.. Clonal cytotoxic T cells in myeloma. Leuk Lymphoma 2003;44:1667–74.
- Sze DM, Giesajtis G, Brown RD, Raitakari M, Gibson J, Ho J, et al.. Clonal cytotoxic T cells are expanded in myeloma and reside in the CD8(+)CD57(+)CD28(−) compartment. Blood 2001;98:2817–27.
- Sze DM. Clonality detection of expanded T-cell populations in patients with multiple myeloma. Methods Mol Med 2005;113:257–67.
- Call ME, Wucherpfenning KW. The T cell receptor: critical role of the membrane environment in receptor assembly and function. Annu Rev Immunol 2005;23:101–25.
- Clevers H, Alarcon B, Wileman T, Terhorst C. The T cell receptor/CD3 complex: a dynamic protein ensemble. Annu Rev Immunol 1988;6:629–62.
- Call ME, Pyrdol J, Wucherpfenning KW. Stoichiometry of the T-cell receptor-CD3 complex and key intermediates assembled in the endoplasmic reticulum. EMBO J 2004;23:2348–57.
- Arnett KL, Harrison SC, Wiley DC. Crystal structure of a human CD3-epsilon/delta dimmer in complex with a UCHT1 single-chain antibody fragment. Proc Natl Acad Sci USA 2004;101:16268–73.
- Abraham RT, Weiss A. Jurkat T cells and development of the T-cell receptor signaling paradigm. Nat Rev Immunol 2004;4:301–8.
- Fischer A, de Saint Basile G, le Deist F. CD3 deficiens. Curr Opin Allergy Clin Immunol 2003;5:491–5.
- Liossis SN, Ding XZ, Dennis GJ, Tsokos GC. Altered pattern of TCR/CD3-mediated protein-tyrosyl phosphorylation in T cells from patients with systemic lupus erythematosus. Deficient expression of the T cell receptor zeta chain. J Clin Invest 1998;101:1448–57.
- Solomou EE, Wong S, Visconte V, Gibellini F, Young NS. Decreased TCR zeta-chain expression in T cells from patients with acquired aplastic anaemia. Br J Haematol 2007;138:72–6.
- Torelli GF, Paolini R, Tatarelli C, Soriani A, Vitale A, Guarini A, et al.. Defective expression of the T-cell receptor-CD3 zeta chain in T-cell acute lymphoblastic leukaemia. Br J Haematol 2003;120:201–8.
- Mozaffari F, Hansson L, Kiaii S, Ju X, Rossmann ED, Rabbani H, et al.. Signalling molecules and cytokine production in T cells of multiple myeloma-increased abnormalities with advancing stage. Br J Haematol 2004;124:315–24.
- Durie BGM, Salmon SE. A clinical staging system for multiple myeloma correlation of measured myeloma cell mass with presenting clinical features, response to treatment, and survival. Cancer 1975;36:842–54.
- Li Y, Chen S, Yang L, Yin Q, Geng S, Wu X, et al.. TRAV and TRBV repertoire, clonality and the proliferative history of umbilical cord blood T cells. Transplant Immunol 2007;18:151–8.
- Stams WAG, den Boer ML, Beverloo HB, Meijerink JPP, Stigter RL, van Wering ER, et al.. Sensitivity to L-asparaginase is not associated with expression levels of asparagine synthetase in t(12;21)+ pediatric ALL. Blood 2003;101:2743–7.
- Chen S, Yang L, Lu X, Li B, Chan JYH, Cai D, et al.. Gene expression profiling of CD3gamma, delta, epsilon and zeta chains in CD4+ and CD8+- Tcells from human umbilical cord blood. Hematology 2010;15:230–5.
- Hadden JW. Immunodeficiency and cancer: prospects for correction. Int Immunopharmacol 2003;3:1061–71.
- Gorski J, Yassai M, Zhu X, Kissela B, Kissella B. Circulating T cell repertoire complexity in normal individuals and bone marrow recipients analyzed by CDR3 size spectratyping. J Immunol 1994;152:5109–19.
- Assaf C, Hummel M, Dippel E, Goerdt S, Muller HH, Anagnostopoulos I, et al.. High detection rate of T-cell receptor beta chain rearrangements in T-cell lymphoproliferations by family specific polymerase chain reaction in combination with the Genescan technique and DNA sequencing. Blood 2000;96:640–6.
- Kessler JH, Bres-Vloemans SA, van Veelen PA, de Ru A, Huijbers IJ, Camps M, et al.. BCRABL fusion regions as a source of multiple leukemia-specific CD8+- T-cell epitopes. Leukemia 2006;20:1738–50.
- Takahashi T, Makiguchi Y, Hinoda Y, Kakiuchi H, Nakagawa N, Imai K, et al.. Expression of MUC1 on myeloma cells and induction of HLA-unrestricted CTL against MUC1 from a multiple myeloma patient. J Immunol 1994;153:2102–9.
- Kiaii S, Choudhury A, Mozaffari F, Kimby E, Osterborg A, Mellstedt H. Signaling molecules and cytokine production in T cells of patients with B-cell chronic lymphocytic leukemia (B-CLL): comparison of indolent and progressive disease. Med Oncol 2005;22:291–302.
- Haks MC, Cordaro TA, van den Brakel JH, Haanen JB, de Vries EF, Borst J, et al.. A redundant role of the CD3 gamma-immunoreceptor tyrosine-based activation motif in mature T cell function. J Immunol 2001;166:2576–88.
- DeJarnette JB, Sommers CL, Huang K, Woodside KJ, Emmons R, Katz K, et al.. Specific requirement for CD3epsilon in T cell development. Proc Natl Acad Sci USA 1998;95:14909–14.
- Sommers CL, Dejarnette JB, Huang K, Lee J, El-Khoury D, Shores EW, et al.. Function of CD3 epsilon-mediated signals in T cell development. J Exp Med 2000;192:913–9.