Abstract
With the availability of molecular monitoring of BCR-ABL1 and the use of tyrosine kinase inhibitors, treatment in chronic myeloid leukemia (CML) is now molecularly focused. Eighty-three samples taken at different time points from 38 CML patients; were subjected to T315I mutation analysis and gene expression analysis of AHI1; a novel gene that is thought to have a role in both BCR-ABL1 mediated leukemic transformation and response to tyrosine kinase inhibitors. Only one patient (2·63%) harboured the T315I mutation. While no significant difference in AHI1 expression was observed between newly diagnosed CML samples and non-CML controls; CML samples under imatinib therapy had levels significantly higher than both newly diagnosed samples and controls. In the first 6 months of imatinib therapy, AHI1 expression was found to increase and then gradually decrease. There was no significant difference between imatinib responders and non-responders, while dasatinib caused significantly lower AHI1 levels. It is proposed that the change in AHI1 expression during CML therapy might be under the control of mechanisms independent from BCR-ABL1. AHI1 mediated signalling could be better understood by analyzing AHI1 gene expression levels in a greater number of patients and concurrently investigating JAK/STAT and Src family kinases pathways.
Introduction
Chronic myeloid leukemia (CML) was the first human malignancy to be linked to an acquired genetic abnormality. It is a clonal hematopoietic stem cell disease characterized by an increase in all elements of myeloid lineage in the bone marrow.Citation1 The chromosomal translocation t(9;22)(q34;q11) leading to the formation of the fusion oncogene BCR-ABL1 constitutively activates the ABL1 tyrosine kinase.Citation2This in turn activates a number of signalling pathways inside the cell, some of which have been shown to directly contribute to the pathogenesis; for example, JAK/STAT, Ras, PI3K and Src family kinases pathways have all been found to be associated with BCR-ABL1 to help in increased survival, proliferation and inhibition of apoptosis.Citation3Citation3,4
The treatment of CML has taken an evolutionary turn with the development of imatinib, a tyrosine kinase inhibitor (TKI) directly binding and inactivating the pathogenic kinase.Citation5 Imatinib has been established as the first line treatment of chronic phase CML patients and therapy response is typically followed up molecularly by establishing the levels of the BCR-ABL1 fusion transcript in the blood or bone marrow of the patients.Citation1 Although the initial response levels for this drug are good, long-term follow-up studies have revealed that 20–30% of all patients developed resistance to imatinib sometime during their treatment.Citation1Citation4Citation1,4,6A number of factors are responsible for this acquired resistance; but the most frequent cause has been found to be point mutations in the kinase domain of the ABL1 protein and the most frequently found mutation is the T315I amino acid change.Citation7 There is also a substantial number of studies focusing on BCR-ABL1 independent mechanisms of resistance, which have revealed alternative downstream molecules to be targeted by next generation TKIs.Citation8 At present, new drugs such as dasatinib and nilotinib are being used as alternatives to imatinib in patients with resistance. However, patients harbouring the T315I mutation pose the greatest problem as being resistant to all available TKIs.Citation9
Abelson Helper Integration Site-1 (AHI1) is a novel oncogene that has been found to be deregulated in several leukemic cell lines including CML. Evidence suggests that AHI1 enhances the effects of BCR-ABL1 in vivo and induce JAK2, STAT5 and Src family kinases in CML cells; eventually mediating TKI response/resistance.Citation10In this study, AHI1 expression levels were evaluated in CML patients at different stages of their disease, together with their T315I mutation status.
Patients and Methods
Patients
A total number of 38 CML patients (median age: 46 years [17–74 years]) were included in this study. The median follow-up time for these patients were 24·5 (0–63) months and male/female ratio was 1·9 (25/13). Peripheral blood or bone marrow samples collected at various time points during treatment were sent to our laboratory for evaluation of BCR-ABL1 transcript levels by quantitative reverse transcriptase – polymerase chain reaction (qRT-PCR). The cDNA produced from these samples were used both for ABL1 kinase domain mutation detection and qRT-PCR analysis of AHI1 gene expression levels.
BCR-ABL1 transcript level results of the patients were recorded retrospectively. The study group consisted of newly diagnosed patients (<18 months since diagnosis) (n = 11), patients who were diagnosed over 18 months ago and negative for BCR-ABL1 transcript levels while on imatinib treatment (responsive patients) (n = 10) and patients who were diagnosed over 18 months ago, who became positive for BCR-ABL1 transcript levels sometime during their treatment with imatinib (unresponsive patients) (n = 17). The unresponsive group consisted of patients still on imatinib and patients who had switched to dasatinib, nilotinib or high dose imatinib. For the sake of clarity, sample numbers instead of patient numbers are used in the reporting of results, as more than one sample for each patient was analyzed and samples from the same patient fell into different groups as the disease progressed.
A control group (n = 11) was created consisting samples of healthy individuals with normal leukocyte counts, who were all negative for BCR-ABL1 transcript levels (non-CML) to demonstrate normal expression of AHI1.
T315I mutation detection
At least two cDNA samples from each patient, at different stages of treatment were evaluated (n = 83). PCR was carried out using primers for the ABL1 region and the specific digest pattern for the restriction enzyme DdeI was investigated for the presence of the T315I mutation.
Expression analysis of AHI1
The cDNA samples that were used for T315I mutation detection (n = 83) were studied in duplicates for expression analysis. The DyNAmo™ Capillary SYBR Green qRT-PCR (Finnzymes, Finland) kit and the Light Cycler 2·0 (Roche Diagnostics, Germany) system were employed for cycling and data analysis, respectively. Glyceraldehyde-3-phosphate dehydrogenase was used as a reference gene in qRT-PCR and expression levels were analyzed by relative quantification. Using a calibrator in all experiments, AHI1 gene expression levels were determined by the normalized ratio calculated by the instrument’s software.
Statistical analysis
SPSS 16·0 (Statistical Package for Social Sciences, SPSS Inc., Chicago, IL, USA) program was used to analyze the results. One way ANOVA was employed to determine difference between groups in a 95% confidence interval.
Results
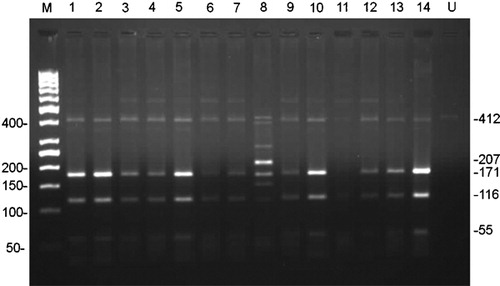
Of the 38 patients analyzed for T315I mutation, only one (2·63%) had a positive result. This patient had presented in the blast phase CML, received chemotherapy and continued his treatment with high dose imatinib. A representative restriction digest result can be seen in .
Figure 1. Representation of restriction digest results of 14 samples after PCR on 2% high resolution agarose gel electrophoresis. A distinctive 207 bp band is expected for a mutated sample when digested with DdeI. Lane 8 shows patient sample with T315I mutation. Potential band sizes for both mutated and unmutated samples after digestion can be seen on the right hand side. M: Marker (50 bp DNA ladder), U: uncut control.
Among the 83 samples assayed for AHI1 expression, different groups were compared to each other in order to establish a pattern of AHI1 expression in CML patients and to assess the effects of treatment on this pattern. First comparison was made between newly diagnosed (untreated) samples (n = 8) and treated samples (n = 75); both groups were also compared to the non-CML control group. Treated samples had significantly higher AHI1 expression levels than both untreated samples and control samples (P = 0·047 and 0·018 respectively) ().
Figure 2. Comparison of mean AHI1 levels in different groups of patients. Means are shown inside each bar. Das: dasatinib; dx: diagnosis; Im: imatinib; mo: months; nil: nilotinib; yrs: years.
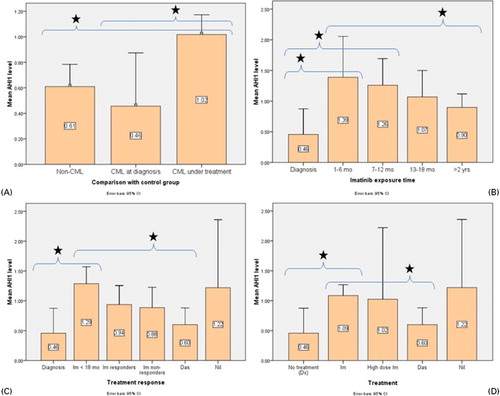
When samples of patients receiving only imatinib (n = 65) were taken into account, AHI1 expression levels were found to increase after the start of imatinib treatment and gradually decrease as more time had passed. The highest levels were found in the groups that had received imatinib for 1–6 months (n = 9) and 7–12 months (n = 13), which were both significantly higher than the untreated group (n = 8) (P = 0·004, 0·006 respectively) ().
AHI1 expression levels were also compared between samples of responders to imatinib (n = 18), non-responders to imatinib (n = 15), and patients who received second generation TKIs [dasatinib (n = 11) and nilotinib (n = 49)] after failing to respond to imatinib. There was no significant difference between imatinib responders and non-responders (P = 0·814). Untreated samples (n = 8) again had the lowest AHI1 expression levels and samples of patients receiving nilotinib as a secondary TKI (n = 4) had the highest ().
When only therapeutic agents were compared irrespective of administration times, samples receiving standard dose imatinib (n = 55) had significantly higher AHI1 expression levels than both the untreated group (n = 8) (P = 0·012) and the dasatinib group (n = 11) (P = 0·026) ().
The quantitative expression levels of BCR-ABL1 (ratio to control gene) were also investigated for correlation with AHI1 expression levels. When ungrouped samples (n = 83) were considered, no correlation was found (P = 0·080).
Discussion
The T315I mutation in the ABL1 kinase domain is the most frequent defect that leads to imatinib resistance.Citation7This mutation was chosen as a screen for this study for the very reason that it confers resistance to all three TKIs that are currently used in CML treatment.Citation8Citation8,9We detected the mutation in only one (2·68%) patient. The possible reason of this low incidence could be the relatively low sensitivity of the chosen method. Current methods for mutation detection are still being discussed regarding their sensitivity and timing. Direct sequencing is now considered the method of choice in these patients especially in order to show other possible mutations in the kinase domain.Citation8Citation8,9 We could have probably had a higher percentage of patients harbouring this mutation if we followed the patients for longer periods of time during their treatment. The importance of evaluating patients as a whole should be underlined, as there may be other reasons for imatinib resistance, such as cytogenetic clonal evolution, BCR-ABL1 amplification or deletions in the derivative chromosome 9.Citation8Citation8,9
The molecular pathogenesis of CML remains to be one of the most intensely investigated areas in cancer pathogenesis. In pursue of new molecularly targeted therapies that could cope with imatinib resistance, several novel molecules effective somewhere in the complex intracellular machinery that BCR-ABL1 utilizes has surfaced.Citation1–Citation4 In this context, we tried to show the expression levels of a novel putative oncogene, AHI1 in CML patients at different stages of their disease, to help illuminate its effects on treatment response and resistance. To our knowledge, this study is the first to evaluate AHI1 expression in total mRNA of CML patients both with and without resistance, before and after treatment and compare it to samples from normal individuals.
Previous studies have shown AHI1 to be highly deregulated in CML cell lines.Citation11 Consequent studies in animal models have demonstrated that AHI1 over-expression in primitive hematopoietic cells confers growth advantage in vitro, induce leukemia in vivo and enhance the effects of BCR-ABL. Studies with cells from CML patients have shown that AHI1 also contributes to BCR-ABL1 induced malignant transformation by mediating TKI resistance.Citation10
In our study, we did not find a significant difference in AHI1 levels between non-CML individuals and newly diagnosed CML patients (Fig. 2A). This may be due to the fact that we did not perform purification of cells from the patient samples. Another reason could be the relatively high endogenous AHI1 levels of the mature cells of non-CML individuals. Interestingly, we showed significantly increased expression of AHI1 after imatinib treatment in CML patients, especially at 6–12 months. This finding may indicate that imatinib treatment causes upregulation of AHI1 and influences further investigation in this direction.
We did not observe a significant difference in AHI1 expression levels in samples of imatinib responders and non-responders; while Zhou and colleaguesCitation10 had shown higher levels in non-responders. The discrepancy may have resulted from working with an unpurified cell population. Nevertheless, we have analyzed a higher number of patients and the results may be considered a more general reflection of endogenous AHI1 expression for the very reason that the cells were not purified.
Another notable result was the significantly lower AHI1 expression levels in samples of patients on dasatinib. While the number of samples is not very high (n = 11), this finding might indicate that dasatinib causes AHI1 levels to decrease. It was previously observed that CML progenitor cells with suppression of AHI-1 were more sensitive to dasatinib.Citation10
The fact that there was no significant correlation between BCR-ABL1 and AHI1 transcript levels demonstrates that mechanisms leading to AHI1 upregulation may not be directly related to BCR-ABL1. A putative pathway involved in this may be Src family kinases, as they are known to be involved in BCR-ABL1 mediated leukemic transformation, yet independent of BCR-ABL1 itself.Citation12 Moreover, samples of patients on dasatinib, which is a potent Src inhibitor, have shown significantly lower levels of AHI1. A recent study from the same group has demonstrated that a Src family kinase, HCK was involved in the AHI1 mediated transformation in cutaneous T-cell lymphoma.Citation13 Further studies are needed to unequivocally show that AHI1 is affected when Src pathway is inhibited in CML.
Based on these findings, a larger number of CML samples from patients on different treatment modalities could be screened for AHI1 expression and simultaneously other pathways known to be involved in AHI1 mediated effects, such as the JAK/STAT and the Src family kinases pathways could be investigated using high-throughput expression analysis techniques. Once a more detailed explanation can be given to the exact role of AHI1 in leukemic transformation of CML and TKI resistance, novel treatment options targeting this protein and its partner pathways can be discussed.
This work was supported by Baskent University Research Fund (project number KA-09/47).
References
- Kantarjian HM, Talpaz M, Giles F, O’Brien S, Cortes J. New insights into the pathophysiology of chronicmyeloid leukemia and imatinib resistance. Ann InternMed 2006;145(12):913–23.
- Goldman JM, Melo JV. BCR-ABL in chronic myelogenous leukemia–howdoes it work? Acta Haematol 2008;119(4):212–7.
- Sattler M, Griffin JD. Molecular mechanisms of transformation bythe BCR-ABL oncogene. Semin Hematol 2003;40(2Suppl 2):4–10.
- Weisberg E, Manley PW, Cowan-Jacob SW, Hochhaus A, Griffin JD. Second generation inhibitors of BCR-ABL forthe treatment of imatinib-resistant chronic myeloid leukaemia. NatRev Cancer 2007;7(5):345–56.
- Druker BJ, Talpaz M, Resta DJ, Peng B, Buchdunger E, Ford JM, et al.. Efficacy and safety of a specific inhibitorof the BCR-ABL tyrosine kinase in chronic myeloid leukemia. NEngl J Med 2001;344(14):1031–7.
- Deininger MW. Milestones and monitoring in patients withCML treated with imatinib. Hematology Am Soc HematolEduc Program 2008:419–26.
- Branford S, Rudzki Z, Walsh S, Grigg A, Arthur C, Taylor K, et al.. High frequency of point mutations clusteredwithin the adenosine triphosphate-binding region of BCR/ABL in patients withchronic myeloid leukemia or ph-positive acute lymphoblastic leukemia who developimatinib (STI571) resistance. Blood 2002;99(9):3472–5.
- Quintas-Cardama A, Kantarjian HM, Cortes JE. Mechanisms of primary and secondary resistanceto imatinib in chronic myeloid leukemia. Cancer Control 2009;16(2):122–31.
- Jabbour E, Cortes JE, Kantarjian HM. Suboptimal response to or failure of imatinibtreatment for chronic myeloid leukemia: what is the optimal strategy? MayoClin Proc 2009;84(2):161–9.
- Zhou LL, Zhao Y, Ringrose A, DeGeer D, Kennah E, Lin AE, et al.. AHI-1 interacts with BCR-ABL and modulatesBCR-ABL transforming activity and imatinib response of CML stem/progenitorcells. J Exp Med 2008;205(11):2657–71.
- Jiang X, Zhao Y, Chan WY, Vercauteren S, Pang E, Kennedy S, et al.. Deregulated expression in ph+human leukemias of AHI-1, a gene activated by insertional mutagenesis in mousemodels of leukemia. Blood 2004;103(10):3897–904.
- Kennah E, Ringrose A, Zhou LL, Esmailzadeh S, Qian H, Su MW, et al.. Identification of tyrosine kinase,HCK, and tumor suppressor, BIN1, as potential mediators of AHI-1 oncogenein primary and transformed CTCL cells. Blood 2009;113(19):4646–55.
- Li S. Src-family kinases in the development andtherapy of philadelphia chromosome-positive chronic myeloid leukemia and acutelymphoblastic leukemia. Leuk Lymphoma 2008;49(1):19–26.