Abstract
We studied the expressions of FR, FL, TR1, and TR2 on blasts and T cells from 71 patients with acute myeloid leukemia (AML) and correlated expression rates with the clinical course. Compared to AML-blasts we found higher co-expressions on healthy myeloid and T cells. Expression of all markers on blasts and on T cells was similar in different subtypes and acute stages of AML. Compared to the non-responders (n = 7) responders to the AML Cooperative Group-therapy (n = 22) presented with higher proportions of blasts co-expressing the four markers (FR: 32 vs 15%; FL: 15 vs 13%; TR1: 72 vs 37%; TR2: 24 vs 23%) or T cells (FR: 88 vs 71%; FL: 76 vs 56%; TR1: 96 vs 44%; TR2: 54 vs 42%). Patients with higher expression rates of TR1 on blasts (⩾48%) and on T cells (⩾67%) were characterized by a prolonged survival. In summary, our data show a variable expression of FR, FL, TR1 and TR2 on blasts or T cells in different subgroups of AML. Higher co-expression rates of FR, FL, TR1 and TR2 were characterized by a better prognosis for the patients with respect to achieve a remission and to survive. Functional analyses should be performed to find out those patients in who induced upregulation of these markers could contribute to overcome drug resistance.
Introduction
In the normal development of multicellular organisms and in maintaining tissue homeostasis, apoptosis plays a critical role.Citation1 Death receptors, such as members of the tumor necrosis factor (TNF) receptor family, FasR (CD95), TNF-related apoptosis-inducing ligand (TRAIL) receptor (R)1(DR4), and TRAIL-R2 (DR5) are known to be involved in apoptosis.Citation2 TRAIL is constitutively expressed in a variety of tissues and cell types, and mediates a specific cytotoxic effect on transformed cells. From five TRAIL-R types, TRAIL-R3 and TRAIL-R4 are known to act as decoy receptors that interfere with agonistic receptors, called TRAIL-R1 and TRAIL-R2.Citation3–Citation8 Interestingly, all TRAIL-R are expressed in the same tissue as its ligand Trail.Citation9–Citation11
Fas (Fibroblast-associated), also known as Apo-1, CD95, and TNFRSF6, was originally identified as a cell-surface protein that binds to monoclonal antibodies that are cytolytic for various human cell lines.Citation12While FasR, the receptor for FasL, is expressed on various types of cells like activated or virus transformed lymphocytes, epithelials cells, hepatocytes tumor cells, e.g. Traver et al.;Citation13FasL (CD178), for FasR, a 40 kDa type II transmembrane protein belonging to the TNF superfamily, is predominantly expressed on activated T cells and natural killer cells. The FasR/FasL system plays a crucial role in modulating immune responses by inducing cell specific apoptosis.Citation14The deregulation of apoptosis may contribute to the pathogenesis of a number of human malignant disorders.Citation15
The FasL is expressed in acute and chronic leukemia and is known to mediate apoptosis in 27% of CML and 54% of acute myeloid leukemia (AML), but also against autologous activated T cells. These results suggest that the FasR/FasL pathway is involved in leukemic immune escape.Citation16
The aim of this study was to evaluate the role of a FasR/FasL and TRAILR1/TRAILR2 expression on blasts as well as on other hemopoetic cells obtained from AML patients with respect to different AML-subtypes and especially to correlate the expression with the response to chemotherapy and relapse free survival. However, results of other groups point out that functional analyses should be performed in addition to find out those patients in whom upregulation of these markers is sufficient to overcome a therapeutic resistance or whether other therapeutic strategies bypassing the mechanisms of FR, FL, TR1 and TR2 induced apoptosis should be considered to improve therapy outcomes.
Materials and Methods
Patients’ characteristics, sample collection and diagnosis
Mononuclear cells (MNCs) from heparinized blood (PB) or bone marrow (BM) (PB-MNCs, BM-MNCs) were isolated from the interphase by density-gradient centrifugation (Ficoll-Hypaque, Biochrom, Germany), washed and suspended in phosphate-buffered-saline without Ca2+ and Mg2+ (Biochrom). Diagnosis of AML cases was based on the French—American–British (FAB) classification.Citation17 Samples were collected in active stages of the disease from 71 AML patients (41 at first diagnosis, 7 in persisting disease, 11 at relapse, 14 at relapse after transplantation) as well as from 9 healthy donors after obtaining informed consent (). The median age of the AML patients was 46 years (range 13–79 years), the female/male ratio was 1∶1·2. Forty-five patients presented with an undifferentiated leukemia (M0: n = 11; M1: n = 34), 14 patients with an immature granulocytic leukemia (M2: n = 12; M3: n = 2) and 12 patients with a monocytic leukemia (M4: n = 2; M5: n = 6; M6: n = 4).
Table 1. Patients’ characteristics
All patients studied at first diagnosis were previously untreated and entered at the time of initial therapy. After diagnosis of AML 37 patients were treated according to the protocols of the German AML Cooperative Group. These comprise double induction therapy with thioguanin, cytosine arabinoside and daunorubicin followed by high-dose cytosine arabinoside and HAM. Cases with AML-M3 received all-trans-retinoic-acid including therapy protocols. The remaining patients were treated by other approved therapy standards. Complete remission was determined to be achieved when the BM was normocellular, containing ⩽5% blasts and when neutrophil granulocytes in peripheral blood had recovered to 1500/μl and platelets to 100·000/μl according to Cancer and Leukemia Groups criteria. Relapse was diagnosed when the BM contained at least 5% leukemic blasts or when leukemic infiltration occurred at any other site. The investigated samples contained about an average of 81% leukemic blasts (72% in smears). As a control BM cells obtained from nine healthy volunteers were studied.
Cytogenetic analyses were performed according to the standard protocols and criteria defined by the International System for Human Cytogenetic Nomenclature.Citation18 Patients were categorized in risk groups as described:Citation15 ‘Favorable risk’ AML patients had presented with a t(8;21), t(15;17), inv(16), t(16;16); ‘poor risk’ AML patients with -5/5q-, -7/7q-, t(11q23), inv(3), t(3;3), 17p abnormalities or a complex aberrant karyotype (⩾three abnormalities); ‘ intermediate risk’ AML patients had presented with a normal karyotype or with any of the remaining aberrations.
Cell preparation and flow cytometric analysis
MNCs were resuspended in phosphate-buffered-saline with 10% rabbit serum. A panel of mouse monoclonal antibodies (moAbs) directly conjugated with fluorescein isothiocyanate, phycoerythrin (PE) and tandem Cy7-PE–conjugation (PC7) or APC were performed to evaluate and quantify amounts and phenotypes of leukemic cells, B, T and NK cells and especially cells expressing FasL or FasR and TrailR1 and R2 in the MNC samples. Antibodies were purchased from Becton Dickinson (*) (Heidelberg, Germany), Immunotec/Beckmann Coulter (**), R&D systems (***), Caltag (****), SBA (*****), Serotec (******) (Duesseldorf, Germany), Pharmingen (*******). As fluorescein isothiocyanate conjugated moAbs, we used CD3 (**), CD4 (*), CD33 (**), CD8 (*), CD56 (**). CD8 (*), CD33 (**), CD56 (**), CD80(**), CD137L (*******) were used as PE-conjugated moAbs. We chose CD3 (**), CD14 (*), CD19 (**), CD34 (**) as PC7-conjugated moAbs. CD3 (**), CD4 (*), CD13 (**), CD14 (*), CD33 (**) were chosen as APC-conjugated moAbs.
The samples were analyzed on a FACScan (Becton Dickinson, BD). Debris was excluded from the analysis. The leukemic cell population was identified by gating the typical formation in the forward/sideward-scatter-projection, with (residual) lymphocytes and monocytes included as described by other authors and us.Citation20Citation20,21Proportions of lymphocytes, monocytes and blasts, expressing the patient’s typical ‘blast phenotype’ in the defined gate compared with the isotype control were calculated and quantified, using CellQuest Software (BD). In addition, the lymphocytes’ as well as the blasts’ co-expression of FasR/FasL and TrailR1/TrailR2 was determined, using CD3 (T cells) or CD33 (blasts, in cases with less than 10% contaminating CD14+monocytes).
Statistical methods
Mean and standard deviation, median and range, two tailed t tests and Chi-square tests were performed by a personal computer using Excel 97 (Microsoft). Differences were considered as significant if the P value was <0·05. For relapse free survival analyses patients were censored at the time of bone marrow transplantation. Cut-off values of FasR/FasL and TrailR1/TrailR2 positive cells were estimated according to the probability to separate the patients group in prognostic subgroups for the most significant differentiation between cases with a shorter or longer relapse free survival time. Relapse free survival times were calculated and represented by Kaplan–Meier plots and the statistical significance of the groups evaluated by log-rank test.
Results
We analyzed the expressions of FR, FL, TR1, or TR2 on MNCs from AML patients in active stages of the disease to evaluate the co-expression of these markers on blasts or T cells.
Expression of FasR or FasL and TRAILR1 or TRAILR2 at first diagnosis of AML compared to healthy probands ()
Co-expression analyses of FR and FL on myeloid cells showed higher proportions of FR+/CD33+ double positive cells (76 vs 41%, P = n.s.) as well as FL+/CD33+cells in the myeloid cell fractions of healthy MNCs compared to AML-MNC (69 vs 33%, P = n.s., ). Co-expression analyses of FR and FL on T cells showed higher proportions of FR+/CD3+cells (82 vs 67%, P = n.s., ) as well as FL+/CD33+cells in the T-cell fractions of healthy MNCs compared to AML-MNC (97 vs 47%, P = n.s.). Moreover, co-expression analyses of TR1 and TR2 on T cells showed higher proportions of TR1+/CD3+ cells (73 vs 49%, P = n.s.) as well as T2+/CD3+ cells in the T-cell fractions of healthy compared to AML-MNC (80 vs 33%, P = n.s., ). Comparing expression profiles in the total MNC fractions we could even detect significances: FasR (FR) was highly expressed in healthy probands and significantly less in AML (45 vs 23% FR+ cells, P = 0·02/t-test, data not shown). FasL (FL) was also highly expressed in healthy probands, but less in the patients’ group with AML (60 vs 22% FL+cells, P = n.s.). The expression of TrailR2 (T2) was similar in both groups (13% T2+ cells). The TrailR1 (T1) was significantly higher expressed in healthy probands, but less in the patients’ group with AML (46 vs 33% T1+cells, P = 0·04/t-test, data not shown).
Figure 1. Mononuclear PB cells from AML patients were analyzed by FACS analysis using fluorochrome labeled anti-FR/FL and TR1/TR2 antibodies. Percentages of myeloid cells and T cells for the respective FR, FL and TR1, TR2 co-expressions are presented on MNCs from AML patients at first diagnosis compared to healthy probands. (A) Co-expression of FasR or FasL and TrailR1 or TrailR2 on myeloid cells. (B) Co-expression of FasR or FasL and TrailR1 or TrailR2 on T cells.
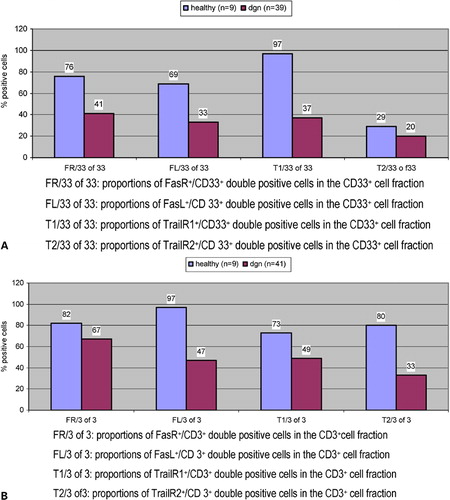
Altogether FR/FL and TR1/TR2 showed higher expression rates on myeloid cells and on T cells from healthy compared to AML blasts and T cells at first diagnosis.
Expression of FasR or FasL and TrailR1 or TrailR2 in different stages of AML
Co-expression analyses of FR on myeloid cells showed higher proportions of FR+/CD33+ double positive cells (41 vs 21–26% FR+/CD33+ cells, P = n.s., data not shown) as well as FL+/CD33+ cells in the myeloid cell fractions at first diagnosis compared to other stages of the disease (33 vs 15–21% FL+/CD33+cells, P = n.s., data not shown). Co-expression of TR1 on myeloid cells showed also higher proportions of TR1+/CD33+cells (37 vs 19–32% TR1+/CD33+cells, P = n.s., data not shown) as well as TR2+/CD33+ cells in the myeloid cell fractions at first diagnosis compared to the other stages of the disease (20 vs 12–18% TR2+/CD33+ cells, P = n.s., data not shown).
In summary, the FR and FL showed similar co-expression on blasts and T cells in different stages of the disease.
Expression of FasR or FasL and TRAILR1 or TRAILR2 in prognostic subtypes of AML ()
First we compared expression profiles in different FAB subtypes of AML. Varying co-expressions of FR, FL, TR1 and TR2 were found on blasts as well as on T cells (data not shown). Therefore, we further subdivided AML cases in prognostic subtypes to study expression profiles.
Expressions in pAML and sAML groups ()
Co-expression analyses of FR and FL on myeloid cells showed higher proportions of FR+/CD33+ double positive cells (43 vs 37% FR+/CD33+ cells, P = n.s.) as well as FL+/CD33+ cells in the myeloid cell fractions of pAML-MNC compared to sAML-MNC (100 vs 50% FL+/CD33+cells, P = n.s., , left side). Co-expression analyses of TR1 and TR2 on myeloid cells showed higher proportions of TR1+/CD33+cells (41 vs 39% TR1+/CD33+ cells, P = n.s.) as well as TR2+/CD33+ cells in the myeloid cell fractions of pAML-MNC compared to sAML-MNC (28 vs 14% TR2+/CD33+cells, P = n.s., , left side). Co-expression analyses of FR and FL on T cells showed also higher proportions of FR+/CD3+cells (82 vs 50% FR+/CD3+ cells, P = n.s., , right side) as well as FL+/CD3+ cells in the T-cell fractions of pAML-MNC compared to sAML-MNC (59 vs 34% FL+/CD3+cells, P = n.s. , right side).
Figure 2. Mononuclear PB cells from AML patients were analyzed by FACS analysis using fluorochrome labeled anti-FR/FL and TR1/TR2 antibodies. Percentages of myeloid cells and T cells for the respective FR, FL and TR1, TR2 co-expressions are presented on MNCs from AML patients in different stages of AML. (A) Percentages of myeloid cells and T cells for the respective FR, FL and TR1, TR2 co-expressions are presented on MNCs from AML patients in pAML compared to sAML. (B) Percentages of myeloid cells and T cells for the respective FR, FL and TR1, TR2 co-expressions are presented on MNCs from AML patients in favorable vs poor cytogenetic risk group. (C) Percentages of myeloid cells and T cells for the respective FR, FL and TR1, TR2 co-expressions are presented on MNCs from AML patients in the responder compared to the non-responder-group to chemotherapy.
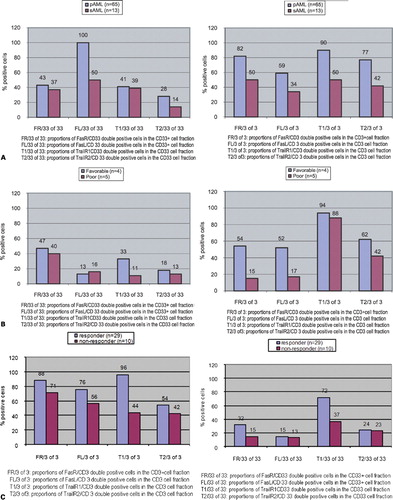
In summary, FR, FL, TR1 and TR2 showed higher co-expressions on blasts and T cells from pAML compared to sAML cells.
Expression of FasR or FasL and TrailR1 or TrailR2 in cytogenetic risk groups ()
All patients were divided in favorable and poor cytogenetic risk groups. Co-expression analyses of FR on myeloid cells showed higher proportions of FR+/CD33+ double positive cells (47 vs 40% FR+ cells, P = n.s., , left side) in the myeloid cell fractions of the favorable risk group compared to the poor risk groups. Co-expression analyses of TR2 showed higher proportions of TR2+/CD33+cells (18 vs 13% TR1+/CD33+ cells, P = n.s., , left side) in the myeloid cell fractions of the favorable risk group compared to the poor risk group. Co-expression analyses of FR, FL, TR1 and TR2 on T cells showed higher proportions of double positive cells in the T-cell fractions of the favorable risk group compared to the poor risk group (, right side).
In summary, higher co-expressions of FR, FL, TR1 and TR2 were found on T cells of the favorable risk group compared to the poor risk group.
Expression of FasR or FasL and TRAILR1 or TRAILR2 in responders and non-responders to double induction therapy ()
To find out the influence of FR, FL, TR1, and TR2 expressions on remission probability, we compared the FR, FL,TR1 and TR2 expression in patients, who achieved a remission (n = 29) with that of patients, who showed persisting disease (n = 10) after double induction therapy with daunorubicin/mitoxantrone chemotherapy. Co-expression analyses of FR on myeloid cells showed higher proportions of FR+/CD33+ double positive cells (32 vs 15% FR+/CD33+ cells, P = n.s., , left side) as well as FL+/CD33+ cells (15 vs 13% FL+/CD33+cells, P = n.s., , left side) in the myeloid cell fractions of the responder compared to the non-responder-MNC fractions. Co-expression analyses of FR and FL on T cells showed higher proportions of FR+/CD3+cells (88 vs 71% FR+/CD3+ cells, P = n.s., , right side) as well as FL+/CD3+ cells (76 vs 56% FL+/CD3+cells, P = n.s., , right side) in the T-cell fractions of the responder compared to the non-responder-MNC fractions.
In summary, higher co-expression rates of FR, FL, TR1 and TR2 could be demonstrated on blasts and on T cells in the responder compared to the non-responder group.
FasR or FasL and TrailR1 or TrailR2 expression and relapse free or overall survival probabilities ()
We could show that higher co-expression of FR, FL, TR1, and TR2 on blasts and on T cells were associated with more favorable prognostic groups. This prompted us to evaluate cut-off-values (by ‘walking cut-off analyses’) to evaluate percentages of positive cells for a most significant differentiation between cases with shorter or longer relapse free or overall survival.
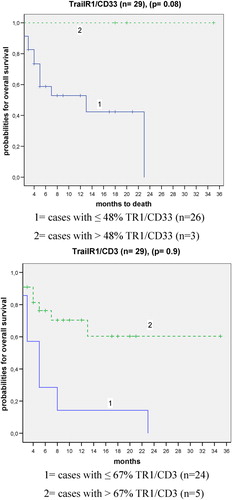
It could be shown that patients presenting with more than 48% blasts or with more than 67% T cells co-expressing TR1 were characterized by a higher probability of survival compared to the patients’ group with less than those cell counts, although the differences were not significant (). Moreover, we could show that 75% of patients’ samples with less than 67% of TR1+/CD3+ co-expressing cells relapsed already after 8 months, whereas only 30% of patients with more than 67% TR1+/CD3+ cells relapsed after 13 months (data not shown). Cut-off values could be evaluated also for FR, FL, and TR2. However, no (significant) differences in relapse free or overall survival probability could be detected after separation of cases in those with higher or lower (cut-off) proportions of blasts or T cells co-expressing these markers (data not shown). In summary, that means that in our patients’ cohort we could demonstrate higher (relapse free) survival probabilities for patients with higher co-expression rates of TR1 on T cells as well as blast cells.
Figure 3. Mononuclear PB cells from AML patients were analyzed by FACS analysis using fluorochrome labeled anti-FR/FL and TR1/TR2 antibodies and percentages of myeloid cells and T cells co-expressing the respective FR, FL and TR1, TR2 markers evaluated. Cases were separated each in two prognostic groups after evaluating a cut-off value representing the value of maximum probability with a most significant differentiation between cases with a shorter or longer overall survival. Kaplan–Meier plots and the respective P values by log-rank test for TR1/CD33 and TR1/CD3 co-expressions are given.
In conclusion, our data show that a higher expression of FR, FL, TR1, and TR2 on T cells or blasts of AML patients is associated with a better prognosis.
Discussion
We wanted to explore both the mechanisms responsible for resistance of AML cells to apoptosis and detect subtypes of AML characterized by prognostically relevant expression of mediators for apoptosis. FasR/FasL, TRAILR1 and TRAILR2 are of crucial importance in tumor cell elimination by interaction with cytotoxic T cells resulting in induction of FADD-transmitted death signals via ‘death domains’, essential to initiate cytotoxic responses and resulting in the activation of caspase-mediated apoptosis.Citation22TRAIL agonistic receptor expression is involved in the mechanisms of resistance of several tumor cell types of Trail, including breast cancerCitation23 or myeloma.Citation24 We suggest that AML could represent an additional neoplastic condition in which TRAIL resistance is mediated by the expression behavior of TRAIL decoy receptors.Citation25 Leukemic cells are known to escape from tumor-immunological mechanisms by e.g. downregulation of HLA-molecules, secretion of inhibitory cytokines or by insensitivity to FR/FL, TR1 and TR2-induced mechanisms of apoptosis mechanisms.Citation22Citation22,26 The interaction of cytotoxic T cells via FasR/FasL or TRAILR1/TRAILR2 is one of the mechanisms to mediate apoptosis or immuno-surveillance in AML. With our retrospective analysis, we wanted to study the expression of these markers and especially their co-expression on myeloid blasts and T cells in AML and to evaluate their prognostic significance.
FasR/FasL and TrailR1/TrailR2 expression on myeloid cells
First, we investigated the expression and prognostic value of FR and of FL expression on myeloid cells in 71 AML patients in different stages of the disease and compared the expressions with that on healthy PB-MNCs. Compared to AML at first diagnosis we found a higher expression of FR and FL on healthy compared to leukemic myeloid cells. This was already described by other authors.Citation27Citation27,28However, other groups discovered higher FL expressions in AML patients at first diagnosis compared to healthy controls, what could be explained by different detection methods (immunohistochemical or cytometric) analyses of different cellular subsets, heterogenic composition of patients’ groupsCitation16Citation16,29 or different activation or functional stages of healthy cells, e.g. activated monocytes.Citation16Citation16,28
Concerning expression profiles of FasL and FasR on blasts in different subtypes and stages we found similar expressions of both markers in different stages of the disease and higher expressions of both markers in pAML compared to sAML. In agreement with other groups, we found varying expressions of these markers in FAB types,Citation22,Citation30,Citation31what might be either explained by varying compositions of the patients’ groups and also by varying expressions of these markers. In normal hematopoiesis, FR expression is known to correlate with the maturation pathway of the myeloid differentiation.Citation32 Consequently, a variable expression on AML cells has been suggested to reflect the differences in the maturation stages of the leukemic cells.Citation22
In agreement with Min et al.,Citation30we found no significant differences of FR and FL expressions in favorable compared to poor risk cytogenetic groups, although there was a trend for higher expression rates of FR in the favorable risk group. Moreover, we found similar expressions of FR and FL on blasts studied at first diagnosis obtained from responders compared to non-responders to chemotherapy, although again higher expressions were found for FR and FL in responders, but these differences were not significant.
We investigated the expression and prognostic value of TR1 and TR2 expressions on myeloid cells in 71 AML patients in different stages of the disease and compared the expressions with that on healthy PB-MNCs. Compared to AML we found a higher expression of TR1 and TR2 on healthy compared to leukemic myeloid cells. Up to now, limited data about levels of TR1 and TR2 expressions are available and functions in healthy tissues are not fully understood due to divergent and incomplete functional data.Citation25Concerning expression profiles of TR1 and TR2 on blasts in different subtypes and stages we found similar expressions of both markers in different stages (although highest expression was seen at first diagnosis). We also detected higher expressions of TR1 in pAML compared to sAML and varying expressions in FAB types, as already describes by other authors.Citation25Citation30Citation25,30,33 In agreement with other authors we did not found different expressions in favorable compared to poor cytogenetic risk group-cases, although higher expression rates of TR1 were found in favorable cases.Citation30 Moreover, we found higher expressions of TR1 on blasts in responders compared to non-responders, although no significant differences were detectable. With regard to TR2 expressions on blasts, no differences were seen and we found general variable expressions of FR, FL, TR1, and TR2 on blasts. However, higher expression rates of those markers on blasts do appear to be associated with those patients in the more favorable subgroups which could possibly suggest a higher sensitivity to Fas- or TRAIL-mediated apoptosis.
FasR/FasL and TrailR1/TrailR2 expression on T cells
Next we investigated the expression and prognostic value of FR and FL expressions on T cells in 71 AML patients in different stages of the disease and compared the expressions with that on healthy PB-MNCs. Compared to AML we found higher expressions of FR and FL on healthy T cells. We found similar expressions of FR and FL on T cells in different stages of the disease; however, higher expression rates on T cells in pAML compared to sAML patients. There are no data available about expressions of these markers on T cells from AML patients. However, it could be shown that T cells obtained from patients with an autoimmune disease (systemic lupus erythematosis) showed a higher expression of FR and FL compared to healthy controls, what was explained by a higher susceptibility of those T cells to apoptosis. It could be shown that the ratio of surface expression of agonistic receptors to decoy receptors was significantly higher in MDS than in normal marrow resulting in extensive apoptosis of MDS compared to healthy bone marrow cells.Citation33 Vice versa our data show a decreased expression of FR and FL on AML-T cells compared to healthy controls, what could be explained by a decreased rate of apoptosis in AML.
We investigated the expression and prognostic value of TR1 and TR2 expressions on T cells in 71 AML patients in different stages of the disease and compared the expressions with that on healthy PB-MNCs. In analogy to FR and FL expressions we also found higher expressions of TR1 and TR2 on healthy T cells. Concerning expression profiles of TR1 and TR2 on T cells in different subtypes and stages we found similar expressions of both markers in different stages and higher expressions of both markers on T cells from pAML compared to sAML patients. Higher expression rates were found of TR1 in cases with favorable cytogenetic risk. Moreover, we found higher, although not significant higher, expression rates of TR1 and TR2 on T cells obtained from responders compared to non-responders to chemotherapy. There are no data available about the co-expressions of TR1 and TR2 on T cells from AML patients. In analogy to results obtained with FR and FL expressions on T cells our data could point to a role of TR1 and TR2 expressions on T cells and possibly contribute to predict the success of chemotherapy.
Prognostic significance of FasR/FasL and TRAILR1/TRAILR2 expression in AML
A purpose of our study was to evaluate the prognostic significance of FR, FL, TR1, and TR2 expressions in AML. Data presented above show that higher expression rates of FR, FL as well as of TR1 and TR2 are associated with more favorable subtypes of AML (e.g. pAML, favorable cytogenetic risk, responders to chemotherapy). Therefore, we selected cases at first diagnosis that achieved a remission and tried to correlate probabilities for overall and progress free survival with proportions of blasts co-expressing those markers. Although no significant differences were found, our data show that patients with higher expression rates of FR, FL or TR1 or TR2 on blasts as well as on T cells obtained from these patients were characterized by a better prognosis. An even more interesting result was that cases presenting with more than 48% blasts or more than 67% T cells co-expressing TR1 were characterized by a higher survival probability. That means that we could create a prognostically useful marker to predict the course of the disease in these cases. The predictive value was less evident, if only cases that had achieved a remission were included. This could be explained by the biological role of TR1 in the mediation of apoptosis: the expression of TR1 on blasts can be used to predict the response to chemotherapy but is less predictive for cases that had already received a therapy and responded successfully.
Our results partially support data published already that higher proportions of FR and FL are associated with a better prognosis.Citation30 However, the groups could not show prognostic differences concerning the TR1 and TR2 expressions. This could be due to the fact that the groups did not evaluate cut-off values for analyses, but used the 20% level as a more or less arbitrarily chosen value used for the definition of positivity of a leukemic blast population for a ‘blast marker’ as ‘cut-off’ value.Citation30Citation30,34 Results obtained from another group compared to our results describe a higher TR2 expression in the CR-group compared to the group at first diagnosis.Citation33Further studies with a large number of patients are warranted to ascertain the relationships between FR, FL, TR1, and TR2 expressions and CR rates. Our results suggest that expression rates of FR, FL as well as of TR1 and TR2 on blasts and on T cells in AML may be reliable markers to predict sensitivity of blasts to chemotherapy or immune-mediated apoptosis.
Therapeutic perspectives for the future
FR, FL, TR1, and TR2 play a critical regulatory role in immune-mediated apoptosis.Citation35Citation35,36In consequence therapeutic strategies that target and influence the expression and function of these receptors could contribute to develop new ‘targeted’ immunotherapies.
Our data suggest that higher expression rates of FR, FL, TR1, and TR2 on blasts as well as on T cells are associated with more favorable courses of the disease. This could be explained by more functionally active immuno-reactions mediating at least in part apoptotic steps. Although our data do not facilitate functional statements, the induction of an increased expression of these markers by therapies could contribute to improve the treatment outcomes. It could be shown that chemotherapeutic agents like chlorambucil or fludarabine could induce a marked upregulation of TR1 and TR2, thereby inducing apoptosis of B-CLL cells.Citation37 Other cancer drugs like inhibitors of histone deacetylases could also induce an upregulation of FR, FL, TR1, and TR2 on leukemic cells in AML, but not on healthy cells.Citation26Citation26,38Moreover, studies have shown that IFN-alpha can upregulate FR on CD34+cells resulting in increased sensitivity to Fas-mediated killing in vitro.Citation39
Other studies have shown that apoptosis in human cell lines or T-cell lines can be triggered by cytotoxic drugs, like bleomycin and tenoposide and are mediated by the FR/FL system.Citation40 Chemotherapy-induced, FR-dependent apoptosis has been suggested to be the result of the activation of NF-κB pathway.Citation40However, other studies have shown that AML cells can be resistant to FR, FL or TR1 and TR2 mediated apoptosis. That means that in these cases apoptosis can not be induced despite high expression rates of these antigens,Citation26 what could be due to apoptosis-inhibitors like FLIP or XIAP, as already described for B-CLL or by loss-of-function mutations.Citation5Citation28Citation5,28,33 It has to be remarked that vice versa it is known that a high expression of FR on tumor cells can induce killing of Fas-sensitive, activated T-lymphcytes (‘Fas-counterattack’) resulting in tumor immune escape or different responses to DLI-therapy or stem cell transplantation.Citation29 Up to now, little data about TRAIL/TR1 and TR2 regulated apoptosis in healthy are available: some authors state that expression levels of TRAIL on activated lymphocytes could be due to the way of T-cell activation or physiological conditions,Citation41Citation41,42other authors state that TR1 and TR2 are not expressed on T cells, and that could be explained by varying experimental conditions.Citation43
Conclusion
In summary, our data show that higher rates of expressions of FR, FL, TR1, and TR2 are associated with a better prognosis for the patients especially with respect to predict a response to chemotherapy. Cut-off values of these markers could probably contribute to predict the clinical course of the disease. However, results of other groups point out that functional analyses should be performed in addition to find out those patients in who a drug-induced upregulation of these markers is sufficient to overcome a therapeutic resistance or whether other therapeutic strategies bypassing the mechanisms of FR, FL, TR1, and TR2 induced apoptosis should be considered to improve therapy outcomes of the patients.
The authors thank the physicians on the wards for the provision of patients’ blood samples and clinical reports. Parts of the results presented were worked out in the course of the diploma work of Sandra Pordzik.
References
- Krammer PH, Dhein J, Walczak JH, Behrmann I, Mariani S, Matiba B, et al.. The role of APO-1-mediated apoptosisin the immune system. Immunol Rev 1994;142:175–91.
- Josien R, Müschen M, Gilbert E, Douillard P, Heslan JM, Soulillou JP, Cuturi MC. Fas ligand, tumor necrosis factor-alpha expression,and apoptosis during allograft rejection and tolerance. Transplantation 1998;66(7):887–93.
- Pan G, O’Rourke K, Chinnaiyan AM, Gentz R, Ebner R, Ni J, et al.. The receptor for the cytotoxic ligandTRAIL. Science 1997;276:111–3.
- Sheridan JP, Marsters SA, Pitti RM, Gurney A, Skubatch M, Baldwin DK. Control of TRAIL-induced apoptosis by a familyof signaling and decoy receptors. Science 1997;277(5327):818–21.
- Walczak H, Degli-Eposti HA, Johnson RS, Smolak PJ, Waugh YJ, Boiani N, et al.. TRAIL-R2: a novel apoptosis-mediatingreceptor for TRAIL. EMBO J 1997;16:5386–97.
- Screaton GR, Mongkolsapaya N, Xu JX, Cowper AE, McMichael AJ, Bell JI. TRICK 2, a new alternatively spliced receptorthat transduces the cytotoxic signal from TRAIL. CurrBiol 1997;7:693–6.
- Chaudhary PM, Eby M, Jasmin A, Bookwalter A, Murray J, Hood L. Death receptor 5, a new member of the TNFRfamily, and DR4 induce FADD-dependent apoptosis and activate the NF-kappaBpathway. Immunity 1997;7(6):821–30.
- Schneider P, Tschopp J. Modulation of death receptor signalling. SympSoc Exp Biol 2000;52:31–42.
- MacFarlane M, Ahmad M, Srinivasula SM, Fernandes-Alnemri T, Cohen GE, Alnemri ES. Identification and molecular cloning of twonovel receptors for the cytotoxic ligand TRAIL. JBiol Chem 1997;272:25417–20.
- Degli-Eposti MA, Dougall MC, Smolka PJ, Waugh YJ, Smith CA, Goodwin RG. The novel receptor Trail-R4 induces NF-B andprotects against TRAIL-mediated apoptosis, yet retains an incomplete deathdomain. Immunity 1997;7:813–20.
- Marsters SA, Pitti RM, Donahue CJ, Ruppert S, Bauer KD, Ashkenazi A. Activation of apoptosis by Apo-2 ligand isindependent of FADD but blocked by CrmA. Curr Biol 1996;6:750–2.
- Delia D, Accomero P, Redrizzani M, Gerosa F, Kurrle R, Colombo MP. Differential susceptibility to HIV-GP120-sensilizedapoptosis in CD4+-T-cell clones with different T helper phenotypes: roleof CD95/CD95L interactions. Blood 1997;89(2):558–69.
- Traver D, Akashi K, Weismann IL, Lagasse E. Mice defective in two apoptosis pathways inthe myeloid lineage develop acute myeloblastic leukaemia. Immunity 1998;9(1):47–57.
- Gores G, Chen XJ, Paya CV, la Russo NF. Cryptosporidium parvum induced apoptosis inbiliary epithelia by a Fas-Fas-ligand-dependent mechanism. AmJ Physiol 1999;277(3Pt1):G599–608.
- Rieux-Laucat F, Fischer A, Deist FL. Cell-death signalling and human disease. CurrOpin Immunol 2003;15(3):325–31.
- Buzyn A, Petit F, Ostankovitch M, Figueiredo S, Varet B, Guillet JG, et al.. Mambran-Bound Fas (Apo-1/CD95) Ligandon leukemic cells: a mechanism of tumor immune escape in leukemia patients. Blood 1999;94(9):3135–40.
- Bennett JM, Catovsky D, Daniel MT. Proposals for the classification of the acuteleukemias. French-American-British (FAB) co-operative Group. BrJ Haematol 1976;33:451–8.
- Mrozek K, Heinonen K, de la Chapette A, Bloomfield CD. Clinical significance of cytogenetics in acutemyeloid leukemia. Semin Oncol 1997;24:17–31.
- Schoch C, Schnittger S, Klaus M, Kern W, Hiddemann W, Haferlach T. AML with 11q23/MLL abnormalities as definedby the WHO classification: incidence, partner chromosomes, FAB subtype, agedistribution, and prognostic impact in an unselected series of 1897 cytogeneticallyanalyzed AML cases. Blood 2003;102:2395–420.
- Rothe G, Schmitz G. (working group on flow cytometry and imageanalyses). Consensus protocol for the flow cytometric immunophenotying ofhematopoietic malignancies. Leukemia 1996;10:877–95.
- Graf M, Hecht K, Reif S, Pelka-Fleischer R, Pfister K, Schmetzer H. Expression and prognostic value of hemopoieticcytokine receptors in acute myeloid leukemia (AML): implications for futuretherapeutical strategies. Eur J Haematol 2004;72(2):89–106.
- Iijima N, Miyamura K, Itou T, Tanimoto M, Sobue R, Saito H. Functional expression of Fas (CD95) in acutemyeloid leukemia cells in the context of CD34 and CD38 expression: possiblecorrelation with sensitivity of chemotherapy. Blood 1997;90(12):4901–9.
- Almodovar R, Zarco P, Quiros FJ, Mazzucchelli R. Infliximab treatment efficacy in lymphoedemaassociated with ankylosing spondylitis. Rheumatol 2004;43(11):1456.
- Shipmann CM, Croucher PI. Osteoprotegerin is a soluble decoy receptorfor tumor necrosis factor-related apoptosis-inducing ligand/Apo 2 ligand andcan function as a paracrine survival factor for human myeloma cells. CancerRes 2003;63(5):912–6.
- Riccioni R, Pasquini L, Mariani G, Saulle E, Rossini A, Diverio D, et al.. Trail decoy receptors mediate resistanceto acute myeloid leukemia cells to TRAIL. Haematologica 2005;90(5):612–24.
- Insinga A, Monestiroli S, Ronzoni S, Gelmetti V, Marchesi F, Viale A, et al.. Inhibitors of histone deacetylasesinduce tumor-selective apoptosis through activation of the death receptorpathway. Nat Med 2005;11(1):71–6.
- Xue C, Lan-Lan W, Bei C, Jie C, Wei-Hua F. Abnormal Fas/FasL and caspase-3-mediated apoptoticsignaling pathways of T lymphcyte subsets in patients with systemic lupuserythematosus. Cell Immunol 2006;239(2):121–8.
- Lickliter JD, Kratzke RA, Nguyen PL, Niehans GA, Miller JS. Fas ligand is highly expressed in acute leukemiaand during the transformation of chronic myeloid leukemia to blast crisis. ExpHematol 1999;27(10):1519–27.
- Lee IJ, Chung IJ, Park MR, Ryang DW, Park CS, Kim HJ. Increased angiogenesis and Fas-ligand expressionare independent processes in acute myeloid leukaemia, Leuk Res 2001;25(12):1067–73.
- Min YJ, Lee HJ, Choi SJ, Chi HS, Lee JS, Kim WK, et al.. Prognostic significance of Fas(Cd95)and TRAIL receptors (DR4/DR5) expression in acute myelogenous leukaemia. LeukRes 2004;28(4):39–65.
- Lewis NR, Pallis M, Russel NH. Fas receptor-Fas ligand system is independentof both CD34 status and chemosensitivity in acute myeloid leukemis. ExpHematol 2000;28(5):535–42.
- Iwai K, Miyawaki T, Takizawa T, Konno A, Ohta K, Yachie A, et al.. Differential expression of bcl-2 andsusceptibility to anti-Fas-mediated cell death in periphl blood lymphocytes,monocytes and neutrophils. Blood 1994;84(4):1201–8.
- Zhao S, Wang HX, Mao H, Xiao J, Zou P. Expression and its significance of TRAIL andits receptors in cells of patients with acute myeloid leukaemia. ZhongguoShi Yan Xue Za Zhi 2005;13(1):65–9.
- Bene MC, Castoldi G, Knapp W, Ludwig WD, Matutes E, Ofao A, et al.. Proposal for the immunological classificationof acute leukemias. European Group for the Immunological Characterizationof Leukemias (EGIL). Leukemia 1995;9(10):1783–6.
- Findley HW, Zhou M. The clinical significance of Fas expressionin leukemia; questions and controversies. Leukemia 1999;13(2):147–9.
- Kelley S, Ashkenazi A. Targeting death receptors in cancer with Apo-2L/TRAIL. CurrOpin Pharmacol 2004;4(4):333–9.
- Johnston JB, Karborl AF, Strutinsky J, Hu X, Paul JT, Kropp DM. Role of the TRAIL/APO2-L death receptors inchlorambucil-and fludarabine-induced apoptosis in chronic lymphcytic leukemia. Oncogene 2003;22(51):8356–69.
- Insinga A, Minucci S, Palicci PG. Mechanisms of selective anticancer actionof histone deacetylase inhibitors. Cell Cycle 2005;4:741–3</pages>.
- Selleri C, Maciejewski JP, Pane F, Luciano L, Raiola AM, Mostarda I. Fas-mediated modulation of Bcr/Abl in chronicmyelogenous leukemia results in differential effects on apoptosis. Blood 1998;92(3):981–9.
- Kasibhatla S, Genstier L, Green DR. Regulation of fas-ligand expression duringactivation-induced cell death in T lymphocytes via nuclear factor kappa B. JBiol Chem 1999;274(2):987–92.
- Morales J, Magana MJ, Ruiz-Ruiz C. Regulation of the resitance to Trail-inducedapoptosis in human primary T lymphocytes: role of NF-κB inhibition. MolImmunol 2007;44(10):2587–97.
- Dorothee G, Vergnon I, Menez J, Echchakir H, Grunenwald D, Kubin M. Tumor-infiltrating CD4+ Tlymphocytes express APO2 ligand (APO2L)/TRAIL upon specific stimulation withantologous lung carcinoma cells: role of IFN-alpha on APO2L/TRAIL expressionand-mediated cytotoxity. J Immunol 2002;169(2):809–17.
- Hasegawa H, Yamada Y, Harasawa H, Tsuji T, Murata K, Sugahara K. Restricted expression of tumor necrosis factor-relatedapoptosis-inducing ligand receptor 4 in human peripheral blood lymphocytes. CellImmunol 2004;231(1–2):1–7.