Abstract
Flow cytometric analysis of cell suspensions involves the sequential 'registration' of intrinsic and extrinsic paramaters of thousands of cells in list mode files. Thus, it is almost irresistible to describe phenomena in numerical terms or by 'ratios' that have the appearance of 'accuracy' due to the presence of numbers obtained from thousands of cells. The concepts involved in the detection and characterization of B cell lymphoproliferative processes are revisited in this paper by identifying parameters that, when analyzed appropriately, are both necessary and sufficient. The neoplastic process (cluster) can be visualized easily because the parameters that distinguish it form a cluster in multidimensional space that is unique and distinguishable from neighboring clusters that are not of diagnostic interest but serve to provide a background. For B cell neoplasia it is operationally necessary to identify the multidimensional space occupied by a cluster whose kappa:lambda ratio is 100:0 or 0:100. Thus, the concept of kappa:lambda ratio is without meaning and would not detect B cell neoplasia in an unacceptably high number of cases.
B-cell lymphoproliferative processes are conceptually qualitative phenomena.
It does not quite matter how much of a cell suspension from the bone marrow, the peripheral blood or from a lymph node, is clonal (i.e. arbitrary ‘ratios’). Rather, it matters that there be a ‘clonal’ population, defined by the restriction of surface or cytoplasmic immunoglobulin light chains and/or other intrinsic or extrinsic cellular properties. In flow cytometric language, this translates into the identification of a series of attributes, defined by ‘parameters’ that allow us to observe a ‘cluster’ that occupies a unique ‘space’, either in Euclidean (X,Y,Z) or non-Euclidean (n-dimensional) terms.
Proper conceptualization and analysis enable us to detect minimal disease (minimal detectable disease and/or minimal residual disease) in a more interactive, efficient, and robust manner.
This discussion will focus on current, and perhaps controversial, concepts, ranging from flow cytometric detection and analysis of unique populations to the conceptual reorganization of ingrained quantitative criteria and ‘dogma’ in an effort to make analysis more interactive.
Flow Cytometric Parameters
In list mode analysis, all cells will have a unique registry composed of a combination of intrinsic (scatter) and extrinsic (fluorescence) parameters.
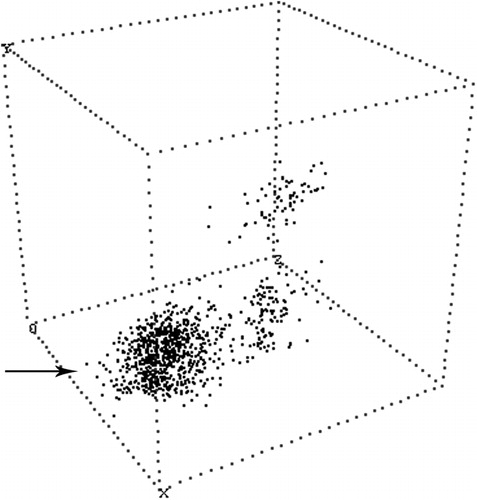
Correlation of side scatter versus CD45 fluorescence provides an efficient method to analyze bone marrow specimens, particularly when working with acute leukemias.Citation1 However, because some B-cell lymphoproliferative processes may be defined biologically by cell size, and the most efficient correlate of size is forward scatter (FSC), this is the more useful parameter to examine.Citation2 When correlated with fluorescence and fluorescence intensity,Citation3 one can define subpopulations of B-cells in a cell suspension. illustrates this concept.
Figure 1. Illustrates the notion of a diagnostic ’cluster‚ occupying a unique location in multidimensional space: the X axis is CD20, the Y axis is CD103, and the Z axis is surface immunoglobulin Lambda light chain. While the CD103 negative B (CD20) cells are polyclonal, the CD103 positive B cells are monoclonal. Thus, the coexpression of CD20, CD103 and lambda light chain, displayed as a cluster, are both necessary and sufficient to detect residual Hairy Cell Leukemia.
Redefinition of ‘Normal’ Kappa/Lambda Ratios
Operationally, rather than applying quantitative measurements to qualitative phenomena, we have strived to identify the multidimensional location of clonal B-cell populations wherein the true kappa/lambda ratio is either 100∶0 or 0∶100. Furthermore, having identified this ‘cluster’ and its location, we can detect approximately 0·1% clonal B-cells in a background of polyclonal B-cells, where the traditional kappa/lambda ratio would be ‘normal’.
Operational Definitions
While these definitions can be expanded, for the purposes of day to day analysis of B-cell lymphoproliferative disorders, the following statements are operationally efficient and constitute the basis of our analytical strategy:
1. polyclonal B-cell populations: the kappa/lambda ratio of a polyclonal population is approximately 60∶40 or 40∶60;
2. monoclonal B-cell populations: the kappa/lambda ratio of a monoclonal population is approximately 100∶0 or 0∶100.
Quantitative (‘Ratios’) versus Qualitative Analysis
For many years, and to this day, many experts rely on the alteration of a normal ratio between kappa and lambda surface or cytoplasmic light chainsCitation4–Citation6 (and numerous other publications). A less numerical analysis, but more precise in its ability to detect minimal disease, relies on the concept of ‘interactive data analysis’,Citation7 wherein the trained observer simply displays data appropriately and ‘looks’ for the clonal population.
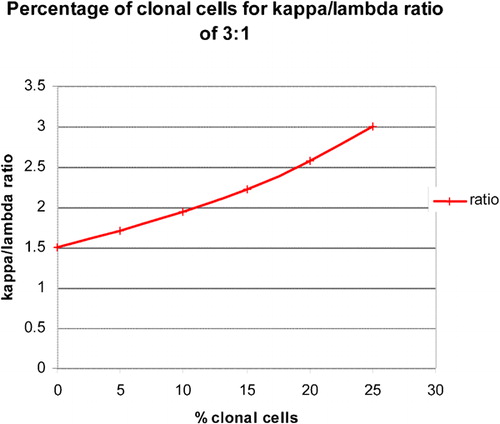
Traditionally, a ratio of 1∶3 or 3∶1 is considered normal and lower or higher ratios considered abnormal. As illustrated in , this would not detect clonal populations admixed with polyclonal cells until the clonal process constituted more than 25% of the total cell suspension.Citation8 Thus, minimal disease would go undetected.
Figure 2. Beginning with a kappa/lambda proportion of 60∶40, the ratio was recalculated following the progressive addition of monoclonal (kappa positive) B cells. In order to exceed a ‘predefined’ normal kappa/lambda ratio, there would need to be greater than 25% clonal cells in the suspension.
With this in mind, we will illustrate how to identify the unique multidimensional space where a 100% kappa or lambda population exists and determine its location with respect to the ever present polyclonal counterpart.
The concept of assigning an n-dimensional space to cells that exhibit common characteristics that differentiate them from others has been previously explored in the identification of precursor B-cell acute lymphoblastic leukemia and its differentiation from resurgent hematogones.Citation9
References
- Rainer RO, Hodges L, Seltzer GT. CD 45 gating correlates with bone marrow differential. Cytometry. 1995;22:139–45.
- Braylan RC. Impact of flow cytometry on the diagnosis and characterization of lymphomas, chronic lymphoproliferative disorders and plasma cell neoplasias. Cytometry. 2004;58:57–61.
- Almasri NM, Duque RE, Iturraspe J, Everett ET, Braylan RC. Reduced expression of CD20 antigen as a characteristic marker for chronic lymphocytic leukemia. Am J Hematol. 1992;40:259–63.
- Delville JP, Heimann P, El Housni H, Boutriaux M, Jeronnez A, Remmelink M, et al.. Biclonal low grade B-cell lymphoma confirmed by both flow cytometry and karyotypic analysis in spite of a normal Ig kappa/lambda ratio. Am J Hematol. 2007;82(6):473–80.
- Chizuka A, Kanda Y, Nannya Y, Oshima K, Kaneko M, Yamamoto R, et al.. The diagnostic value of kappa/lambda ratios determined by flow cytometric analysis of biopsy specimens in B-cell lymphoma. Clin Lab Haematol. 2002;24:33–36.
- Chen HI, Akpolat I, Mody DR, Lopez-Terrada D, de Leon AP, Luo Y, et al.. Restricted kappa/lambda ratio by flow cytometry in germinal center B cells in Hashimoto thyroiditis. Am J Clin Pathol. 2006;125:42–8. </othinfo>
- Duque RE. Interactive data analysis for flow cytometric evaluation of B-cell neoplasia. Methods Cell Biol. 1994;42:231–42.
- Duque RE. Unpublished observations.
- Finn WG, Carter KM, Raich R, Stoolman LM, Hero AO. Analysis of clinical flow cytometric immunophenotyping data by clustering on statistical manifolds: treating flow cytometry data as high-dimensional objects. Cytometry. 2009;76: 1–7.