Abstract
Objectives
Rett syndrome (RTT) is an X-linked autism spectrum disorder caused by mutations in the MeCP2 gene in the great majority of cases. Evidence suggests a potential role of oxidative stress (OS) in its pathogenesis. Here, we investigated the potential value of OS markers (non-protein-bound iron (NPBI) and F2-isoprostanes (F2-IsoPs)) in explaining natural history, genotype-phenotype correlation, and clinical heterogeneity of RTT, and gauging the response to omega-3 polyunsaturated fatty acids (ω-3 PUFAs).
Methods
RTT patients (n = 113) and healthy controls were assayed for plasma NPBI and F2-IsoPs, and intraerythrocyte NPBI. Forty-two patients with typical RTT were randomly assigned to ω-3 PUFAs supplementation for 12 months. NPBI was measured by HPLC and F2-IsoPs using a gas chromatography/negative ion chemical ionization tandem mass spectrometry (GC/NICI-MS/MS) technique.
Results
F2-IsoPs were significantly higher in the early stages as compared with the late natural progression of classic RTT. MeCP2 mutations related to more severe phenotypes exhibited higher OS marker levels than those of milder phenotypes. Higher OS markers were observed in typical RTT and early seizure variant as compared with the preserved speech and congenital variants. Significant reduction in OS markers levels and improvement of severity scores were observed after ω-3 PUFAs supplementation.
Discussion
OS is a key modulator of disease expression in RTT.
Introduction
Rett syndrome (RTT) (OMIM 312750) is a pervasive neurological disorder, and a relatively rare form of autism spectrum disorder affecting almost exclusively females with a worldwide frequency of about 1:10 000, and for which no effective cure exists to date. While a single monogenic mutation in the methyl-Cytosine–phosphate–Guanine (CpG) binding protein 2 (MeCP2) is known to cause RTT in up to 95% of cases,Citation1,Citation2 mutations in other two genes are involved in RTT: cyclin-dependent kinase-like 5 (CDKL5)Citation3 determining the early seizure variant (ESV) of RTT and forkhead box protein G1 (FOXG1)Citation4 recently associated with the congenital variant (CV).
Hallmark features of the typical disease includes an apparently normal developmental period followed by neurological regression at around 6–18 months of age exhibiting a diagnostic tetrad (i.e. ‘main criteria’: (i) partial or complete loss of acquired purposeful hand skills, (ii) partial or complete loss of acquired spoken language, (iii) gait dyspraxia, and (iv) stereotypic hand movements),Citation5 and its natural history usually progresses in four clinical stages (I–IV).Citation6 Atypical RTT (about 26% of all cases) is diagnosed on the basis of a period of regression followed by recovery or stabilization with the presence of at least 2 of the 4 main criteria plus 5 out of 11 supportive criteria.Citation5 To date, ESV, preserved speech (PSV), and CV are the only recognized clinical variants.Citation5 Emerging evidence suggests a previously unrecognized role of oxidative stress (OS) in the pathogenesis of the disease. In the present study, we investigated the potential value of OS markers (non-protein-bound iron (NPBI) and F2-isoprostanes (F2-IsoPs)) in explaining natural progression, genotype–phenotype correlation, and clinical heterogeneity of RTT, as well as their use as targets for gauging the response to omega-3 polyunsaturated fatty acids (ω-3 PUFAs), known as antioxidants with multiple actions.Citation7
Subjects and methods
Subjects
The study included 113 RTT female patients with different clinical diagnosis: typical RTT (n = 91, mean age: 11.8 ± 4.9 years; range 1.5–32) with demonstrated MeCP2 mutation, PSV (n = 10, mean age: 18.1 ± 8.7 years; range: 8–30) with demonstrated MeCP2 mutation, ESV (n = 9, mean age: 9.3 ± 3.3 years; range: 4–14) with demonstrated CDKL5 mutation, and CV (n = 3, mean age: 11.7 ± 8.0 years; range: 4–20) with demonstrated FOXG1 mutation.
A different cohort of 42 patients with a clinical diagnosis of typical RTT was included in ω-3 PUFAs oral supplementation pilot study (see the paragraph below). RTT diagnosis and inclusion/exclusion criteria were based on the recently revised RTT nomenclature consensus.Citation5 All the patients were consecutively admitted to the Rett Syndrome National Reference Centre of the University Hospital of the Azienda Ospedaliera Universitaria Senese (AOUS). The subjects examined in this study were on a typical Mediterranean diet. The study was restricted to assessment of cases with the nine most frequently reported MeCP2 mutationsCitation8,Citation9 plus large gene deletions.
Gender-matched healthy control subjects of comparable age (n = 44, all females; age: 12 ± 4.5 years, range 1.8–34) were also included. Blood samplings in the control group were carried out during routine health checks, sports, or blood donations.
The study was conducted with the approval of the Institutional Review Board and all informed consents were obtained from either the parents or the legal tutors of the enrolled patients. All blood samplings in patients were carried out during the periodic clinical checks.
Disease stages and typical RTT
Among typical RTT patients, 6 were on stage I (mean age: 1.8 ± 0.4 years; range: 1.5–2.5), 16 on stage II (mean age: 6.5 ± 1.4 years; range: 4.5 −10), 46 on stage III (mean age: 12.4 ± 5.6 years; range: 6–25), and 23 on stage IV (mean age: 16.4 ± 7.0 years; range: 8.5–32).
ω-3 PUFAs oral supplementation
ω-3 PUFAs are interesting therapeutical candidates in RTT due to their multiple actions as antioxidants and membrane neuroprotection effects.Citation7,Citation10
A cohort of patients (n = 21, mean age 12.2 ± 7.6 years; range: 5–26) with a clinical diagnosis of typical RTT were supplemented with ω - 3 PUFAs for 12 months. An average dose of 20–40 mg/kg b.w./day of commercially available ω-3 PUFAs, with docosahexaenoic acid (DHA) plus eicosapentaenoic acid (EPA) as ethyl esters preparation with an EPA to DHA ratio of about 1.5 (Eskim, Sigma-Tau, Pomezia, Roma, Italy) was administered orally. A parallel examination in 21 unsupplemented, age-matched typical RTT patients was carried out.
Use of EPA plus DHA in RTT was approved by the AOUS Ethical Committee.
Phenotype severity scoring
RTT clinical severity was assessed using the clinical severity score (CSS), a validated clinical rating specifically designed for RTT, based on 13 individual ordinal categories measuring clinical features common in RTT.Citation11
Blood sampling
Blood was collected in heparinized tubes and all manipulations were carried out within 2 hours after sample collection. Blood samples were centrifuged at 2400 × g for 15 minutes at 4°C. The platelet poor plasma was saved and the buffy coat was removed by aspiration. The red blood cells were washed twice with physiological solution, resuspended in Ringer's solution, as previously reportedCitation12 for the determination of intraerythrocyte NPBI (IE-NPBI). Plasma was used for determination of NPBI (P-NPBI), and free F2-IsoPs. For F2-IsoPs measurements, butylated hydroxytoluene (90 µM) was added to plasma, as an antioxidant, and the sample was stored under nitrogen at −70°C until analysis.
Intra-erythrocyte and plasma NPBI
Intra-erythrocyte and plasma NPBI were determined as a desferrioxamine–iron complex by high-performance liquid chromatography, as previously reported.Citation12
Plasma F2-IsoPs
Plasma F2-IsoPs were measured by gas chromatography/negative ion chemical ionization tandem mass spectrometry/mass spectrometry analysis. The measured ion was the product ion at m/z 299 from 15-F2t-IsoP, also referred as 8-iso-PGF2α or 8-epi-PGF2α, the most represented F2-isoprostane isomer.Citation12,Citation13
Data analysis
Data were expressed as means ± SD, unless otherwise stated. All variables were tested for normal distribution (D'Agostino–Pearson test). Differences between groups were evaluated using independent sample t-test, Mann–Whitney rank sum test, chi-square statistics of Fisher's exact test, one-way analysis of variance (ANOVA), Student–Newman–Keuls post-hoc test, or Kruskal–Wallis test, as appropriate. Associations between variables were tested by univariate regression analysis. Two-tailed P values <0.05 were considered significant if not otherwise specified. Correction for multiple comparisons was made (Bonferroni's correction). The MedCalc version 9.5.2.0 statistical software package (MedCalc Software, Mariakerke, Belgium) was used.
Results
OS markers and RTT clinical variants
Patients with typical RTT had significantly higher markers of OS than those with atypical phenotype, including P-NPBI (typical: 1.0 ± 0.5 nmol/ml vs. atypical: 0.6 ± 0.3 nmol/ml, P = 0.0006), IE-NPBI (1.4 ± 0.7 vs. 0.7 ± 0.2 nmol/ml, P = 0.0003), and F2-IsoPs (58 ± 2.5 vs. 35.9 ± 13.9 pg/ml, P < 0.0001).
Although ESV patients showed OS marker levels comparable to those of typical RTT patients, PSV patients showed OS marker levels lower than those of the typical and ESV RTT presentation (A–C).
Figure 1. OS markers (A, P-NPBI; B, IE-NPBI; C, plasma F2-IsoPs) levels in typical RTT, ESV, preserved speech variant (PSV), and CV. All the statistical significant differences were reported. IE-NPBI was reported as nmol/ml packed erythrocytes.
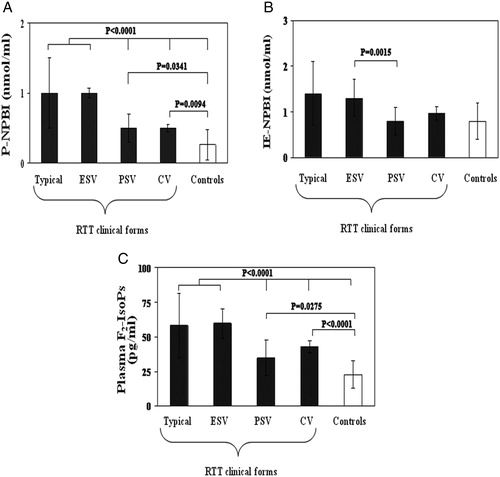
F2-IsoPs and P-NPBI levels in PSV patients were significantly higher than those of the age-comparable healthy controls (F2-IsoPs: 34.4 ± 13.0 vs. 22.2 ± 9.5 pg/ml, P = 0.0275; P-NPBI: 0.5 ± 0.2 vs. 0.3 ± 0.2 nmol/ml, P = 0.0341). Whereas IE-NPBI levels were comparable to those of the healthy controls (0.8 ± 0.3 vs. 0.7 ± 0.3 nmol/ml, P = 0.4657). Patients with CV and FOXG1 gene mutations showed P-NPBI levels significantly higher than those of healthy controls and significantly lower than those of ESV and classic RTT, whereas no significant difference with PSV was observed. IE-NPBI values in CV were not significantly different from those of the other RTT categories (P > 0.20) or the healthy control group (P = 0.1540). Plasma F2-IsoPs levels in CV were intermediate between ESV (P = 0.0250) and controls (P < 0.0001) (A–C).
OS markers and typical RTT natural history
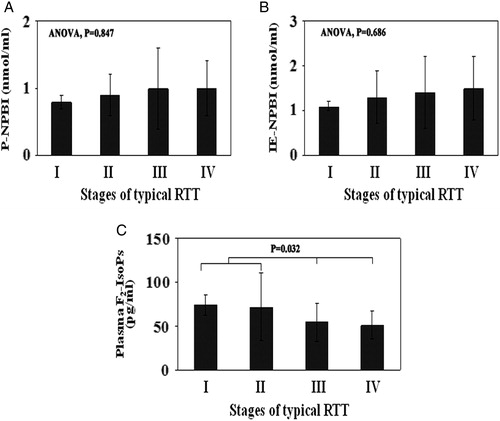
The analysis of the behavior of the selected OS markers as a function of the natural history of the typical disease showed F2-IsoPs levels significantly higher in stages I and II than in stages III and IV, whereas no significant changes for P-NPBI and IE-NPBI were observed (A–C).
Figure 2. OS markers (A, P-NPBI; B, IE-NPBI; C, plasma F2-IsoPs) levels in the different stages of the typical RTT. In all stages of the disease (I–IV), F2-IsoPs levels were significantly different compared to healthy controls (P < 0.001). All the statistical significant differences were reported. IE-NPBI was reported as nmol/ml packed erythrocytes.
OS markers and MeCP2 gene mutations
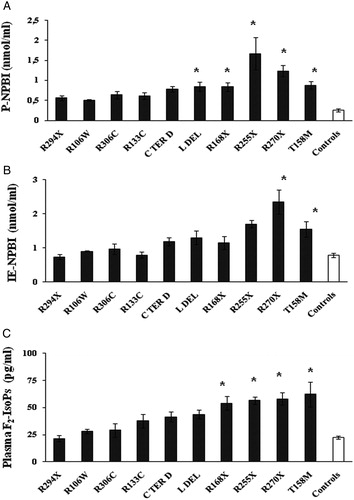
Observed MeCP2 mutations were R106W (n = 6), R133C (n = 8), T158M (n = 10), R168X (n = 8), R255X (n = 11), R270X (n = 12), R294X (n = 8), R306C (n = 6), C-terminal deletions (C TER D) (n = 20), and large deletions (L DEL) (n = 12). Overall, there were 32 deletions, 30 missense mutations, and 39 non-sense mutations.
Plasma F2-IsoPs levels in T158M, R270X, R255X, and R168X were largely increased, about ×2.5-folds, as compared to controls. Plasma NPBI levels in R255X (about ×7.3-folds), in R270X (×5.4), and in T158M, R168X, L DEL, C TER D (about ×3.5) patients were significantly increased, as compared to controls. Intra-erythrocyte NPBI levels in R270X (about ×3-folds), and in T158M (×2) were significantly increased, as compared to controls (A–C).
Figure 3. OS markers (A, P-NPBI; B, IE-NPBI; C, plasma F2-IsoPs) as a function of MeCP2 mutation type. Asterisks denote significant differences (P < 0.05) as compared to healthy controls. All data were expressed as means ± SE. IE-NPBI was reported as nmol/ml packed erythrocytes. C TER D, C-terminal deletion; L DEL, large MeCP2 gene deletion.
Significant statistical associations between plasma F2-IsoPs, P-NPBI, and IE-NPBI levels and a series of clinical severity markers, including early regression, severe head growth deceleration, major motor impairment, hand use loss, and seizures were observed (y = 1.0369x + 21.471, R2 = 0.5036; y = 0.0234x + 0.3659, R2 = 0.4054; y = 0.0321x + 0.5914, R2 = 0.3969, respectively).
OS markers and supplementation with ω-3 PUFAs (EPA plus DHA)
Following 12 months of ω-3 PUFAs supplementation, all the OS markers levels were significantly reduced as compared to time zero values (−64, −69.4, and −41% respectively, P < 0.001). (A–C). Significant differences were already observed in the treated group at time 6 months.
Figure 4. OS markers (A, P-NPBI; B, IE-NPBI; C, plasma F2-IsoPs) levels in ω-3 PUFAs supplemented and unsupplemented typical RTT patients. OS markers were quantified in patients with a clinical diagnosis of typical RTT supplemented (20–40 mg/kg b.w./day) with ω-3 PUFAs for 12 months, and compared to OS markers levels determined in unsupplemented typical RTT patients and healthy control subjects. *P = 0.036 vs. healthy controls. **P = 0.0245 vs. healthy controls. IE-NPBI was reported as nmol/ml packed erythrocytes. mo.s, months.
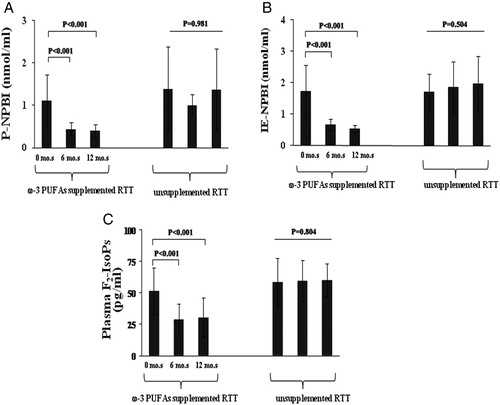
At time 12 months of EPA plus DHA supplementation, F2-IsoPs and P-NPBI levels were still significantly higher than those of age-comparable healthy controls (F2-IsoPs: 30.3 ± 15.2 vs. 21.9 ± 6.5 pg/ml, P = 0.0245; P-NPBI: 0.4 ± 0.1 vs. 0.3 ± 0.2 nmol/ml, P = 0.036), whereas IE-NPBI levels were normalized (treated patients: 0.5 ± 0.1 nmol/ml vs. healthy controls: 0.7 ± 0.3 nmol/ml, P = 0.07).
In the EPA plus DHA supplemented group, clinical severity decreased of 25.5 and 30.1% at 6 and 12 months, respectively (CSS at time zero: 26.2 ± 11.2; CSS at time 6 months: 19.52 ± 8.7; CSS at time 12 months: 18.3 ± 7.8; ANOVA P< 0.005; pairwise comparisons time 0 > time 6 months = time 12 months). Conversely, no significant differences in clinical severity were observed in the unsupplemented group of patients (CSS at time zero: 26.0 ± 11.1; CSS at time 12 months: 26.5 ± 10.9; P = 0.911). Major improvements were observed in the areas of attention, breathing abnormalities, muscular tone, ambulation, autonomic dysfunction, and somatic growth.
Discussion
OS in typical and atypical RTT
OS markers are unequally distributed among the different clinical presentation of RTT. In particular, typical RTT and ESV show higher OS than PSV and CV. Genes mutations in typical RTT and ESV can be inter-related, as either a biochemical (MeCP2 phosphorylation by CDKL5)Citation3 and/or genetic (CDKL5 is a target of MeCP2)Citation14 link is known between the two genes (MeCP2 and CDKL5), whose mutation give rise to differential phenotypic expression.
Hence, this close relationship between genes determining two different forms of the disease (typical or ESV) may explain the comparable levels of OS markers found in RTT patients. PSV is known to be a milder form of RTT, usually linked to MeCP2 mutations associated with milder phenotype (C TER D, R133C).Citation15 Consequently, it is not surprising that OS is relatively milder in this particular subset of RTT patients, and our findings strongly reinforce the hypothesis that OS is a key player in the mechanism leading from MeCP2 gene mutation to disease expression.
The OS markers pattern of the CV patients with FOXG1 mutations is more difficult to explain (). While the F2-IsoPs and NPBI patterns are comparable between CV and PSV, 4-hydroxynonenal plasma protein adducts (4HNE-PAs) have been reported to be comparable to controls in CV individuals, but mildly increased in PSV patients.Citation16 Although the limited size of the CV sample and the limited body of knowledge on the biological mechanisms underlying this particular RTT clinical form do not allow data generalization at this stage, our findings suggest that OS is a key feature for RTT classification.
Table 1. Comparisons of OS marker patterns in the different clinical presentations of RTT
OS and the natural history of the disease
Our findings indicate that the NPBI levels (plasma and intraerythrocyte) are elevated, but substantially constant throughout the natural progression of the typical RTT disease. Conversely, F2-IsoPs exhibit a marked raise during the early stages (I and II) of typical RTT. This observation suggests that oxidation of the arachidonic acid, a polyunsaturated fatty acid mainly contained in membrane phospholipids, is an essential component in the pathogenesis of the first two stages of typical RTT, corresponding to the neurological regression and pseudo-autistic phase, respectively.
As a consequence, these data suggest that lipid peroxidation is an essential component of the brain damage, especially in the early stages of the disease.
OS and MeCP2 genotype–phenotype correlations
The OS findings underscore a significant relationship between severity of MeCP2 mutation and severity of the phenotype in RTT. The data strongly suggest that OS mediates phenotype severity in MeCP2-related RTT. The exact mechanisms leading from MeCP2 mutation to OS derangement remain to be clarified. However, we have previously shown that a mild chronic hypoxia occurs in typical RTT, and since 1996Citation17 it has been established the key biological concept that, under hypoxic conditions, OS (i.e., generation of the superoxide radical and iron release from autoxidated hemoglobin, in this case) can paradoxically be generated. These data are also confirmed by our previous studies.Citation18,Citation19 Thus, it is possible that hypoxia may be the common factor underlying the OS imbalance related to the individual MeCP2 mutations.
OS markers and supplementation with ω-3 PUFAs
The ability of ω-3 PUFAs (EPA and DHA ethyl esters) to reduce the OS entity suggests that the pathogenic processes of RTT are, at least partially, potentially reversible. The concept of the disease reversibility is likely the most important notion learned so far from the RTT mouse models, in which a re-activation of MeCP2 has been shown to be able to reverse the phenotype of MeCP2 y/- mice,Citation20 and the results of subsequent experimentsCitation21,Citation22 are in line with this key concept. How the ω-3 PUFAs work in RTT remains to be clarified.
ω-3 PUFAs are known to influence the physical nature of cell membranes and membrane protein-mediated responses, lipid-mediator generation, cell signaling, and gene expression in different cell types.Citation7 In particular, DHA (22:6 n-3), a key ω-3 PUFAs, is an essential constituent of nervous tissue,Citation23 involved in memory formation, excitable membrane function, and neuroprotectionCitation10,Citation24–Citation27 and plays a key role in physiological neurodevelopment.Citation28 Likewise, EPA has been reported to protect against stroke.Citation29
The main action of the administered ω-3 PUFAs in typical RTT might be to counteract the hypoxia component associated with the diseaseCitation12, but their effects are likely to be more complex. For instance DHA, in experimental stroke protects not only neurons but also astrocytes, which are critical for the maintenance and protection of neurons via the secretion of growth factors and other neurotrophic mediators.Citation10 An emerging awareness concerning the critical role of astrocyte abnormalities in RTT to date exists.Citation30–Citation33
We speculate that the partial rescue of OS derangement after ω-3 PUFAs could be related to regeneration of damaged cell membranes in neurons and astrocytes and their anti-inflammatory properties.Citation10
However, the topic of the treatment of RTT with ω-3 PUFAs is a very complex one, and is to be properly addressed in the future by adequate randomized controlled trials. In the present study, ω-3 PUFAs (EPA plus DHA) mainly serve as a corollary finding reinforcing the general concept that OS can mediate clinical severity in RTT, as very recently underlined by our team.Citation34
Oxidative damage and RTT pathogenesis
Despite new molecular, and clinical discoveries on the syndrome, the pathogenesis of RTT remains still to be clarified, also because not all the MeCP2 functions are likely to be known.Citation35 OS is involved in the pathogenic mechanisms of several neurodevelopmental and neurodegenerative disordersCitation36,Citation37 and we and othersCitation38 strongly suggest to play a role also in RTT. This relatively new concept is expected to make clinicians and biologists reconsidering the disease 45 years after the first clinical description.Citation39
The triad of enhanced OS, abnormal mitochondrial metabolism, and dysregulated immune response has very recently been shown to represent the common molecular underpinning of different pervasive neurodevelopmental disorders (autism spectrum disorders, RTT, and Down syndrome), which, although different in etiology, share significant clinical and neuropathological features.Citation40
In RTT the coexistence of mild chronic hypoxia and systemic OS has been firstly shown by our group.Citation12
The findings of this study strongly reinforce the concept that OS is a key modulator of disease expression in RTT and suggest that MeCP2 has previously unrecognized roles in the regulation of molecular targets involved in the adaptive response to OS.
This study also indicates that NPBI and F2-IsoPs can be used as targets for gauging the effects of new potential therapeutic strategies.
Link between MeCP2 mutation and OS enhancement
The link between MeCP2 mutation and OS remains a major challenge for future research. Morphological abnormalities of mitochondria,Citation41–Citation43 and functional defects of the mitochondrial respiratory chain are recognized, but little studied, findings in RTT patients.Citation44,Citation45 In addition, some of the non-neurological manifestations of RTT have been seen in patients with primary respiratory chain disorders.Citation46 The contribution of functional abnormalities of the respiratory chain to the pathogenesis of RTT remains unclear,Citation47 although at a molecular level, an association between MeCP2 and the promoter of ubiquinol-cytochrome c reductase core protein 1 has been demonstrated (Uqcrc1) with subsequent up-regulation of this gene and mitochondrial respiratory chain dysfunction in MeCP2-null mice.Citation48 Cytochrome c oxidase subunit 1 expression is down-regulated exclusively in the frontal cortex of the RTT brain,Citation47 and this down-regulation is a consequence of MeCP2 deficiency, manifesting as a decrease in cyclooxygenase enzyme activity. These two findings would suggest that a defect in MeCP2 activity is likely to result in significant dysfunction of the mitochondrial respiratory chain in the brain and possibly other organs, thus likely contributing to the clinical phenotype variety observed in RTT.
Reinforcing the key relevance of OS damage in the intimate mechanisms of major genetic neurological diseases is a recent genome-wide expression study that indicates enhanced OS and abnormal mitochondrial metabolism as shared features in Down syndrome and RTT.Citation40 Thus, the relationship between OS enhancement and neurodevelopmental disorders is likely not to be linked in an exclusive way with MeCP2 gene mutations, but probably be interpreted in the wider context of an oxidative cascade process triggered by epigenetic dysregulation.
Further studies in RTT mouse modelsCitation49 are expected in the future to possibly provide a better dissection of the link between MeCP2 gene mutation and OS at the molecular level.
Acknowledgments
The study was partially supported by grants from the Toscana Life Sciences (Orphan_0108 Call; title: ‘Nuovi approcci terapeutici nella sindrome di Rett’), Siena, Italy.
This paper is dedicated to professional singer Matteo Setti (Reggio Emilia, Italy, official web site: http://www.matteosetti.it) as his precious collaboration surprisingly triggered our studies on oxidative stress in Rett syndrome.
We thank the Azienda Ospedaliera Universitaria Senese Hospital Administration for mass spectrometer purchasing, and Roberto Faleri (Central Medical Library, University of Siena, Siena, Italy) for online bibliographic assistance.
We acknowledge ‘Cell Lines and DNA Bank of Rett syndrome and other X mental retardation’ (Prof. A. Renieri, Medical Genetics Unit-Siena) for gene mutations analyses.
Conflicts of interest: All authors declare that they have no conflicts of interest related to the present study.
References
- Amir RE, Van den Veyver IB, Wan M, Tran CQ, Francke U, Zoghbi HY. Rett syndrome is caused by mutation in X-linked MECP2, encoding methyl-CpG-binding protein 2. Nat Genet 1999;23(2):185–8.
- Chahrour M, Zoghbi HY. The story of Rett syndrome: from clinic to neurobiology. Neuron 2007;56(3):422–37.
- Mari F, Azimonti S, Bertani I, Bolognese F, Colombo E, Caselli R, et al. CDKL5 belongs to the same molecular pathway of MeCP2 and it is responsible for the early-onset seizure variant of Rett syndrome. Hum Mol Genet 2005;14(14):1935–46.
- Ariani F, Hayek G, Rondinella D, Artuso R, Mencarelli MA, Spanhol-Rosseto A, et al. FOXG1 is responsible for the congenital variant of Rett syndrome. Am J Hum Genet 2008;83(1):89–93.
- Neul JL, Kaufmann WE, Glaze DG, Christodoulou J, Clarke AJ, Bahi-Buisson N, et al. Rett syndrome: revised diagnostic criteria and nomenclature. Ann Neurol 2010;68(6):944–50.
- Hagberg B. Clinical manifestations and stages of Rett syndrome. Ment Retard Dev Disabil Res Rev 2002;8(2):61–5.
- Calder PC, Yaqoob P. Understanding omega–3 polyunsaturated fatty acids. Postgrad Med 2009;121(6):148–57.
- Christodoulou J, Grimm A, Maher T, Bennetts B. RettBASE: the IRSA MECP2 variation database – a new mutation database in evolution. Hum Mutat 2003;21(5):466–72.
- Sampieri K, Meloni I, Scala E, Ariani F, Caselli R, Pescucci C, et al. Italian Rett database and biobank. Hum Mutat 2007;28(4):329–35.
- Belayev L, Khoutorova L, Atkins KD, Eady TN, Hong S, Lu Y, et al. Docosahexaenoic acid therapy of experimental ischemic stroke. Transl Stroke Res 2011;2(1):33–41.
- Neul JL, Fang P, Barrish J, Lane J, Caeg EB, Smith EO, et al. Specific mutations in methyl-CpG-binding protein 2 confer different severity in Rett syndrome. Neurology 2008;70(16):1313–21.
- De Felice C, Ciccoli L, Leoncini S, Signorini C, Rossi M, Vannuccini L, et al. Systemic oxidative stress in classic Rett syndrome. Free Radic Biol Med 2009;47(4):440–8.
- Signorini C, Comporti M, Giorgi G. Ion trap tandem mass spectrometric determination of F2-isoprostanes. J Mass Spectrom 2003;38(10):1067–74.
- Carouge D, Host L, Aunis D, Zwiller J, Anglard P. CDKL5 is a brain MeCP2 target gene regulated by DNA methylation. Neurobiol Dis 2010;38(3):414–24.
- Renieri A, Mari F, Mencarelli MA, Scala E, Ariani F, Longo I, Meloni I, et al. Diagnostic criteria for the Zappella variant of Rett syndrome (the preserved speech variant). Brain Dev 2009;31(3):208–16.
- Pecorelli A, Ciccoli L, Signorini C, Leoncini S, Giardini A, D'Esposito M, et al. Increased levels of 4HNE-protein plasma adducts in Rett syndrome. Clin Biochem 2011;44(5–6):368–71.
- Balagopalakrishna C, Manoharan PT, Abugo OO, Rifkind JM. Production of superoxide from hemoglobin-bound oxygen under hypoxic conditions. Biochemistry 1996;35(20):6393–8.
- Ciccoli L, Rossi V, Leoncini S, Signorini C, Paffetti P, Bracci R, et al. Iron release in erythrocytes and plasma non protein-bound iron in hypoxic and non hypoxic newborns. Free Radic Res 2003;37(1):51–8.
- Ciccoli L, Rossi V, Leoncini S, Signorini C, Blanco-Garcia J, Aldinucci C, et al. Iron release, superoxide production and binding of autologous IgG to band 3 dimers in newborn and adult erythrocytes exposed to hypoxia and hypoxia-reoxygenation. Biochim Biophys Acta 2004;1672(3):203–13.
- Guy J, Gan J, Selfridge J, Cobb S, Bird A. Reversal of neurological defects in a mouse model of Rett syndrome. Science 2007;315(5815):1143–7.
- Tropea D, Giacometti E, Wilson NR, Beard C, McCurry C, Fu DD, et al. Partial reversal of Rett Syndrome–like symptoms in MeCP2 mutant mice. Proc Natl Acad Sci USA 2009;106(6):2029–34.
- Cobb S, Guy J, Bird A. Reversibility of functional deficits in experimental models of Rett syndrome. Biochem Soc Trans 2010;38(2):498–506.
- Soderberg M, Edlund C, Kristensson K, Dallner G. Fatty acid composition of brain phospholipids in aging and in Alzheimer's disease. Lipids 1991;26(6):421–5.
- Gamoh S, Hashimoto M, Sugioka K, Shahdat Hossain M, Hata N, Misawa Y, et al. Chronic administration of docosahexaenoic acid improves reference memory-related learning ability in young rats. Neuroscience 1999;93(1):237–41.
- McGahon BM, Martin DS, Horrobin DF, Lynch MA. Age-related changes in synaptic function: analysis of the effect of dietary supplementation with omega-3 fatty acids. Neuroscience 1999;94(1):305–14.
- Belayev L, Marcheselli VL, Khoutorova L, Rodriguez de Turco EB, Busto R, Ginsberg MD, et al. Docosahexaenoic acid complexed to albumin elicits high-grade ischemic neuroprotection. Stroke 2005;36(1):118–23.
- Serhan CN, Gotlinger K, Hong S, Lu Y, Siegelman J, Baer T, et al. Anti-inflammatory actions of neuroprotectin D1/protectin D1 and its natural stereoisomers: assignments of dihydroxy-containing docosatrienes. J Immunol 2006;176(3):1848–59.
- Simopoulos AP. Evolutionary aspects of diet: the omega-6/omega-3 ratio and the brain. Mol Neurobiol 2011; Epub, DOI: 10.1007/S12035-010-8162-0.
- Hagiwara H, Nishiyama Y, Katayama Y. Effects of eicosapentaenoic acid on asymmetric dimethylarginine in patients in the chronic phase of cerebral infarction: a preliminary study. J Stroke Cerebrovasc Dis 2011; Epub, DOI: 10.1016/j.jstrokecerebrovasdis 2010.12.006.
- Maezawa I, Jin LW. Rett syndrome microglia damage dendrites and synapses by the elevated release of glutamate. J Neurosci 2010;30(15):5346–56.
- Kifayathullah LA, Arunachalam JP, Bodda C, Agbemenyah HY, Laccone FA, Mannan AU. MeCP2 mutant protein is expressed in astrocytes as well as in neurons and localizes in the nucleus. Cytogenet Genome Res 2010;129(4):290–7.
- Maezawa I, Swanberg S, Harvey D, LaSalle JM, Jin LW. Rett syndrome astrocytes are abnormal and spread MeCP2 deficiency through gap junctions. J Neurosci 2009;29(16):5051–61.
- Ballas N, Lioy DT, Grunseich C, Mandel G. Non-cell autonomous influence of MeCP2-deficient glia on neuronal dendritic morphology. Nat Neurosci 2009;12(3):311–7.
- Signorini C, De Felice C, Leoncini S, Giardini A, D'Esposito M, Filosa S, et al. F4-neuroprostanes mediate neurological severity in Rett syndrome. Clin Chim Acta 2011;412(15–16):1399–1406.
- Gitschier J. On the tracks of DNA methylation: an interview to Adrian Bird. PLOS Genet 2009;5:e1000667. DOI: 10.1371/journal.pgen.1000667.
- Halliwell B, Gutteridge JMC. Free radicals, other reactive species and disease. In: , Halliwell B, Gutteridge JMC (eds.) Free radicals in biology and medicine. Oxford: Clarendon Press; 1999. p. 617–783.
- Seet RC, Lee CY, Lim EC, Tan JJ, Quek AM, Chong WL, et al. Oxidative damage in Parkinson disease: measurement using accurate biomarkers. Free Radic Biol Med 2010;48(4):560–6.
- Sierra C, Vilaseca MA, Brandi N, Artuch R, Mira A, Nieto M, et al. Oxidative stress in Rett syndrome. Brain Dev 2001;23(S1):236–9.
- Rett A. Uber ein eigartiges hirnatrophisches Syndrom bei Hyperammoniamie in Kindesalter. Wien Med Wochenschr 1966;116(37):723–6.
- Lintas C, Sacco R, Persico AM. Genome-wide expression studies in Autism spectrum disorder, Rett syndrome, and Down syndrome. Neurobiol Dis 2010; Epub, DOI: 10.1016/j.nbd.2010.11.010.
- Ruch A, Kurczynski TW, Velasco ME. Mitochondrial alterations in Rett syndrome. Pediatr Neurol 1989;5(5):320–3.
- Wakai S, Kameda K, Ishikawa Y, Miyamoto S, Nagaoka M, Okabe M, et al. Rett syndrome: findings suggesting axonopathy and mitochondrial abnormalities. Pediatr Neurol 1990;6(5):339–43.
- Cornford ME, Philippart M, Jacobs B, Scheibel AB, Vinters HV. Neuropathology of Rett syndrome: case report with neuronal and mitochondrial abnormalities in the brain. J Child Neurol 1994;9(4):424–31.
- Coker SB, Melnyk AR. Rett syndrome and mitochondrial enzyme deficiencies. J Child Neurol 1991;6(2):164–6.
- Heilstedt HA, Shahbazian MD, Lee B. Infantile hypotonia as a presentation of Rett syndrome. Am J Med Genet 2002;111(3):238–42.
- Finsterer J. Mitochondriopathies. Eur J Neurol 2004;11(3):163–86.
- Gibson JH, Slobedman B, Kaipananickal H, Williamson SL, Minchenko D, El-Osta A, Stern JL, et al. Downstream targets of methyl CpG binding protein 2 and their abnormal expression in the frontal cortex of the human Rett syndrome brain. BMC Neurosci 2010;11:53.
- Kriaucionis S, Paterson A, Curtis J, Guy J, MacLeod N, Bird A. Gene expression analysis exposes mitochondrial abnormalities in a mouse model of Rett syndrome. Molec Cell Biol 2006;26(13):5033–42.
- Zoghbi HY, Warren ST. Neurogenetics: advancing the “next-generation” of brain research. Neuron 2010;68(2):165–73.