Abstract
Sugars are part of an integrated redox system, since they are key regulators of respiration and photosynthesis, and therefore of the levels of reducing power, ATP and ROS. These elements are major determinants of the cellular redox state, which is involved in the perception and regulation of many endogenous and environmental stimuli. Our previous findings suggested that early sugar increase produced during compatible Sunflower chlorotic mottle virus (SuCMoV) infection might modulate chlorotic symptom development through redox state alteration in sunflower. The purpose of this work was to characterize redox-related metabolites and gene expression changes associated with high sugar availability and symptom development induced by SuCMoV. The results show that sugar caused an increase in glutathione, ascorbate, pyridine nucleotides, and ATP. In addition, higher sugar availability reduced hydrogen peroxide and ΦPSII. This finding suggests that high sugar availability would be associated with cellular redox alteration and photoinhibitory process. The expression of the genes analyzed was also strongly affected by sugar, such as the down-regulation of psbA and up-regulation of psbO and cp29. The expression level of cytoplasmic (apx-1 and gr)- and chloroplastic (Fe-sod)-targeted genes was also significantly enhanced in sugar-treated leaves. Therefore, all these responses suggest that sugars induce chloroplastic redox state alteration with photoinhibition process that could be contributing to chlorotic symptom development during SuCMoV infection.
Introduction
Soluble sugars, which are commonly defined as mono- and disaccharides, play a major role in the structure and function of all living cells. Sugars are involved in many metabolic and signaling pathways in plants. Both glucose and sucrose are recognized as pivotal integrating regulatory molecules that control gene expression related to plant metabolism, stress resistance, growth and development.Citation1 Notably, sugars play a key role in the repression of photosynthesis.Citation2 During plant–pathogen interactions, the down-regulation of photosynthesis and the simultaneous increased demand for assimilates very often lead to a transition of source tissue into sink tissue. In addition, sugar signals may contribute to immune responses against pathogens.Citation3 In a previous report we demonstrated that compatible sunflower–Sunflower chlorotic mottle virus (SuCMoV) interaction induces early sugar increases that significantly reduce quantum efficiency of PSII photochemistry (photoinhibition) and photosynthesis-related protein levels (D1 and RubisCO), which were correlated with chlorotic symptom development.Citation4
As mentioned above, soluble sugars and viral infection impaired the photosynthetic and respiratory electron transport, resulting in an increased generation of reactive oxygen species (ROS), such as singlet oxygen (Citation1O2), superoxide radical (O2•−), hydrogen peroxide (H2O2), and hydroxyl radical (OH•).Citation5 ROS production is a common response of plants to stress conditions. Chloroplasts, mitochondria, and peroxisomes are the main source of ROS in plants.Citation6 In addition; the NADPH oxidase complex is a major source of apoplastic ROS.Citation7 The NADPH oxidase complex is responsible for early ROS generation in plant–pathogen interactions. Interestingly, a previous work of our group reported a decrease of NADPH oxidase activity both over the course of SuCMoV infection and in healthy leaves treated with glucose and sucrose.Citation4 Likewise, both soluble sugars and SuCMoV infection induced antioxidant system activity, which scavenged oxidative signals involved in triggering defense reactions in incompatible plant–pathogen interactions.Citation8 Accordingly, the relationship between sugar and ROS signaling has been reported,Citation9–Citation12 in which sugars contribute to the non-enzymatic antioxidant synthesis or could be directly acting as antioxidant in plants.Citation11
The relationships among photosynthetic metabolism, sugars, ROS production, and degradation are particularly relevant to the plant and also major determinants of cellular redox state.Citation13,Citation14 Growing evidence suggests a model for redox homeostasis in which the ROS–antioxidant interaction acts as a metabolic interface for signals derived from metabolism and the environment. These signals are particularly important in defense responses and cross-tolerance phenomena, enabling a general acclimation of plants to stress conditions.Citation15,Citation16
The aim of this work was to determine whether high-soluble sugar availability is associated with redox-related metabolites and transcript changes related to symptom development induced by SuCMoV. This study provides relevant physiological and molecular data about key redox determinants, such as hydrogen peroxide, ascorbate, glutathione, pyridine nucleotides and ATP, together with the expression of genes related to photosynthetic, respiratory, and antioxidant system in sugar-treated sunflower leaves.
Materials and methods
Plant material
Sunflower (Helianthus annuus L.) line L2 seeds were provided by Advanta Semillas SAIC (Balcarce, Argentina). Seeds were sown in pots with sterile soil and grown in a chamber under controlled conditions of 250 µmol photons m−2 s−1 light with a 16-hour light/8-hour dark cycle at 25°C and 65% relative humidity for 2 weeks. The second pair of leaves was excised at the vegetative stages V1–V217 and placed in Petri dishes either with water (C) or with 200 mM sugar solutions: glucose (Gluc), sucrose (Suc), or sorbitol (Sor) during 24 hours.
Total soluble sugars and starch
Extracts were obtained following Guan and JanesCitation18: 2 g of frozen tissue were ground in 2 ml of buffer containing 50 mM HEPES–KOH (pH 8.3), 2 mM EDTA, 2 mM EGTA, 1 mM MgCl2, 1 mM MnCl, and 2 mM DTT (dithiothreitol). The extract was centrifuged at 15 000 rpm at 42°C for 15 minutes and the supernatant was used for soluble sugar determination. Total soluble sugars were measured with anthroneCitation19 using sucrose as standard. Starch was determined in the pellet by measuring reducing sugars released after hydrolysis with α-amyloglucosidase,Citation20 using glucose as a standard.
Chlorophyll fluorescence parameters
Quantum efficiency of PSII photochemistry under artificial light conditions (ΦPSII) was measured according to Rodríguez et al.Citation4
Hydrogen peroxide
Hydrogen peroxide was estimated in leaf extracts, according to Guilbault et al.Citation21 including a blank with catalase (EC 1.11.1.6) for each sample. Frozen leaf samples were ground to a fine powder with liquid nitrogen and homogenized 1/10 (w/v) in 50 mM potassium phosphate buffer (pH 7.5), containing 1 mM EDTA and 1% polyvinylpolypyrrolidone (PVPP). Homogenates were centrifuged at 16 000 × g at 4°C for 25 minutes and the supernatant was used to determine protein and hydrogen peroxide concentrations.
Glutathione and ascorbate content
Leaf samples were prepared for glutathione and ascorbate analyses by homogenizing 100 mg leaf material (fresh weight) in 1 ml of cold 3% trichloroacetic acid and 100 mg PVPP. The homogenate was centrifuged at 10 000 × g at 4°C for 15 minutes and the supernatant was collected for analyses of glutathione and ascorbate.
Reduced glutathione content was determined spectrophotometrically at 405 nm in acid-soluble extracts according to Anderson et al.Citation22 with modifications. Briefly, the samples were neutralized with 200 mM potassium phosphate buffer (pH 7.0) and incubated with 10 mM 5,5′-dithio-bis(2-nitrobenzoic acid) for 15 minutes. Total glutathione content was determined in neutralized samples after reduction of oxidized glutathione (GSSG) with 1 U of wheat glutathione reductase (Sigma Chemical Company, St. Louis, USA), 1 mM EDTA, 3 mM MgCl2, and 150 mM NADPH.
Total ascorbate content was determined according to Gillespie and AinsworthCitation23 with modifications. The reaction mixture for total ascorbate contained a 50-μl aliquot of the supernatant, 25 µl of 150 mM phosphate buffer (pH 7.4) containing 5 mM EDTA, and 25 µl of 10 mM DTT; samples were incubated at room temperature for 10 minutes. After that, the mix was incubated for 60 minutes with 25 µl of 0.5% N-ethylmaleimide (NEM), 16.6% orthophosphoric acid (H3PO4), 1.33% α-α′bipyridyl, and 50 µl of 0.5% FeCl3 at 37°C. The samples were measured at 525 nm in ELISA MRX II. Reduced ascorbic acid content was determined using the same protocol, except for the addition of NEM and DTT.
Pyridine nucleotide content
Pyridine nucleotides were assayed by spectrophotometric plate reader method described by Queval and Noctor.Citation16
ATP content
ATP concentration was determined according to Rodríguez et al.Citation24 using an ENLITEN® ATP Assay System Bioluminescence Detection kit (Promega, Madison, WI).
Total protein content
Soluble proteins were estimated according to Bradford.Citation25 Bovine serum albumin was used as standard for the calibration curves.
RNA extraction
Leaf samples subjected to different treatments were homogenized in cold mortar with trizol (1/10 w/v), mixed for 1 minute and incubated at room temperature for 5 minutes. Then, 0.2 ml of chloroform per ml of trizol was added and incubated at room temperature for 3 minutes. After incubation, the samples were centrifuged at 14 000 rpm at 4°C for 15 minutes. The aqueous phase was transferred to clean tubes and 1 volume of isopropanol was added, incubated at room temperature for 10 minutes and centrifuged at 14 000 rpm at 4°C for 15 minutes. The precipitate was washed with 70% ethanol and centrifuged again at 14 000 rpm at 4°C for 15 minutes. The precipitate was dried, resuspended in diethylpyrocarbonate water and its concentration was quantified in NanoDrop spectrophotometer ND-1000 (NanoDrop Technologies, Thermo Scientific, Wilmington, USA). Purified RNA was treated with DNase I (Invitrogen) to remove any contaminating genomic DNA, according to the manufacturer's instruction.
Analysis of gene expression
Based on cDNA sequences from a sunflower EST catalogue (http://compbio.dfci.harvard.edu/tgi/tgipage.html), specific primers were designed to facilitate the expression of 17 genes (Supplementary ) by real-time PCR.
Table 1. Soluble sugar and starch accumulation (μg.cm−2) in the second pair of sunflower leaves
qRT-PCR
DNA-free RNA (1 to 2.5 µg) was mixed with oligo(dT) for first strand cDNA synthesis using the Moloney murine leukemia virus reverse transcriptase for RT-PCR (Promega), according to the manufacturer's instructions. Primers for qRT-PCR were designed using AmplifX version 1.5.4 by Nicolas Jullien (http://ifrjr.nord.univ-mrs.fr/AmplifX-Home-page) using the following criteria: melting temperature of 61°C, PCR amplicon lengths of 100–220 bp, and yielding primer sequences with lengths of 20 nucleotides and guanine–ytosine contents of 40% to 60% (Supplementary ). qRT-PCR was performed in thermocycler iQ5 (Bio Rad) with iQ SYBR Green Supermix (Bio Rad) according to the manufacturer's instruction. Values were normalized based on those obtained from water-incubated leaves and actin as housekeeping gene. Relative expression levels were calculated by the method of Livak and Schmittgen.Citation26
Statistics
Each measurement of H2O2, ascorbate, glutathione, NAD(P) and ATP was made with three to five leaves obtained from different plants. Each biochemical assay was replicated at least three times independently. Statistical significance of mean differences was estimated with a DGC test (multiple- comparisons method) using Infostat (InfoStat/Profesional ver. 2007p, Grupo InfoStat, Facultad de Ciencias Agropecuarias, Universidad Nacional de Córdoba, Argentina).
Relative gene expression levels were calculated using method of Livak and SchmittgenCitation26 ( and ). ΔCt values for all replicates in the control or treatment groups were tested for statistical variation using parametric Student's t-test. Our data indicated a normal distribution with equal variance. Each measurement of gene expression was made with a pool of three to five leaves obtained from different plants.
Results
Sugar treatment: effect on photosynthesis
The second pair of leaves was detached from sunflower plants and incubated with glucose (Glu) and sucrose (Suc) for 24 hours; this procedure significantly increased both soluble sugar and starch content with respect to the water-incubated control leaves (). Additionally, sugar treatments did not show any phenotype in the leaves (Supplementary Fig. 1).
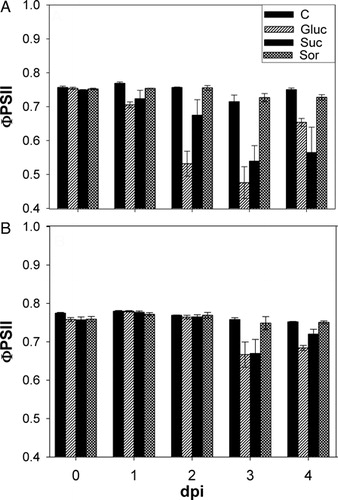
The effect of sugar treatments on photosynthesis was determined by photochemistry quantum efficiency of photosystem II (ΦPSII) derived from chlorophyll fluorescence analysis. The ΦPSII was measured at the base and tip of sunflower healthy leaves incubated either with water or sugar.
The results showed a significant decrease in ΦPSII, initially at the leaf base (24-hour post-incubation, A), whereas decrease in the leaf tip was observed later (3 days post-incubation, B).
Figure 1. Effects of sugar treatment on ΦPSII. ΦPSII was measured at the base (A) and tip (B) of sunflower healthy leaves incubated for 4 days with either water (C) or 200 mM sugar solutions: glucose (Gluc), sucrose (Suc) or sorbitol (Sor). Results are expressed as mean ± SE of four independent experiments.
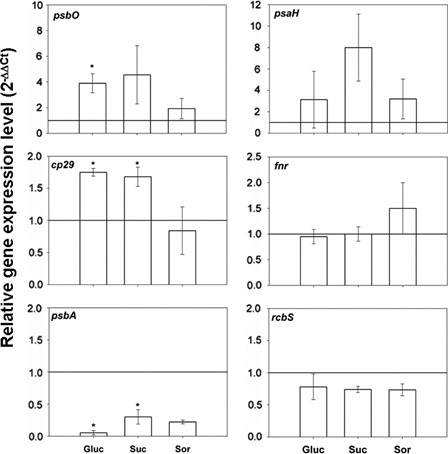
The sugar treatment also affected the expression of photosynthetic genes. Glucose and sucrose treatments induced a down-regulation of psbA gene, whereas cp29 gene expression was up-regulated. Moreover, sunflower leaves treated with glucose showed a significant increase in psbO gene expression, whereas osmotic control (sorbitol 200 mM) did not show any changes in gene expression ().
Figure 2. Photosynthesis-related gene expression from leaves incubated for 24 hours with either water or 200 mM sugar solutions: glucose (Gluc), sucrose (Suc) and sorbitol (Sor). Values were normalized based on those obtained from leaves incubated with water and actin as internal reference gene. Means of three independent biological experiments ± SE are shown. Significant differences were calculated by Student's t-test. *Significance at the 0.05 level of confidence.
Redox-related metabolites: changes in hydrogen peroxide, non-enzymatic antioxidant, pyridine nucleotide and ATP in sugar treatments
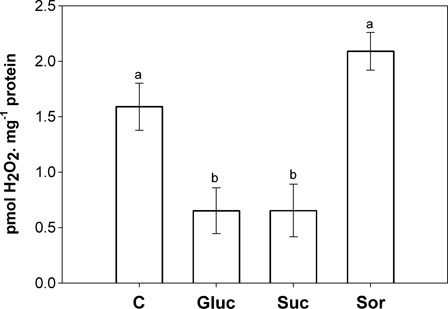
Sugars and SuCMoV infection induce photoinhibition and changes in apoplastic ROS and antioxidant system activities, which are determinants of cellular redox state.Citation4 To further characterize sugar effects on cellular redox state, the key compounds hydrogen peroxide, ascorbate, glutathione, pyridine nucleotides and ATP were measured. Hydrogen peroxide levels were significantly reduced by glucose and sucrose, but not by sorbitol treatments ().
Figure 3. Hydrogen peroxide accumulation in the second pair of leaves incubated for 24 hours with either water (C) or 200 mM sugar solutions: glucose (Gluc), sucrose (Suc) and sorbitol (Sor). Results are expressed as means ± SE of 12 plants in three independent experiments. Different letters indicate significant differences from controls (P < 0.05, DGC).
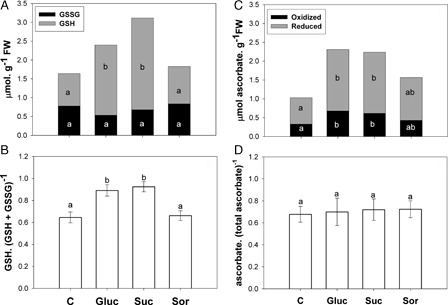
Reduced and total glutathione was higher in glucose- and sucrose-treated leaves versus control with water (A). Furthermore, oxidized glutathione remained constant in all the treatments (A). Therefore, a rise in the redox couple by glucose and sucrose was observed (B). Interestingly, the analysis of ascorbic acid content in sugar-treated leaves revealed an increase in reduced and oxidized ascorbate with respect to control (C). However, no change in the redox couple was observed in the treatment (D).
Figure 4. Effect of sugar treatment on glutathione and ascorbate content in the second pair of leaves incubated for 24 hours with either water (C) or 200 mM sugar solutions: glucose (Gluc), sucrose (Suc) and sorbitol (Sor). (A) Reduced glutathione (GSH grey bars) and oxidized glutathione (GSSG black bars). (B) GSH. (GSH+ GSSG)−1 ratio. (C) Reduced ascorbate (grey bars) and oxidized ascorbate (black bars). (D) ascorbate. (total ascorbate)−1 ratio. Results are means from 12 plants ± SE of four independent experiments. Different letters indicate significant differences from controls (P < 0.05, DGC).
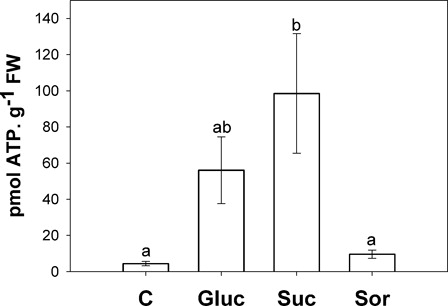
Increased content of NADH and NAD+ was observed in sugar-treated leaves with respect to control (A). In addition, NADPH also rose in sugar treatment, but NADP+ showed an increase only in glucose and sucrose treatments (A). However, the pyridine nucleotides (NAD(P)) did not show redox alteration ( and B). Moreover, ATP content increased significantly in glucose and sucrose treatments ().
Figure 5. (A) NAD+ and NADH content in the second pair of leaves incubated for 24 hours with either water (C) or 200 mM sugar solutions: glucose (Gluc), sucrose (Suc) and sorbitol (Sor). NAD+ (black bars) and NADH (grey bars). (B) NADH. (NADH+ NAD+)−1 ratio. Results are means from 12 plants ± SE of four independent experiments. Different letters indicate significant differences from controls (P < 0.05, DGC).
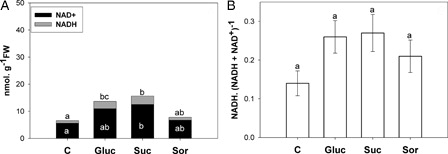
Figure 6. (A) NADP+ and NADPH content in the second pair of leaves incubated for 24 hours with either water (C) or 200 mM sugar solutions: glucose (Gluc), sucrose (Suc) and sorbitol (Sor). NADP+ (black bars) and NADPH (grey bars). (B) NADPH. (NADPH+ NADP+)−1 ratio. Results are means from 12 plants ± SE of four independent experiments. Different letters indicate significant differences from controls (P < 0.05, DGC).
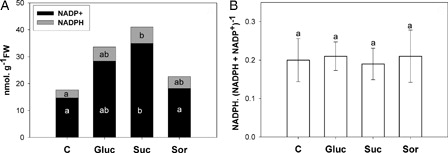
Figure 7. ATP content in the second pair of leaves incubated for 24 hours with either water (C) or 200 mM sugar solutions: glucose (Gluc), sucrose (Suc) and sorbitol (Sor). Results are means from 12 plants ± SE of four independent experiments. Different letters indicate significant differences from controls (P < 0.05, DGC).
Effects of sugar on antioxidant gene expression
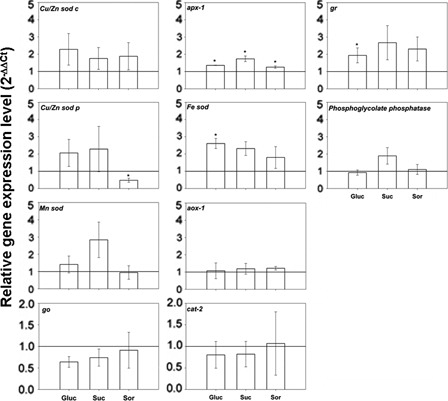
Transcript levels of antioxidant enzymes in sugar-treated leaves versus control with water are shown in . Glucose treatment showed significant increase in cytosolic apx-1 and gr and chloroplastic Fe-sod gene expression. In addition, sunflower leaves treated with sucrose exhibited a rise only in cytosolic apx-1 gene expression. Finally, sorbitol showed a significant increase in cytosolic apx-1 with a decrease in chloroplastic Cu/Zn sod. In general, transcriptional analysis of enzymes involved in photorespiration (phosphoglycolate phosphatase, go and cat-2) and mitochondrial genes (Mn sod and alternative oxidase-1) did not show changes in the treatment.
Figure 8. Antioxidant system gene expression from leaves incubated for 24 hours with either water or 200 mM sugar solutions: glucose (Gluc), sucrose (Suc) and sorbitol (Sor). Values were normalized based on data obtained from water and actin gene as internal reference. Means of three independent biological experiments ± SE are shown. Significant differences were calculated by Student's t-test. *Significance at the 0.05 levels of confidence.
Discussion
Sugars are part of an integrated redox system, since they are key regulators of respiration, photosynthesis, and as a consequence, of reducing power, ATP and ROS levels. These elements are major determinants of the cellular redox state, which is involved in the perception and regulation of many endogenous and environmental stimuli. It has been suggested that early sugar increase produced during compatible SuCMoV interaction could be modulating chlorotic symptom development in sunflower leaves through redox state alteration.Citation24
The present results showed that 24 hours of sugar treatments (200 mM glucose and sucrose) significantly increased endogenous levels of soluble sugars and starch, total and reduced glutathione, glutathione redox couple, total ascorbate, pyridine nucleotide, and ATP contents, all of them associated with a decrease in ΦPSII and psbA gene expression level.
As mentioned above, sunflower leaves treated with sugars (sucrose and glucose) showed high concentration of endogenous soluble sugars. Accordingly, Lunn et al.Citation27 showed a 27-fold increase in trehalose 6-phosphate (T6P) levels within 3 hours of sucrose feeding. T6P levels may reflect the availability of hexose phosphates, UDP-glucose, and sucrose, because sucrose feeds into this pool. In addition, high T6P resulted in accelerated senescence. Schluepmann et al.Citation28 suggested that there may be a link between T6P and sucrose non-fermenting-related kinase-1 (SnRK1), which is a protein kinase involved in plant energy signaling and in regulation of plant metabolism.Citation29,Citation30 Recently, it has been reported that T6P inhibits SnRK1.Citation31 In agreement with the inhibition of SnRK1 by T6P, plants with altered SnRK1 expression also had senescence phenotypes.Citation32 Arabidopsis plants, in which both genes for the catalytic α-subunit of SnRK1 were silenced, showed early senescence under constant illumination.Citation32 These findings suggest that sunflower detached leaves treated with sugar could have a T6P increase with SnRK1 inhibition, and this changes could be related with accelerated senescence.
Likewise, high sugar availability showed a significant decrease of hydrogen peroxide associated with enhanced antioxidant system activity.Citation4 It was recently proposed that higher concentrations of sugars, especially the longer water-soluble oligo- and polysaccharides, such as fructans, might both act as ROS scavengers themselves and have indirect effects, i.e., fuelling of the antioxidant system.Citation10–Citation12,Citation33 Fructans would accumulate in sugar-fed detached leaves and they might act as signaling molecules as well.Citation30 It would be interesting to perform a rigorous quantification of endogenous water-soluble carbohydrates, which might provide very useful information. Intriguingly, changes in fructan concentrations showed a close correlation with changes in ascorbate and GSH concentrations in immature wheat kernels, strongly suggesting a connection with antioxidant systems.Citation12
Glutathione and ascorbate are the major soluble non-enzymatic ROS scavengers, with relatively stable oxidized forms, which are recycled to the reduced form by NADPH-dependent Asada-Halliwell cycle. Although ascorbate, glutathione and pyridine nucleotides are linked by redox flux and function together in the metabolism of ROS, each may have specific roles in providing information on cellular status.Citation34
Sunflower leaves treated with sugars showed a synthesis increase or breakdown decrease in glutathione, ascorbate and pyridine nucleotide pools. Changes in ascorbate content may affect a number of pathways, including thylakoid energy dissipationCitation35 and synthesis of phytohormones, such as gibberellins, abscisic acid, ethylene and salicylic acid.Citation36 The present results showed a significant increase in total ascorbate content without changes in ascorbate redox state in sunflower leaves incubated with sugar. However, during SuCMoV infection, total ascorbate content showed no changes. In addition, both sugars and SuCMoV infection showed increased APX activity.Citation4 These results suggest the action of a highly efficient ascorbate regeneration system, whose network is more complex than mere scavenging within the cellular stress response.Citation37
Sugar availability is related to glutathione biosynthesis and glutathione redox state; these processes, among others, are regulated by the availability of glycine, ATP and reducing power.Citation38 Likewise, the significant increase in glutathione redox couple is supported by the increase in glutathione reductase activity induced by both compatible sunflower–SuCMoV interaction and sugar treatment, as previously demonstrated.Citation4,Citation24
Glutathione is mainly located in chloroplasts, and highly reduced glutathione content induces photoinhibition because it increases the degree of reduction of quinone A (QA), decreasing electron transport efficiency of PSII.Citation39
Moreover, we found increases in pyridine nucleotide content without redox changes during sunflower–SuCMoV interaction.Citation24 The pyridine nucleotides do not function as redox buffers themselves, but regulate the redox state of both electron transport carriers of chloroplasts and mitochondria, and redox metabolites, such as ascorbate, glutathione, and thioredoxin.Citation34 Studies of mutants provide evidence that changes in NAD(P) content can alter photosynthesis and plant stress responses,Citation40 and suggest that NAD(P) content could be a powerful modulator of metabolic integration.Citation40
The ROS–antioxidant interaction and its subcellular location determine the role of ROS and modulate the defense responses and gene expression, including those from the antioxidant system.Citation41,Citation42 The redox state of the plastoquinone pool and ROS are the main chloroplastic signal sources modulating the acclimation responses to environmental conditions that provoke excess excitation energy (EEE).Citation43,Citation44
Overall, our results showed that the transcript levels of cytosolic antioxidant enzyme increased in sugar-treated leaves similarly as during the compatible sunflower–SuCMoV interaction, whereas the chloroplastic antioxidant enzyme decreased. Specifically, one of the stress-related transcripts that showed enhanced expression in response to high sugar availability was cytosolic apx-1. Both APX1 and APX2 are markers of acclimation response to EEE.Citation43,Citation44 Remarkably, sorbitol used as osmotic control showed apx-1 increase without change in APX total activity,Citation4 which provides evidence of the importance of post-translational control in regulating enzyme activities. Additionally to cytosolic apx-1 increase, exogenous glucose feeding showed enhanced cytosolic gr and chloroplastic Fe-sod gene expression, suggesting a link between ROS and sugar signaling.
Considering previous and current results, both high sugar availability and SuCMoV infection induce photoinhibition, degradation of D1 protein, a decrease in psbA gene expression, an increase in GSH content with glutathione redox alteration, and an increase in NAD(P) and ATP.Citation4 All these responses suggest that sugars would induce chloroplastic redox state alteration with over-reduction in QA pool and photoinhibition process that might be contributing to symptom appearance during compatible sunflower–SuCMoV interaction.
Acknowledgments
This work does not present conflict of interest. This work was supported by grants from Consejo Nacional de Investigaciones Científicas y Técnicas (PIP-CONICET 6321), Agencia Nacional de Promoción Científica y Tecnológica (PICT 25982, PICT 2008 0067). MR and HRL are fellows of CONICET. We thank German Robert for technical assistance.
References
- Rolland F, Baena-Gonzalez E, Sheen J. Sugar sensing and signaling in plants: conserved and novel mechanisms. Annu Rev Plant Biol 2006;57:675–709.
- Sheen J. Metabolic repression of transcription in higher plants. Plant Cell. 1990;2:1027–38.
- Bolouri Moghaddam MR, Van den Ende W. Sugars and plant innate immunity. J Exp Bot 2012;63(11):3989–98.
- Rodríguez M, Taleisnik E, Lenardon S, Lascano R. Are Sunflower chlorotic mottle virus infection symptoms modulated by early increases in leaf sugar concentration? J Plant Physiol 2010;167:1137–44.
- Asada K. The water-water cycle in chloroplasts: scavenging of active oxygens and dissipation of excess photons. Annu Rev Plant Physiol Plant Mol Biol 1999;50:601–39.
- del Río L, Pastori G, Palma J, Sandalio L, Sevilla F, Corpas F, et al. The activated oxygen role of peroxisomes in senescence. Plant Physiol 1998;116:1195–200.
- Sagi M, Fluhr R. Superoxide production by plant homologues of the gp91phox NADPH oxidase. Modulation of activity by calcium and by Tobacco Mosaic Virus infection. Plant Physiol 2001;126:1281–90.
- Arias MC, Luna C, Rodriguez M, Lenardon S, Taleisnik E. Sunflower chlorotic mottle virus in compatible interactions with sunflower: ROS generation and antioxidant response. Eur J Plant Pathol. 2005;113:223–32.
- Couée I, Sulmon C, Gouesbet G, El Amrani A. An involvement of soluble sugars in reactive oxygen species balance and responses to oxidative stress in plants. J Exp Bot. 2006;57:449–59.
- Ramel F, Sulmon C, Bogard M, Couée I, Gouesbet G. Differential patterns of reactive oxygen species and antioxidative mechanisms during atrazine injury and sucrose-induced tolerance in Arabidopsis thaliana plantlets. BMC Plant Biol. 2009;9:28.
- Van den Ende W, Valluru R. Sucrose, sucrosyl oligosaccharides, and oxidative stress: scavenging and salvaging? J Exp Bot. 2009;60:9–18.
- Bolouri-Moghaddam MR, Le Roy K, Xiang L, Rolland F, Van den Ende W. Sugar signaling and antioxidant network connections in plant cells. FEBS Journal 2010;277:2022–37.
- Foyer CH, Noctor G. Oxidant and antioxidant signaling in plants: a re-evaluation of the concept of oxidative stress in a physiological context. Plant Cell Environ 2005;28:1056–71.
- Foyer CH, Noctor G. Redox homeostasis and antioxidant signaling: a metabolic interface between stress perception and physiological responses. Plant Cell. 2005;17:1866–75.
- Foyer CH, Noctor G. Redox sensing and signaling associated with reactive oxygen in chloroplasts, peroxisomes and mitochondria. Physiol Plant 2003;119:355–64.
- Queval G, Noctor G. A plate-reader method for the measurement of NAD, NADP, glutathione and ascorbate in tissue extracts. Application to redox profiling during Arabidopsis rosette development. Anal Biochem 2007;363:58–69.
- Schneiter A, Miller J. Description of sunflower growth stages. Crop Sci 1981;21:901–3.
- Guan HP, Janes HW. Light regulation of sink metabolism in tomato fruit. II. Carbohydrate metabolizing enzymes. Plant Physiol 1991;96:922–7.
- Fales FW. The assimilation and degradation of carbohydrates by yeast cells. J Biol Chem 1951;193:113–24.
- Sumner JB, Somers GF. The water soluble polysaccharides of sweet corn. Arch Biochem 1944;4:4–7.
- Guilbault G, Brignac P, Juneau M. New substrates for the fluorometric determination of oxidative enzymes. Anal Chem 1968;40:1256–63.
- Anderson J, Chevone B, Hess J. Seasonal variation in the antioxidant system of eastern white pine needles: evidence for thermal dependence. Plant Physiol 1992;98:501–8.
- Gillespie K, Ainsworth E. Measurement of reduced, oxidized and total ascorbate content in plants. Nat Protoc 2007;2:871–4.
- Rodriguez M, Muñoz N, Lenardon S, Lascano R. The chlorotic symptom induced by Sunflower chlorotic mottle virus is associated with changes in redox-related gene expression and metabolites. Plant Sci 2012;196:107–16.
- Bradford M. A rapid and sensitive method for the quantitation of microgram quantities of proteins utilizing the principle of protein-dye binding. Anal Biochem 1976;72:248–54.
- Livak K, Schmittgen T. Analysis of relative gene expression data using real- time quantitative PCR and the 2−ΔΔct method. Methods 2001;25:402–8.
- Lunn JE, Feil R, Hendriks JHM, Gibon Y, Morcuende R, Osuna D, et al. Sugarinduced increases in trehalose 6-phosphate are correlated with redox activation of ADP-glucose pyrophosphorylase and higher rates of starch synthesis in Arabidopsis thaliana. Biochem J. 2006;397:139–48.
- Schluepmann H, van Dijken A, Aghdasi M, Wobbes B, Paul M, Smeekens S. Trehalose mediated growth inhibition of Arabidopsis seedlings is due to trehalose-6-phosphate accumulation. Plant Physiol 2004;135:879–90.
- Baena-González E, Rolland F, Thevelein JM, Sheen J. A central integrator of transcription networks in plant stress and energy signaling. Nature 2007;448:938–42.
- Valluru R, Van den Ende W. Myo-inositol and beyond – emerging networks under stress. Plant Sci 2011;181:387–400.
- Zhang Y, Primavesi LF, Jhurreea D, Andralojc PJ, Mitchell RAC, Powers SJ, et al. Inhibition of SNF1-related protein kinase1 activity and regulation of metabolic pathways by trehalose-6-phosphate. Plant Physiol 2009;149:1860–71.
- Wingler A, Delatte TL, O'Hara LE, Primavesi LF, Jhurreea D, Paul MJ, et al. Trehalose 6-phosphate is required for the onset of leaf senescence associated with high carbon availability. Plant Physiol. 2012;158:1241–1251.
- Stoyanova S, Geuns J, Hideg E, Van Den Ende W. The food additives inulin and stevioside counteract oxidative stress. Int J Food Sci Nutr 2011;62:207–14.
- Noctor G, Queval G, Gakiere B. NAD(P) synthesis and pyridine nucleotide cycling in plants and their potential importance in stress conditions. J Exp Bot 2006;57:1603–20.
- Müller-Moulé P, Golan T, Niyogi KK. Ascorbate-Deficient mutants of Arabidopsis grow in high light despite chronic photooxidative stress. Plant Physiol 2004;134:1163–72.
- Pastori GM, Kiddle G, Antoniw J, Bernard S, Veljvic-Jovanovic S, Verrier PJ, et al. Leaf vitamin C contents modulate plant defense transcripts and regulate genes that control development through hormone signaling. Plant Cell 2003;15:939–51.
- Potters G, Horemans N, Jansen M. The cellular redox state in plant stress biology – a charging concept. Plant Physiol Bioch 2010;48:292–300.
- Noctor G, Queval G, Mhamdi A, Chaouch S, Foyer CH. Glutathione. The Arabidopsis Book. 2011;9:0142.
- Karpinska B, Wingsle G, Karpinski S. Antagonistic effects of hydrogen peroxide and glutathione on acclimation to excess excitation energy in Arabidopsis. IUBMB Life 2000;50:21–6.
- Dutilleul C, Lelarge C, Prioul J, De Paepe R, Foyer C, Noctor G. Mitochondria-driven changes in leaf NAD status exert a crucial influence on the control of nitrate assimilation and the integration of carbon and nitrogen metabolism. Plant Physiol 2005;139:64–78.
- Herbette S, Lennea C, Tourvieille de Labrouhe D, Drevetc J, Roeckel-Drevet P. Transcripts of sunflower antioxidant scavengers of the SOD and GPX families accumulate differentially in response to downy mildew infection, phytohormones, reactive oxygen species, nitric oxide, protein kinase and phosphatase inhibitors. Physiol Plant 2003;119:418–28.
- Mittler R, Vanderauwerab S, Gollerya M, Van Breusegem F. Reactive oxygen gene network of plants. Trends Plant Sci 2004;9:490–8.
- Karpinski S, Escobar C, Karpinska B, Creissen G, Mullineaux P. Photosynthetic electron transport regulates the expression of cytosolic ascorbate peroxidase genes in Arabidopsis during excess light stress. Plant Cell 1997;9:627–40.
- Karpinski S, Reynolds H, Karpinska B, Wingsle G, Creissen G, Mullineaux P. Systemic signalling and acclimation in response to excess excitation energy in Arabidopsis. Science 1999;284:654–7.