Abstract
Objective
This study investigates the effects of troxerutin on nickel (Ni)-induced oxidative stress in rats.
Methods
Nickel as nickel sulfate (20 mg/kg body weight (b.w.)) was administered intraperitoneally for 20 days to induce toxicity in the subject rats. The levels of stress markers AST, ALT, ALP, LDH, and GGT in the hepatic tissue were significantly increased while a decrease in the levels of enzymic and non-enzymic antioxidants was observed in Ni intoxicated rats.
Results
Oral administration of troxerutin along with Ni for 20 days in a dose-dependent manner significantly reverted the stress markers in the liver tissue to near normal level. Troxerutin exhibited significant protection at 100 mg/kg b.w. Histopathological studies also supported the above findings.
Conclusions
Thus, we conclude that troxerutin preserved the histo-architecture and ameliorated stress markers in the liver tissue of Ni-intoxicated rats.
Introduction
Nickel (Ni) is a significant inorganic environmental pollutant and human exposure has generally risen with its increasing industrial usage in mining, refining, alloy production, welding, and electroplating. Epidemiological studies have noted an increased risk of respiratory tract and nasal cancers in miners and workers in Ni refineries.Citation1 Exposure to Ni can result in damage to various organs including the liver, kidney, brain, lungs, and testis.Citation2 The liver, the primary site for xenobiotic metabolism, detoxifies Ni by producing metallothione. Experimental exposure to Ni was found to generate reactive oxygen species (ROS) leading to an increase of lipid peroxidation, which causes the loss of membrane integrity by altering the cellular antioxidant system.Citation3 Ni can also generate free radicals directly from molecular oxygen in a two-step process producing superoxide anions, which can then combine with protons in the dismutation reaction generating hydrogen peroxide.Citation4
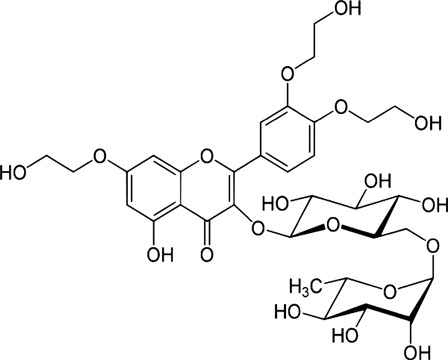
Troxerutin is a trihydroxyl ethylated derivative of the natural bioflavonoid rutin (). It is present in tea, coffee, cereal grains, and a variety of fruits and vegetables. Many reports have demonstrated that troxerutin exerts anti-oxidative, anti-inflammatory, anti-neoplastic, anti-erythrocytic, anti-thrombotic, and anti-fibrinolytic activity.Citation5 There are no reports available on the effects of troxerutin on Ni-induced toxicity. Hence, this study was carried out to investigate the ameliorating effects of troxerutin on Ni-induced hepatotoxicity in rats by studying stress markers and histological alterations in liver tissue.
Figure 1. Structure of troxerutin.
Materials and methods
Drug and chemicals
Troxerutin, nickel sulfate, 2-thiobarbituric acid, butylated hydroxytoluene, reduced glutathione, 2,2′-dipyridyl, xylenol orange, 2,2′-dinitro phenyl hydrazine, γ-glutamyl-p-nitroanilide, 5,5′-dithiobis-2-nitrobenzoic acid, trichloroacetic acid, phenazine methosulphate, nitroblue tetrazolium, reduced nicotinamide adenine dinucleotide and 1-chloro 2,4-dintrobenzene were obtained from Sigma Chemical Co. (St Louis, MO, USA). The rest of the chemicals utilized were obtained from a local firm (Himedia Laboratories Ltd, Mumbai, India) and were of analytical grade.
Animals
Adult male albino Wistar rats weighing 180–200 g bred in the Central Animal House, Rajah Muthiah Medical College, Annamalai University, India, were used in this study. The rats had free access to water and a commercial standard pelleted diet (Lipton India Ltd, Mumbai, India). The rats were housed in standard polypropylene cages and maintained under controlled room temperature (22 ± 2°C) and humidity (55 ± 5%) with a 12:12 hours light and dark cycle. The rats used in this study were maintained in accordance with the guidelines of the National Institute of Nutrition, Indian Council of Medical Research, and Hyderabad, India. The study protocol was approved (Vide No. 902, 2012) by the Committee for the Purpose of Control and Supervision on Experimental Animals at Annamalai University, Annamalainagar, India.
Experimental design
The rats were randomly divided into six groups of six rats. To the overnight fasting groups, nickel sulfate (20 mg/kg body weight, b.w.) dissolved in isotonic saline was administered intraperitoneally. The treatment groups were co-administered (orally) with troxerutin dissolved in water at three different doses viz., 25, 50, 100 mg/kg b.w. for 20 days.
Group I: Control (isotonic saline 2 ml/kg b.w.)
Group II: Normal + troxerutin (100 mg/kg b.w.)
Group III: Nickel sulfate (20 mg/kg b.w.)
Group IV: Nickel sulfate + troxerutin (25 mg/kg b.w.)
Group V: Nickel sulfate + troxerutin (50 mg/kg b.w.)
Group VI: Nickel sulfate + troxerutin (100 mg/kg b.w.)
During the experimental period, changes in food and water intake were measured on a daily basis. At the end of the experimental period, rats were anesthetized by ketamine (30 mg/kg b.w. intra muscularly) and were sacrificed by decapitation. Blood samples were collected and processed for various biochemical estimations. The liver was quickly excised, rinsed with saline, blotted dry on filter paper, weighed and then 10% (w/v) homogenates were prepared in buffer (0.025 M Tris–HCl buffer (pH 7.4) using a tissue homogenizer.
Activities of hepatic marker
The activities of serum aspartate amino transferase (E.C.2.6.1.1), alanine amino transferase (E.C.2.6.1.2), alkaline phosphatase (E.C.3.1.3.1), and lactate dehydrogenase (E.C.3.1.3.1) were assayed using commercially available diagnostic kits (Sigma diagnostics Pvt Ltd, Baroda, India). Gamma glutamyl transferase (E.C.2.3.2.2) activity was determined by the method of Rosalki et al.Citation6 using γ-glutamyl-p-nitro anilide as substrate. The serum bilirubin level was estimated using the method of Malloy and Evelyn,Citation7 which follows the principle of the Van den Berg reaction.
Estimation of lipid peroxidation end products
Thiobarbituric acid reactive substances (TBARS) were estimated using the method of Niehius and Samuelson.Citation8 Liver homogenate (0.5 ml) was treated with 2 ml of TBA-TCA-HCl reagent (0.37 (w/v) thiobarbituric acid, 15 (w/v) trichloroacetic acid, and 0.25 N hydrochloric acid in a 1:1:1 ratio) and placed for 15 minutes in a boiling water bath, cooled and the color developed in the supernatant was measured at 535 nm against a reference blank.
Lipid hydroperoxides (LOOH) were estimated by the method of Jiang et al.Citation9 The liver homogenates (0.5 ml) were treated with 0.9 ml of Fox reagent (88 mg of BHT, 7.6 mg of xylenol orange and 0.8 mg of ammonium ion sulphate were added to 90 ml of methanol and 10 ml of 250 mM H2SO4) and incubated at 37°C for 30 minutes and the color development was monitored at 560 nm and the amount of LOOH was expressed as nmol/g tissue.
The protein carbonyl content (PCC) was measured by the method of Levin et al.Citation10 Tissue homogenates were centrifuged at 10 000 × g for 20 minutes to separate cytosol and then 0.5 ml of cytosolic fraction and 0.5 ml of TCA were added. Then 0.5 ml of DNPH was added and kept for 1 hour at room temperature. Pellet was washed thrice with 1 ml of ethanol–ethyl acetate mixture, and dissolved in 1 ml of guanidine hydrochloride and the color developed was read at 360 nm. PCC of the liver were expressed as nmol/mg protein.
Conjugated dienes (CD) were estimated following Rao and Recknagel.Citation11 To 1.0 ml of liver homogenate, 5.0 ml of chloroform–methanol reagent (2:1 v/v) was added, mixed thoroughly and centrifuged for 5 minutes. To this, 1.5 ml of cyclohexane was added and the absorbance was read at 233 nm against a cyclohexane blank. The amount of CD formed was calculated using a molar extinction coefficient of 2.52 × 104 cm−1. The concentration of CD was expressed as nmol/g tissue.
Determination of non-enzymic antioxidants
The vitamin C concentration was measured using the method of Omaye et al.Citation12 To 0.5 ml of homogenate, 1.5 ml of 6 %(w/v) TCA was added and centrifuged at 3500 × g for 20 minutes. To 0.5 ml of supernatant, 0.5 ml of DNPH reagent ((2%(w/v) and 4% (w/v) thiourea in 9 N H2SO4) was added and the mix incubated for 3 hours at room temperature. After incubation, 2.5 ml of 85%(v/v) H2SO4 was added, kept at room temperature for 30 minutes and the color developed was read at 530 nm.
Vitamin E was extracted from liver tissue by the method of Folch et al.Citation13 using chloroform–methanol mixture (CHCl3:CH3OH)(2:1 v/v) and estimated by the method of Desai.Citation14 First, 0.1 ml of extract was treated with 1.6 ml ethanol and 2.0 ml petroleum ether and then centrifuged. The supernatant was separated and evaporated to dryness. To the residue, 0.2 ml of 0.2% (w/v) 2, 2′-dipyridyl, 0.2 ml of 0.5% (w/v) ferric chloride were added and incubated in the dark for 5 minutes. The reaction mixture was stirred vigorously and shaken with 4 ml of n-butanol. The intensity of the chromogen in the butanol layer was measured at 520 nm against butanol blank. A system devoid of enzyme served as control.
Reduced glutathione (GSH) was determined by the method of Moron et al.Citation15 The basic principle involved in this method is the free GSH reacting with Ellman's reagent (19.8 mg dithionitrobis benzoic acid in 100 ml of 0.1%(w/v) sodium citrate) to give the colored complex, which was measured at 412 nm in visible spectrum. The intensity of the color is proportional to the amount of GSH present in the sample. Total sulphydryl groups (TSH) in the liver homogenates were measured after the reaction with dithionitrobis benzoic acid using the method of Ellman.Citation16
Assay of enzymic antioxidants
Superoxide dismutase (SOD) activity was determined by the method of Kakkar et al.Citation17 First, 0.5 ml of tissue homogenate was diluted to 1 ml with water. Then 2.5 ml of ethanol and 1.5 ml of chloroform were added (all the reagents were chilled). This mixture was shaken for 1 minute at 4 °C and then centrifuged. The enzyme activity in the supernatant was determined. The assay mixture contained 1.2 ml of sodium pyrophosphate buffer (0.025 M, pH 8.3), 0.1 ml of 186 µM PMS, 0.3 ml of 30 µM NBT, 0.2 ml of 780 µM NADH, appropriately diluted enzyme preparation and water in a total volume of 3 ml. The reaction was started by the addition of NADH. After incubation at 30°C for 90 seconds, the reaction was halted by the addition of 1 ml glacial acetic acid. The reaction mixture was stirred vigorously and shaken with 4 ml of n-butanol. The intensity of the chromogen in the butanol layer was measured at 560 nm against the butanol blank, and the enzyme free control. The value is expressed as units/mg protein.
The activity of catalase was determined by the method of Sinha.Citation18
Assay medium pH 7.0 was maintained using 0.01 M phosphate buffer. To 0.1 ml of liver homogenate, 0.9 ml of phosphate buffer and 0.4 ml of H2O2 were added and the mixture incubated at 37°C for 1 minute. After the incubation, 2 ml of dichromate acetic acid reagent was added. The tubes were kept in a boiling water bath for 10 minutes and the color developed was read at 620 nm. The activities were expressed as micromoles of H2O2 consumed/min/mg protein. Glutathione peroxidase (GPx) was estimated by the method of Rotruck et al.Citation19
To 0.2 ml of Tris buffer, 0.2 ml of EDTA, 0.1 ml of sodium azide and 0.5 ml of tissue homogenate were added. To this mixture, 0.2 ml of glutathione followed by 0.1 ml of H2O2 was added. The contents were mixed well and incubated at 37°C for 10 minutes along with a tube containing all the reagents except the sample. After 10 minutes the reaction was arrested by the addition of 0.5 ml of 10% (w/v) TCA, centrifuged, and the supernatant was assayed for glutathione by the method of Ellman.Citation15 The activities were expressed as μg of GSH consumed/min/mg protein.
The glutathione S-transferase (GST) activity was determined by the method of Habig et al.Citation20 The reaction mixture contained 1 ml of phosphate buffer, 0.1 ml of CDNB, 0.1 ml of tissue homogenate and 0.7 ml of distilled water. The reaction mixture was incubated at 37°C for 5 minutes and then the reaction was started by the addition of 0.1 ml of 30 mM glutathione. The change in absorbance was read at 340 nm for 5 minutes. A reaction mixture without the enzyme was used as the blank.
The presence of glutathione reductase (GR), which utilizes NADPH to convert oxidized glutathione (GSSG) to the reduced form (GSH), was assayed by the method of Horn and Burns.Citation21 To 0.2 ml of Tris buffer, 0.2 ml of EDTA, 0.1 ml of sodium azide, and 0.5 ml of tissue homogenate were added. To this mixture, 0.2 ml of glutathione followed by 0.1 ml of H2O2 was added. The contents were mixed well and incubated at 37°C for 10 minutes along with a tube containing all the reagents except sample as control. After 10 minutes the reaction was arrested by the addition of 0.5 ml of 10% (w/v) TCA, centrifuged and the supernatant was assayed for glutathione by the method of Ellman.Citation15 The activity of GST was expressed as micromoles of CDNB-GSH conjugate formed/min/mg protein.
Glucose-6-phosphate dehydrogenase (G6PD) was assayed by the method of Beutler.Citation22 The incubation mixture contained 1 ml of buffer, 0.1 ml of MgCl2, 0.1 ml of NADP+, 0.5 ml of PMS, 0.4 ml of 2, 6-dichlorophenol indophenol dye solution and the required amount of the enzyme extract. The mixture was allowed to stand at room temperature for 10 minutes to permit the oxidation of endogenous materials. The reaction was initiated by the addition of 0.5 ml of glucose-6-phosphate. The absorbance was read at 640 nm against water blank with the time duration of 1-minute intervals for 3–5 minutes using a spectrophotometer. The activity of G6PD was expressed as nmol of NADPH formed/minute/mg protein in tissues.
Total protein content in test samples was estimated by the method of Lowry et al.Citation23 using bovine serum albuminas the standard.
Determination of nickel concentration
For the determination of nickel in the liver, a 1-g liver sample was digested with nitric acid in microwave oven. After digestion, nickel was continuously pre-concentrated and determined by flame atomic absorption spectrometer (Perkin-Elmer 5000 atomic absorption spectrometer furnished with a nickel hollow-cathode lamp (lamp current 4 mA)). The instrument was set at 232.0 nm with a slit width of 0.5 nm. The acetylene flow rate was 2.0 l/minute and an airflow rate of 17.0 l/minute was employed to ensure an oxidizing flame.
Histopathological studies
For qualitative analysis of liver histology, the tissue samples were fixed for 48 hour in 10% (v/v) formalin-saline and dehydrated by passing successfully in different mixtures of ethyl alcohol and water, then cleaned in xylene and embedded in paraffin. Sections of the tissues were prepared by using a rotary microtome and stained with haematoxylin and eosin dye, for microscopical observations.
Statistical analysis
Data were presented as mean ± SD and subjected to statistical significance by one way analysis of variance using SPSS version 15.0 (SPSS, Cary, NC, USA) and the individual comparisons were obtained by Duncan's multiple range test (DMRT). Values were considered statistically significant when P < 0.0524
Results
shows the effect of Ni and troxerutin on food, water intake, changes in body weight and organ–body weight ratio (%) in control and experimental rats. In Ni-treated rats a significant decrease in body weight (1.06) with an increase in organ body weight (1.65) was observed when compared to control rats. No significant changes were noted between control and troxerutin treated rats. The above changes observed in Ni-treated rats were significantly (P < 0.05) improved on oral administration of troxerutin in a dose-dependent manner.
Table 1. Effect of troxerutin and nickel on food intake, water intake, body weight gain, and organ–body weight ratio in control and experimental rats
shows the levels of hepatic marker enzymes and bilirubin in control and experimental rats. In Ni-treated rats, the activities of aspartate aminotransferase (1.72), alanine aminotransferase (1.89), alkaline phosphatase (1.5), lactate dehydrogenase (1.4), gamma glutamyl transferase (1.45), and the level of bilirubin (1.65) were significantly (P < 0.05) increased as compared to control rats. Administration of troxerutin (100 mg/kg b.w.) with Ni, significantly (P < 0.05) decreased the activities of hepatic markers and bilirubin in serum when compared to other doses (25 and 50 mg/kg b.w.). Based on these findings, 100 mg/kg b.w. of troxerutin was used for further biochemical studies. Oral administration of troxerutin (100 mg/kg body weight) to normal rats did not show any significant effect (P < 0.05) on serum hepatic markers.
Table 2. Effect of troxerutin and nickel on serum hepatic markers in control and experimental rats
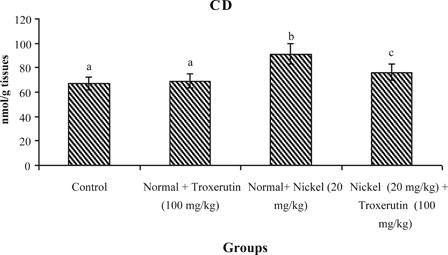
The levels of lipid peroxidative markers, PCC and CD in the liver of control and experimental rats are shown in –. The levels of TBARS s (2.04), lipid hydroperoxides (1.59), PCC, and CD (2.24) were significantly increased (P < 0.05) in Ni-intoxicated rats as compared to control rats. Oral administration of troxerutin (100 mg/kg b.w.) to Ni-intoxicated rats significantly lowered the above parameters to near normal levels.
Figure 2. Changes in the activities of thiobarbituric reactive acid substance in control and experimental rats. Values are given as mean ± S.D. for six rats in each group. Values not sharing a common superscript letter differ significantly at P < 0.05 (DMRT).
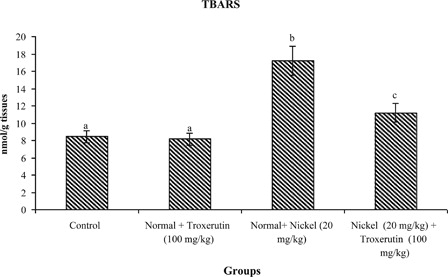
Figure 3. Changes in the activities of lipid hydroperoxides (LOOH) in control and experimental rats. Values are given as mean ± SD for six rats in each group. Values not sharing a common superscript letter differ significantly at P < 0.05 (DMRT).
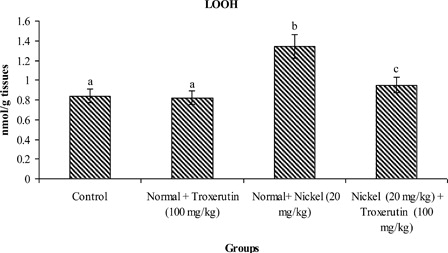
Figure 4. Changes in the activities of PCC in control and experimental rats. Values are given as mean ± SD for six rats in each group. Values not sharing a common superscript letter differ significantly at P < 0.05 (DMRT).
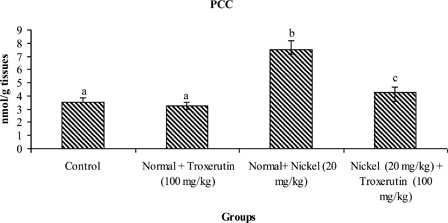
Figure 5. Changes in the activities of CD in control and experimental rats. Values are given as mean ± SD for six rats in each group. Values not sharing a common superscript letter differ significantly at P < 0.05 (DMRT).
depicts the changes in the levels of vitamin C, vitamin E, GSH, and TSH in the liver of control and experimental rats. A significant (P < 0.05) decrease in the levels of vitamin C, vitamin E, GSH, and TSH was noticed in Ni-treated rats when compared to control rats. Treatment with troxerutin significantly (P < 0.05) increased the levels of non-enzymatic antioxidants (vitamin C, vitamin E, GSH, TSH) to near normal in the liver of Ni-intoxicated rats.
Table 3. Changes in the levels of non-enzymic antioxidants in liver of control and experimental rats
illustrates the activities of enzymatic antioxidants in the liver of control and experimental rats. The activities of enzymatic antioxidants namely SOD (1.42), CAT (1.7), GPx (2), GST (1.43), GR (1.64), and G6PD (1.40) were significantly (P < 0.05) decreased in Ni-treated rats when compared with control rats. Administration of troxerutin to Ni-intoxicated rats significantly (P < 0.05) increased the activities of these antioxidant enzymes (SOD (1.2), CAT (1.58), GPx (1.79), GST (1.22), GR (1.38), and G6PD (1.21)) as compared to solely Ni-treated rats.
Table 4. Changes in the activities of antioxidant enzymes in the liver of control and experimental rats
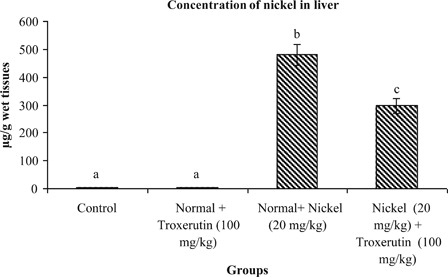
The concentrations of Ni in the livers of control and experimental rats are shown in . Administration of Ni in normal rats results in a significant (P < 0.05) increase of Ni concentration in the liver (282). On treatment with troxerutin the level of Ni in the liver was significantly reduced (1.61) when compared to solely Ni treated rats.
Figure 6. Concentration of nickel in liver of control and experimental rats. Values are given as mean ± S.D. for six rats in each group. Values not sharing a common superscript letter differ significantly at P < 0.05 (DMRT).
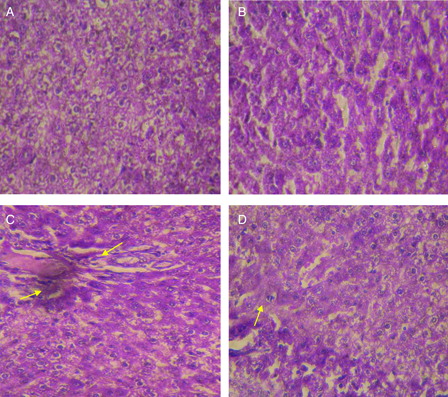
illustrates histological pattern of control and troxerutin-treated rats, which show a normal appearance of 2 hepatocytes and hepatic sinusoids (A and B). In Ni-treated rats, marked alterations in liver histoarchitecture was evidenced by necrotic and degenerative changes with severe inflammatory cell infiltration when compared with the control rats (C). The above histopathological abnormalities were effectively attenuated in the liver of rats treated with troxerutin (D).
Figure 7. Hematoxylin and eosin-stained sections of rat liver (40×): (A) Control rat liver: Normal architecture of liver. (B) Troxerutin (100 mg/kg) treated rat liver: normal appearance of liver cells. (C) Nickel sulfate (20 mg/kg) treated rat liver: Necrotic and degenerative changes with severe inflammatory cell infiltration were observed. (D) Nickel sulfate + troxerutin (100 mg/kg) treated rat liver: Dramatic decreases in necrotic and degenerative changes and inflammatory cell infiltration was seen Scale bar: 5 µm.
Discussion
Ni-induced hepatotoxicity is a well-documented event that induces biochemical dysfunctions representing serious health hazards.Citation4 The symptoms of Ni toxicity in rats include retardation in body weight development and decreased water and food intake. The alterations of organ–body weight ratio in nickel-intoxicated rats might be caused by the overall increased degradation of lipids and proteins.Citation25
Liver injury followed by Ni exposure increases the level of hepatic marker enzymes, such as AST, ALT, ALP, and LDH, indicating cellular leakage and the loss of membrane functional integrity.Citation26 It was found that hepato-cellular damage exhibited good correlation with the elevation of intracellular enzymes in blood. GGT is another important liver function marker and has been used as an index of liver dysfunction. The products of the GGT reaction may themselves lead to increased free radical production, particularly in the presence of iron. Previous studies showed that an increase in plasma total bilirubin concentration was associated with free radical production in Ni-treated rats.Citation27 In this study, changes in body weight with aberrations in food and water intake were observed. The levels of hepatic markers are also elevated in nickel-intoxicated rats. Administration of troxerutin at a dose of 100 mg/kg b.w. remarkably improved the alterations in hepatic function caused by nickel toxicity when compared to two other doses (25 and 50 mg/kg b.w.).
Nickel-induced free radical generation initiates lipid peroxidation in the cellular membrane and alters its integrity. Lipid peroxidation end products can interact with proteins and nucleic acids present in the cell thereby impeding normal cellular functions.Citation28 The elevated levels of TBARS, LOOH, PCC, and CD observed in the livers of Ni-treated rats clearly indicates metal mediated free radical generation and lipid peroxidation.Citation29 In this study, troxerutin markedly decreased the levels of hepatic TBARS, LOOH, PCC, and CD levels in nickel-treated rats. This may be due to the antioxidant property and free radical scavenging activities of troxerutin. These results corroborate previous reports showing that bioflavonoids can prevent free radical-induced lipid peroxidation.Citation30
Vitamin C is a water soluble antioxidant and acts as a free radical scavenger. α- Tocopherol (vitamin E) is a potent fat soluble chain breaking antioxidant that prevents lipid peroxidation reactions.Citation31 Previous studies revealed that α-tocopherol exhibits excellent antioxidant properties in Ni-intoxicated rats. GSH, the free sulfhydryl group containing multifunctional, non-enzymatic antioxidant scavenges free radicals directly and acts as a coenzyme in enzyme mediated detoxification processes (GPx and GST). In our study, notable decreases in non-enzymatic antioxidants, such as vitamin C, vitamin E, and GSH, were observed in Ni-treated rats. Our results correlate well with previous findings.Citation32 Administration of troxerutin significantly reversed these changes to near normal.
Enzymic antioxidants such as SOD, catalase (CAT), glutathione peroxidase (GPx), glutathione-S-transferase (GST), GR, and G6PD (G6PD) mutually constitute a supportive defense against ROS. Assessment of these antioxidant enzymes is appropriate to assess the pro oxidant–antioxidant status in nickel-induced toxicity. Among them SOD and CAT mutually function as important enzymes in the elimination of ROS. SOD is a metallo protein that catalyses the dismutation of super oxide radicals to hydrogen peroxide.Citation33 Catalase is a heme protein that catalyses the reduction of H2O2 to water and oxygen and thus protects the cells from oxidative damage.Citation34 GPx is a seleno enzyme that catalyses the oxidation of GSH to GSSG and thereby scavenges and controls the H2O2-mediated toxicity.Citation35 GR is responsible for the reduction of GSSG to GSH, which was generated by GPx in the presence of NADPH.
G6PD, a rate limiting enzyme of pentose phosphate pathway, catalyses the synthesis of ribose for nucleic acid and is the principle intracellular source of NADPH. GST is a group of multifunctional isoenzymes, which play an important role in the detoxification of toxic electrophiles by catalyzing their conjugation with glutathione. In the present investigation the activities of SOD, CAT, GPx, GST, GR, and G6PD were significantly decreased in the livers of nickel-treated rats. Troxerutin administration markedly improved the impairment of enzyme mediated antioxidant defense system in the liver of nickel-treated rats by its antioxidant and metal chelating properties.
Necrotic and degenerative changes were observed with inflammatory cell infiltration in Ni-treated rats.Citation36 Administration of troxerutin reduced the histological alterations caused by Ni. Chelation of Ni by troxerutin significantly reduced the oxidative threat that leads to reduction in pathological changes and restoration of physiological functions.
To summarize, our results demonstrated that the administration of troxerutin protects the liver from Ni-induced oxidative dysfunction by decreasing the liver marker enzymes, oxidative stress markers and by increasing the levels of non-enzymic and enzymic antioxidants. Ni-induced pathological changes in liver tissues were also effectively ameliorated by troxerutin. These protective effects of troxerutin might be due to its antioxidant and antiperoxidative potentials. Thus, troxerutin ameliorated Ni-induced oxidative stress in experimental rats.
References
- Easton DF, Peto J, Morgan LG, Metcalfe LP, Usher V, Doll R. Respiratory cancer in Welsh nickel refiners: which nickel compounds are responsible? In: , Nieboer E, Nriagu JO (eds.) Nickel and human health: current perspectives. New York: Wiley; 1992. pp. 603–19.
- Sunderman FWB, Zaharia OJ, Marzouk A, Reid MC. Increased lipid per oxidation in liver, kidney and lung of NiCl2-treated rats. In: , Brown SS, Sunderman FW (eds.) Progress in Nickel toxicology. Oxford: Blackwell; 1985. pp. 93–6.
- Das KK, Das SN, Disrupt S. The influence of ascorbic acid on nickel induced hepatic lipid peroxidation in rats. J Basic Clin Physiol Pharmacol 2001;12:187–95.
- Das KK, Das SN, Dhundasi SA. Nickel its adverse health effects & oxidative stress. Indian J Med Res 2008;128:412–25.
- Blasig I, Lowe H, Ebert B. Radical trapping and lipid peroxidation during myocardial reperfusion injury-Radical scavenging by troxerutin in comparison to mannitol. Biomed Biochim Acta 1987;46:S539–44.
- Rosalki SB, Rav D, Lehman D, Prentice M. Determination of serum gamma glutamyl transpeptidase activity and its clinical applications. Ann Clin Biochem 1970;7:143–7.
- Malloy E, Evelyn K. The determination of bilirubin with the photoelectric colorimeter. J Biol Chem 1937;119:48–487.
- Niehius WG, Samuelson B. Formation of malondialdehyde from phospholipid arachidonate during microsomal lipid peroxidation. Eur J Biochem 1968;6:126–30.
- Jiang ZY, Hunt JV, Wolff SD. Ferrous ion oxidation in the presence of xylenol orange for detection of lipid hydroperoxide in low-density lipoprotein. Anal Biochem 1992;202:384–9.
- Levine RL, Garland D, Oliver CN, Amic A, Climent I, Lenz AG, et al. Determination of carbonyl content in oxidatively modified Proteins. Methods Enzymol 1999;186:464–78.
- Rao KS, Recknagel RO. Early onset of lipid peroxidation in rat liver after carbon tetrachloride administration. Exp Mol Pathol 1968;9:271–8.
- Omaye ST, Turnbull ST, Sauberlich HE. Selected methods for the determination of ascorbic acid in animal cells, tissues and fluids. Methods Enzymol 1979;62:1–11.
- Folch J, Lees M, Solane SGH. A simple method for isolation and purification of total lipids from animal tissues. J Biol Chem 1957;226:497–509.
- Desai ID. Vitamin E analysis method for animal tissues. Methods Enzymol 1984;105:138–43.
- Moron MS, Despierre JW, Minnervik B. Levels of glutathione, glutathione reductase and glutathione-S-transferase activities in rat lung and liver. Biochim Biophys Acta 1979;582:67–78.
- Ellman GL. Tissue sulfhydryl groups. Arch Biochem Biophys 1959;82:70–7.
- Kakkar P, Das B, Viswanathan PN. A modified spectroscopic assay of superoxide dismutase. Indian J Biochem Biophys 1984;21:130–2.
- Sinha AK. Colorimetric assay of catalase. Anal Biochem 1972;47:389–94.
- Rotruck JT, Pope AL, Ganther HE. Selenium: biochemical role as a component of glutathione peroxidase purification assay. Science 1973;179:588–90.
- Habig WH, Pabst MJ, Jakoby WB. Glutathione transferase, a first enzymatic step in mercapturic acid formation. J Biol Chem 1974;249:7130–9.
- Horn HD, Burns FH. Assay of glutathione reductase activity. In: , Bergemeyer HV (ed.) Methods of enzymatic analysis. New York: Academic Press; 1978. pp. 142–6.
- Beutler E. Active transport of glutathione disulfide from erythrocytes, In: , Larson A, Arrhenius S, Holmgren A, Mannerwik B (eds.) Functions of glutathione, biochemical. Physiological toxicological and clinical aspects. New York: Raven Press; 1983. p. 65.
- Lowry OH, Rosebrough NJ, Farr AL, Randall J. Protein measurement with the Folin–phenol reagent. J Biol Chem 1951;193:265–75.
- Duncan BD. Multiple range tests for correlated and heteroscedastic means. Biometrics 1957;13:359–64.
- Cempel M, Janicka K. Distribution of nickel, zinc and copper in rat organs after oral administration of nickel(II) chloride. Biol Trace Elem Res 2002;90:215–26.
- Williamson EM, Okpako DT, Evans FJ. Selection, preparation and pharmacological evaluation of plant material. England: Wiley; 1996. p. 1.
- Pari L, Prasath A. Efficacy of caffeic acid in preventing nickel induced oxidative damage in liver of rats. Chem Biol Interact 2008;173:77–83.
- Haberland M, Fong D, Cheng L. Malondialdehyde-altered protein occurs in atheroma of Watanabe heritable hyperlipidemic rabbits. Science 1988;241:215–8.
- Mishra M, Rodriguez RE, Kasprazak KS. Nickel induced lipid peroxidation in the rat: correlation with nickel effect on antioxidant defense system. Toxicology 1990;64:1–17.
- Iwahashi H, Ishii T, Suguta R, Kido R. The effects of caffeic acid and its related catechols on hydroxyradical formation by 3-hydroxyanthranilic acid, ferric chloride and hydrogen peroxide. Arch Biochem Biophys 1990;276:242–7.
- Young IS, Woodside IS. Antioxidants in health and disease. J Clin Pathol 2001;54:176–86.
- Pari L, Amudha K. Antioxidant effect of naringin on nickel-induced toxicity in rats. An in vivo and in vitro study. IJPSR 2011;2(1):137–44.
- McCord JM, Keele BB, Fridovich I. An enzyme based theory of obligate anaerobiosis. The physiological functions of superoxide dismutase.Proc Natl Acad Sci USA 1976;68:1024–7.
- Chance B, Greenstein DS, Roughton RJW. The mechanism of catalase action 1-state analysis. Arch Biochem Biophys 1952;37:301–39.
- Husain SR, Cillard J, Cillard P. Hydroxyl radical scavenging activity of flavonoids. Phytochemistry 1987;26:2489–91.
- Sidhu P, Garg ML, Dhawan DK. Protective role of zinc in nickel-induced hepatotoxicity in rats. Chem Biol Interact 2004;150:199–209.