Abstract
Objectives
Redox status influences replication of some viruses but its effect on porcine circovirus type 2 (PCV2), the primary causative agent of the emerging swine disease post-weaning multisystemic wasting syndrome is not known. The interaction of PCV2 replication with intracellular redox status in PK15 cells was examined in this study.
Methods
Intracellular glutathione (GSH) was measured spectrophotometrically by reaction with 5, 5′-dithiobis (2-nitrobenzoic acid). Total superoxide dismutase activity (SOD) was assayed by inhibition of oxyamine oxidation by the xanthine oxidase system. Malondialdehyde (MDA) was assayed spectrophotometrically using the thiobarbituric acid reaction. Both quantification of PCV2 DNA by real-time polymerase chain reaction and indirect immunofluorescence of PCV2-infected cells were used to evaluate the replication of PCV2.
Results
Both GSH and SOD decreased significantly at 48 hours after PCV2 infection, whereas MDA concentration increased significantly after 48 hour post-infection. Furthermore, PCV2 replication in PK15 cells was significantly impaired after the elevation of intracellular GSH through treatment with the antioxidant N-acetyl-l-cysteine (NAC), a precursor in GSH synthesis. In contrast, PCV2 replication in PK15 cells was enhanced after reduction of GSH levels through H2O2-mediated oxidation. In addition, NAC treatment blocked the increase of virus replication induced by H2O2.
Conclusions
This study suggests that PCV2 infection induces oxidative stress and that intracellular redox status influences PCV2 replication in PK15 cells.
Introduction
There is an evidence that both redox balance in host cells is disrupted during some viral infections and that host cell redox status can affect progression and replication of some viruses. For example, Dengue viral infections induce oxidative stress in mosquito cells and the infected cells survive by modulating their cellular antioxidant machinery.Citation1 Similarly, infections by hepatitis B and C virus cause extensive oxidative stress that plays a significant role in liver pathology.Citation2,Citation3 Earlier reports have demonstrated that in vitro induction of oxidative stress can promote the replication of HIV.Citation4,Citation5 In the case of lymphocytic choriomeningitis virus, reactive oxygen species (ROS) are required for its binding and growth;Citation6 but, in contrast, it has been reported that spontaneous ROS production inversely correlates with the proviral loads of bovine leukemia virus in vivo.Citation7
Since the 1990s, porcine circovirus type 2 (PCV2) has been considered the causative agent of post-weaning multisystemic wasting syndrome (PMWS), one of the major swine diseases worldwide.Citation8 Currently, PCV2 is also associated with other diseases, such as porcine dermatitis and nephropathy syndrome, porcine respiratory disease complex, enteritis, and reproductive failure, collectively referred to as porcine circovirus diseases (PCVD).Citation9 The control of PCVD is based on appropriate animal management, control of co-infections, and vaccination. It has been reported that the addition of antioxidant feed additives can ameliorate the clinical effects of PMWS and selenium, an antioxidant trace element, has also been shown to reduce PCV2 replication in PK15 cells in a concentration-dependent manner.Citation10,Citation11 However, the mechanisms by which these antioxidants influence PCV2 infection have not been elucidated. In addition, there is no information available concerning either the effects of PCV2 infection on intracellular redox status in host cells or whether intracellular redox status affects the replication of PCV2.
The objective of this study was to investigate whether PCV2 replication causes oxidative stress and whether modulation of intracellular redox status influences PCV2 replication in PK15 cells.
Materials and methods
Reagents and antibodies
H2O2 and fluorescein isothiocyanate (FITC)-linked secondary antibody (rabbit anti-pig immunoglobulin G) were purchased from Sigma (St Louis, MO, USA), N-acetyl-l-cysteine (NAC) from Beyotime Institute of Biotechnology, China, and porcine anti-PCV2 antibody from UnivBiotech Co., China.
Virus and cells
PK15 cells (porcine kidney) free of PCV type 1 were provided by China Institute of Veterinary Drug Control. PK15 cells were propagated at 37°C in an atmosphere of 5% CO2 in Dulbecco's modified Eagle's medium (Invitrogen, Carlsbad, CA, USA) supplemented with 5% fetal bovine serum, penicillin (20 mg/ml), and streptomycin (20 mg/ml), referred hereafter as the culture medium. The wild-type PCV2 (PCV2NJ2002) used in the experiments was isolated originally from a kidney tissue sample of a pig with naturally occurring PMWS. The determination of PCV type was performed by sequencing. PCV2 stocks were generated from PK15 cells infected with PCV2 as follows: cells were infected with PCV2 at a multiplicity of infection (MOI) of 1, when cells had reached approximately 40–50% confluence. After 1 hour absorption, the inoculums were removed, the cell monolayer was washed three times with phosphate-buffered saline (PBS), culture medium added, and incubation continued at 37°C for 72 hours. The infected cells were then sub-cultured and PCV2 was serially passaged in PK15 cells. The virus harvested at each passage was stored at −80°C. The cytotoxicity of H2O2 and NAC on PK15 cells was determined by trepans blue exclusion. Cell viability was not altered by any of the doses of either H2O2 or NAC used in the present study (data not shown).
Determination of glutathione, superoxide dismutase, and malondialdehyde in PK15 cells
Cell extracts were prepared by sonication in ice-cold PBS. After sonication, lysates were centrifuged at 10 000 × g for 20 minutes to remove debris. Reduced glutathione (GSH), superoxide dismutase activity (SOD), and malondialdehyde (MDA) were measured in the supernatants as described previously using commercially available kits (Jiancheng Co., Nanjing, China).Citation12–Citation14 GSH was measured spectrophotometrically (412 nm) by reaction with 5, 5′-dithiobis (2-nitrobenzoic acid) and concentrations expressed as micromoles of GSH per gram of protein. SOD activity was assayed by inhibition of oxyamine oxidation by the xanthine oxidase system. One unit of SOD activity was defined as the quantity that reduced the absorbance at 550 nm by 50%. Results were expressed as unit per milligram protein. MDA was assayed spectrophotometrically at 548 nm using the thiobarbituric acid reaction and were expressed as micromoles per gram of protein. Total protein concentration was determined using a Bradford Protein Assay Kit (Beyotime, Haimen, China). All samples were assayed in triplicate.
Quantification of PCV2 DNA by real-time polymerase chain reaction
Newly synthesized viral DNA in PK15 cells was assayed by real-time polymerase chain reaction (PCR) as described elsewhere using the TaKaRa SYBR Green quantitative PCR Kit (TaKaRa Co., Dalian, China).Citation11 Briefly, the PCV2-infected PK15 cells were harvested at 72 hours post-inoculation and DNA extraction was carried out using a TaKaRa DNA Mini kit (TaKaRa Co., China). The purified DNA was used as a template for real-time PCR amplification. A region of 117 bp was amplified from the PCV2 ORF2 gene with a pair of PCV2-specific primers (forward primer: 5′-TAGTATTCAAAGGGCACAG-3′, reverse primer: 5′-AAGGCTACCACAGTCAG-3′). Quantitative real-time PCR was carried out using ABI PRISM 7300 Detection System (Applied Biosystems, Foster City, CA, USA). A recombinant pMD19 plasmid vector (TaKaRa Co., China) containing a PCV2 genome inserts was used as standard.
Indirect immunofluorescence of PCV2-infected cells
Seventy-two hours post-inoculation PK15 cells were washed with PBS and fixed in methanol. Fixed cells were incubated at room temperature with PBS containing 2% bovine serum albumin (BSA) for 1 hour and then with porcine anti-PCV2 antibody (UnivBiotech, Shanghai, China), diluted 1:50 in PBS containing 1% BSA at 37°C for 1 hour. After washing with PBS containing 0.1% Tween-20, cells were then incubated with FITC-conjugated rabbit anti-pig antibody diluted 1:100 in PBS containing 1% BSA and incubated for 1 hour at 37°C. After thorough washing in PBS, the cells were examined under a fluorescence microscope. Cells showing fluorescent staining (judged to be positive for PCV2 viral antigen) were counted in six fields of view.
Statistical analysis
Statistical analysis was performed using SPSSV17.0 for windows. Data were analyzed using one-way analysis of variance (ANOVA) followed by least-significant difference test. Differences were regarded as significant at P < 0.05.
Results
Effect of PCV2 infection on the intracellular redox status of PK15 cells
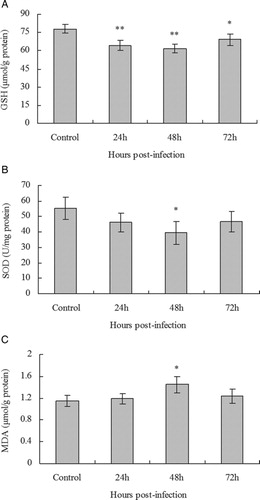
To determine whether PCV2 infection had an effect on intracellular redox status in vitro, PK15 cells were infected with PCV2 at MOI of 1 for 24, 48, and 72 hours and at each time point cells were collected for measurement of GSH, SOD, and MDA. Incubation with PBS served as mock-infected controls. Intracellular GSH concentrations decreased significantly compared with control cells, but showed a small return at 72 hours post-infection (A). There was a decrease in SOD activity in PK15 cells 48 hours after PCV2 infection (B), compared with control cells, but subsequently returned to normal levels after 72 hours. There was no change in MDA concentration at 24 after PCV2 infection in PK15 cells, but we observed a significant increase of approximately 26% in MDA concentration at 48 hours after infection, compared with control cells (C). These results suggested that PCV2 infection influenced intracellular redox status and caused oxidative stress in PK15 cells.
Figure 1. Effect of PCV2 infection on the intracellular redox status of PK15 cells. PK15 cells were infected with PCV2 at MOI of 1 and GSH concentration (A), SOD activity (B), and MDA concentration (C) in the cells measured after 24, 48, and 72 hours. Values shown are means ± SD from three independent experiments. Groups were compared by a one-way ANOVA followed by least-significant difference test (*P < 0.05, **P < 0.01).
Effect of NAC treatment on intracellular GSH levels and PCV2 replication
The antioxidant NAC, a precursor in GSH synthesis, was used to modulate intracellular GSH. PK15 cells were seeded at a density of 5 × 10⁴ per well in 24-well cell culture plates and incubated with 1 or 5 mM NAC overnight before PCV2 infection and for a further incubation with NAC for 72 hours. GSH levels both in infected and non-infected cells were found to be significantly increased after NAC treatment compared with control cells (A). These results indicated that intracellular GSH levels were increased by NAC.
Figure 2. Effect of NAC treatment on intracellular GSH levels and PCV2 replication. (A) GSH levels in NAC-treated PK15 cells were determined as described in the methods. PK15 cells were cultured overnight with various concentrations of NAC before PCV2 infection. After a further 72 hours in the presence of various concentrations of NAC PK15 cells were assayed for the number of viral DNA copies by real-time PCR (B) and the relative amount of PCV2-infected cells by immunofluorescence (C) in control group (D), 1 mM NAC-treated group (E), 10 mM NAC-treated group (F), and mock-infected group (G).Values shown are means ± SD from three independent experiments. Groups were compared by a one-way ANOVA followed by least-significant difference test (*P < 0.05, **P < 0.01). Within the groups with/without PCV2 infection, bars with ‘*’ or ‘#’ are statistically significantly different from control, respectively, by a one-way ANOVA followed by least-significant difference test (*P < 0.05, **P < 0.01; #P < 0.05, ##P < 0.01). ‘&’ denotes significant difference (&P < 0.05) between infected cells and non-infected cells by PCV2.
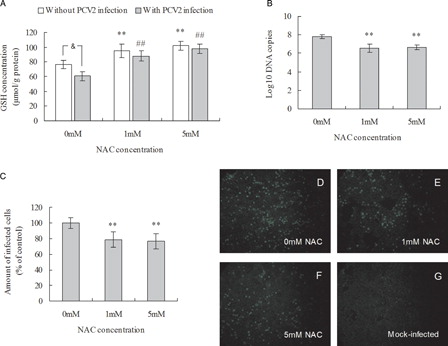
To determine whether increased intracellular GSH plays a role in PCV2 replication, the effects of NAC exposure on PCV2 replication in PK15 cells were assessed. PK15 cells were seeded in 24-well cell culture plates and cultured overnight with NAC before PCV2 infection at MOI of 1 and further incubation with NAC for 72 hours. NAC treatment decreased the progression of the infection as measured by the number of both PCV2 DNA copies and infected cells (B and 2C). The number of copies of PCV2 DNA and the percentage of PCV2-infected cells decreased significantly by 78 and 75%, respectively, after 72 hours incubation with 1 or 5 mM NAC when compared with the control cells (C). Treatment of a high titer viral stock solution with 5 mM NAC for 1 hour at 37°C showed no effect on virus infectivity when these cells were compared with a mock treatment control (data not shown), indicating that NAC did not directly inactivate the virus. Overall, the results suggest elevated GSH levels induced by NAC decreases viral replication.
Effect of H2O2 treatment on intracellular GSH levels and PCV2 replication
Hydrogen peroxide affects intracellular GSH levels via its oxidation. PK15 cells were seeded at a density of 5 × 10⁴ per well in 24-well cell culture plates, incubated with 10 or 50 µM H2O2 overnight before PCV2 infection and for a further incubation with H2O2 for 72 hours. GSH levels both in infected and non-infected cells were significantly decreased after treatment with 10 or 50 µM H2O2 compared with control cells (A).
Figure 3. Effect of H2O2 treatment on intracellular GSH levels and PCV2 replication. (A) GSH levels in H2O2-treated PK15 cells were determined as described in the methods. PK15 cells were cultured overnight with various concentrations of H2O2 before PCV2 infection and then, after a further 72 hours in the presence of H2O2, the number of viral DNA copies were assayed by real-time PCR (B) and the relative number of PCV2-infected cells assessed by immunofluorescence (C) in control group (D), 10 µM H2O2-treated group (E), 50 µM H2O2-treated group (F), and mock-infected group (G). Values shown are means ± SD from three independent experiments. Groups were compared by a one-way ANOVA followed by least-significant difference test (*P < 0.05, **P < 0.01). Within the groups with/without PCV2 infection, bars with ‘*’ or ‘#’ are statistically significantly different from control, respectively, by a one-way ANOVA followed by least-significant difference test (*P < 0.05, **P < 0.01; #P < 0.05, ##P < 0.01). ‘&’ denotes significant difference (&P < 0.05) between infected cells and non-infected cells by PCV2.
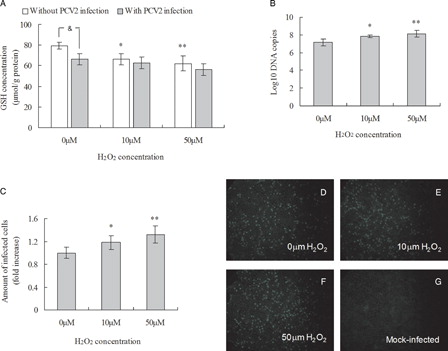
To investigate whether reduction of intracellular GSH levels affect PCV2 replication, the effects of H2O2 exposure on PCV2 replication in PK15 cells were evaluated. PK15 cells were seeded in 24-well cell culture plates and cultured overnight with various concentrations of H2O2 before PCV2 infection at MOI of 1 and incubation with H2O2 for a further 72 hours before determination of PCV2 replication. H2O2 treatment led to an increased progression of the infection as measured by the increased number of both copies of PCV2 DNA and infected cells (B and 3C). The number of copies of PCV2 DNA significantly increased and the mean fold increases in numbers of PCV2-infected cells were 1.18 and 1.32 after 72 hours incubation with 10 and 50 µM H2O2. Treatment of a high titer viral stock solution with 50 µM H2O2 for 1 hour at 37°C showed no effect on virus infectivity when these cells were compared with a mock treatment control (data not shown), indicating that H2O2 did not directly inactivate the virus. Overall, these results indicate that the reduction of intracellular GSH level induced by H2O2 increases viral replication.
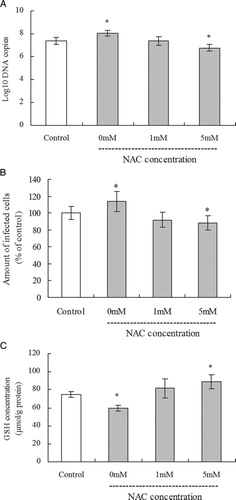
In order to clarify whether the increase of virus replication in H2O2-treated cells was dependent on the decreased GSH, the effects of NAC treatment on PCV2 replication and intracellular GSH levels in H2O2-treated PK15 cells were assessed. PK15 cells seeded in 24-well cell culture plates were cultured for 12 hours with 10 µM H2O2 and then incubated with various concentrations of NAC overnight. The PCV2 replication was determined by the number of both copies of PCV2 DNA and infected cells after PCV2 infection at MOI of 1 and incubation with NAC for a further 60 hours. H2O2 treatment led to an increased progression of the infection, but NAC treatment blocked the increase in virus replication induced by H2O2 as measured (A and 4B). The number of copies of PCV2 DNA significantly decreased again and the percentage of PCV2-infected cells decreased significantly by 88% after 72 hours incubation with 5 mM NAC when compared with the control cells. PK15 cells were seeded at a density of 5 × 10⁴ per well in 24-well cell culture plates, incubated with 10 µM H2O2 for overnight. After a further incubation with various concentrations of NAC for 60 hours, GSH levels in PK15 cells were found to be significantly decreased by H2O2 treatment but significantly increased again after 5 mM NAC treatment compared with control cells (C). These results indicate that the decrease of virus replication in H2O2-treated cells was dependent on the change of GSH levels.
Figure 4. Effect of NAC treatment in H2O2-treated cells on PCV2 replication and intracellular GSH levels. PK15 cells seeded in 24-well cell culture plates were cultured for 12 hours with 10 µM H2O2 and then incubated with various concentrations of NAC overnight. The numbers of viral DNA copies were assayed by real-time PCR (A) and the relative number of PCV2-infected cells assessed by immunofluorescence (B) after PCV2 infection at MOI of 1 and incubation with NAC for a further 60 hours. GSH levels were determined as described in the methods (C). Values shown are means ± SD from three independent experiments. Groups were compared by a one-way ANOVA followed by least-significant difference test (*P < 0.05, **P < 0.01).
Discussion
Reduced GSH is a predominant endogenous antioxidant in mammalian cells and its levels can be used as a marker of oxidative stress.Citation15 It has been reported that human HIV infection results in decreased total GSH concentration and early intracellular GSH depletion has been suggested to promote Sendai virus infection.Citation16,Citation17 It is usually assumed that a decrease in GSH levels reflects a more oxidative intracellular environment. However, the present results showing a significant decrease in intracellular GSH concentration 24 hours after PCV2 infection; however, a small return of intracellular GSH concentrations after 72 hours indicate a more complicated relationship between oxidative stress and viral infection.
SOD is a major enzyme that decomposes superoxide and protects cells from oxidative damage. It has been demonstrated that there is an increase in SOD gene expression during the replication of HCV and Epstein–Barr virus in vivo whereas there was an initial decrease,Citation18,Citation19 and then a progressive increase in the SOD activity after the infection of airway epithelial cells by respiratory syncytial virus.Citation20 In the present experiments, we observed a decrease in the SOD activity at 48 hours after PCV2 infection and then a return to normal levels at 72 hours, a pattern similar to that observed following respiratory syncytial virus infection. These data suggest a protective mechanism of up-regulating antioxidant defenses in response to PCV2 infection.
A decrease in the GSH level and SOD activity is expected to lead to excess superoxide, which in turn would generate hydroxyl radicals involved in initiation and propagation of lipid peroxidation. MDA concentrations are often increased during oxidative stress as a measure of increased lipid peroxidation.Citation21 A significant increase in MDA concentrations were observed after 48 hours post-infection and this coincided with the peak growth of PCV2 in the PK15 cells,Citation22,Citation23 suggesting that PCV2 infection influenced the intracellular redox status and caused oxidative stress in PK15 cells. In addition, alterations in intracellular GSH levels by treatment of PK15 cells with NAC or H2O2 modulated PCV2 replication. This latter observation is consistent with earlier data from studies of influenza virus and HIV infection,Citation24–Citation26 and it suggests that a high GSH level may be important for protection of PK15 cells not only against oxidative stress but also against PCV2 infection. In addition, NAC treatment blocked the increase of virus replication induced by H2O2, which was dependent on the change of GSH levels.
A dose-dependent difference on GSH level and PCV2 replication was observed after treatment with various concentrations of H2O2, but there was no dose-dependent difference statistically after NAC treatment. During our experiments, NAC at lower concentration did not exert its effect on PCV2 replication stably while NAC at higher concentration influenced the PK15 cell growth. With NAC treatment at the selected concentration, the change of PCV2 replication is still consistent with the increase of GSH level induced by NAC.
Thus, using PK15 cells as a model, these results demonstrate that a shift in intracellular redox status influences PCV2 replication. Little is known about the underlying mechanism. However, the mitogen-activated protein kinase (MAPK) signaling cascade is redox-modulated,Citation27,Citation28 and is activated in response to EV71 infection.Citation29 It has also been reported that MAPK and the stress-activated protein kinases are involved in replication of coxsackievirus B3 and encephalomyocarditis virus.Citation30,Citation31 In addition, activation of HIV-1 transcription and replication by ROS are induced via activation of nuclear factor-kB, which leads to transactivation of both viral and cellular genes.Citation32 The change of redox status in PK15 cells may cause stronger signaling through these pathways, thereby enhancing virus replication. Experiments are under way to test these possibilities.
Conclusion
Overall, these data show that PCV2 infection and replication not only induce oxidative stress but also are affected by the intracellular redox state of host cells. This not only emphasizes the important relationship between antioxidant protection and viral infection, but raises the possibility of using antioxidants or antioxidant supplementation in vivo either as a preventive measure against PCV2 infection or to improve PMWS therapy.
Acknowledgments
This work was funded by the National Natural Science Foundation of China (NSFC) (Grant numbers 31272627, 31011130155), the Research Fund for the Doctoral Program of Higher Education of China (Grant number 20110097110014) and the Priority Academic Program Development of Jiangsu Higher Education Institutions.
References
- Chen TH, Tang P, Yang CF, Kao LH, Lo YP, Chuang CK, et al. Antioxidant defense is one of the mechanisms by which mosquito cells survive dengue 2 viral infection. Virology 2011;410:410–7.
- Ha HL, Shin HJ, Feitelson MA, Yu DY. Oxidative stress and antioxidants in hepatic pathogenesis. World J Gastroenterol 2010;16:6035–43.
- Simula MP, De Re V. Hepatitis C virus-induced oxidative stress and mitochondrial dysfunction: a focus on recent advances in proteomics. Proteomics Clin Appl 2010;4:782–93.
- Baruchel S, Wainberg MA. The role of oxidative stress in disease progression in individuals infected by the human immunodeficiency virus. J Leukoc Biol 1992;52:111–4.
- Staal FJ, Roederer M, Herzenberg LA. Intracellular thiols regulate activation of nuclear factor kappa B and transcription of human immunodeficiency virus. Proc Natl Acad Sci USA 1990;87:9943–7.
- Michalek RD, Pellom ST, Holbrook BC, Grayson JM. The requirement of reactive oxygen intermediates for lymphocytic choriomeningitis virus binding and growth. Virology 2008;379:205–12.
- Bouzar AB, Boxus M, Florins A, Francois C, Reichert M, Willems L. Reduced levels of reactive oxygen species correlate with inhibition of apoptosis, rise in thioredoxin expression and increased bovine leukemia virus proviral loads. Retrovirology 2009;6:102.
- Allan GM, Mc Neilly F, Meehan BM, Kennedy S, Mackie DP, Ellis JA, et al. Isolation and characterisation of circoviruses from pigs with wasting syndromes in Spain, Denmark and Northern Ireland. Vet Microbiol 1999;66:115–23.
- Segales J, Allan GM, Domingo M. Porcine circovirus diseases. Anim Health Res Rev 2005;6:119–42.
- Donadeu M, Waddilove J, Marco E. European management strategies to control postweaning multisystemic wasting syndrome. Proceedings of the Allen D. Leman Swine Conference; 2003 Sep 13–16; University of Minnesota, St Paul, MN; 2003. p. 136–42
- Pan Q, Huang K, He K, Lu F. Effect of different selenium sources and levels on porcine circovirus type 2 replication in vitro. J Trace Elem Med Biol 2008;22:143–8.
- Rahman I, Kode A, Biswas SK. Assay for quantitative determination of glutathione and glutathione disulfide levels using enzymatic recycling method. Nat Protoc 2006;1:3159–65.
- Wang H, Wei W, Shen YX, Dong C, Zhang LL, Wang NP, et al. Protective effect of melatonin against liver injury in mice induced by Bacillus Calmette-Guerin plus lipopolysaccharide. World J Gastroenterol 2004;10:2690–6.
- Gavino VC, Miller JS, Ikharebha SO, Milo GE, Cornwell DG. Effect of polyunsaturated fatty acids and antioxidants on lipid peroxidation in tissue cultures. J Lipid Res 1981;22:763–9.
- Biswas SK, Newby DE, Rahman I, Megson IL. Depressed glutathione synthesis precedes oxidative stress and atherogenesis in Apo-E(-/-) mice. Biochem Biophys Res Commun 2005;338:1368–73.
- Nakamura H, Masutani H, Yodoi J. Redox imbalance and its control in HIV infection. Antioxid Redox Signal 2002;4:455–64.
- Ciriolo MR, Palamara AT, Incerpi S, Lafavia E, Bue MC, De Vito P, et al. Loss of GSH, oxidative stress, and decrease of intracellular pH as sequential steps in viral infection. J Biol Chem 1997;272:2700–8.
- Qadri I, Iwahashi M, Capasso JM, Hopken MW, Flores S, Schaack J, et al. Induced oxidative stress and activated expression of manganese superoxide dismutase during hepatitis C virus replication: role of JNK, p38 MAPK and AP-1. Biochem J 2004;378:919–28.
- Gargouri B, Nasr R, Ben Mansour R, Lassoued S, Mseddi M, Attia H, et al. Reactive oxygen species production and antioxidant enzyme expression after Epstein–Barr virus lytic cycle induction in Raji cell line. Biol Trace Elem Res 2011;144:1449–57.
- Hosakote YM, Liu T, Castro SM, Garofalo RP, Casola A. Respiratory syncytial virus induces oxidative stress by modulating antioxidant enzymes. Am J Respir Cell Mol Biol 2009;41:348–57.
- Halliwell B, Chirico S. Lipid peroxidation: its mechanism, measurement, and significance. Am J Clin Nutr 1993;57:715S–24S ; discussion 24S–25S.
- Meerts P, Misinzo G, Mcneilly F, Nauwynck HJ. Replication kinetics of different porcine circovirus 2 strains in PK-15 cells, fetal cardiomyocytes and macrophages. Arch Virol 2005;150:427–41.
- Cheung AK, Bolin SR. Kinetics of porcine circovirus type 2 replication. Arch Virol 2002;147:43–58.
- Geiler J, Michaelis M, Naczk P, Leutz A, Langer K, Doerr HW, et al. N-acetyl-L-cysteine (NAC) inhibits virus replication and expression of pro-inflammatory molecules in A549 cells infected with highly pathogenic H5N1 influenza A virus. Biochem Pharmacol 2010;79:413–20.
- Cai J, Chen Y, Seth S, Furukawa S, Compans RW, Jones DP. Inhibition of influenza infection by glutathione. Free Radic Biol Med 2003;34:928–36.
- Baba M. Inhibitors of HIV-1 gene expression and transcription. Curr Top Med Chem 2004;4:871–82.
- Fujino G, Noguchi T, Takeda K, Ichijo H. Thioredoxin and protein kinases in redox signaling. Semin Cancer Biol 2006;16:427–35.
- Torres M, Forman HJ. Redox signaling and the MAP kinase pathways. Biofactors 2003;17:287–96.
- Wong WR, Chen YY, Yang SM, Chen YL, Horng JT. Phosphorylation of PI3K/Akt and MAPK/ERK in an early entry step of enterovirus 71. Life Sci 2005;78:82–90.
- Hirasawa K, Kim A, Han HS, Han J, Jun HS, Yoon JW. Effect of p38 mitogen-activated protein kinase on the replication of encephalomyocarditis virus. J Virol 2003;77:5649–56.
- Luo H, Yanagawa B, Zhang J, Luo Z, Zhang M, Esfandiarei M, et al. Coxsackievirus B3 replication is reduced by inhibition of the extracellular signal-regulated kinase (ERK) signaling pathway. J Virol 2002;76:3365–73.
- Korenaga M, Wang T, Li Y, Showalter LA, Chan T, Sun J, et al. Hepatitis C virus core protein inhibits mitochondrial electron transport and increases reactive oxygen species (ROS) production. J Biol Chem 2005;280:37481–8.