Abstract
Objectives
Oxidative stress plays critical roles in the pathogeneses of diabetes, hypertension, and atherosclerosis, but its effect on fat accumulation is still unclear. In this study, we analyzed the role of the well-known antioxidant and a glutathione (GSH) precursor N-acetylcysteine (NAC) in fat accumulation and the expression of obesity-associated proteins.
Methods
We studied the effects of 10 µM NAC on obesity-related protein expression in cultured 3T3-L1 preadipocytes, which are able to differentiate into mature adipocytes and accumulate lipids.
Results
NAC treatment inhibited fat accumulation and reduced the expression of obesity-related proteins, including monoamine oxidase A, heat shock protein 70 (HSP70), aminoacylase -1 (ACY-1), and transketolase.
Discussion
Our results suggest that the effects of NAC on triglycerides (Tgs) and protein expression are correlated. In support of this, we showed that NAC treatment affected both the Tg synthesis pathway and the expression levels of proteins implicated in human obesity.
Introduction
Obesity is a chronic and progressive disease that affects a significant proportion of the world's population. It is a risk factor for many other diseases, such as diabetes, hypertension, stroke, cardiovascular disease, various types of cancer, and metabolic syndrome.Citation1 An increase in the number and size of adipocytes contributes to the etiology of obesity; therefore, understanding the process of adipogenic differentiation of pre-adipocytes is crucial for the development of therapies that address obesity.
To study the mechanisms involved in adipocyte formation, many researchers employ 3T3L-1 mouse fibroblasts.Citation2 These cells form adipocyte-like cells when injected into animals and have proven useful for obesity-related research as many in vivo studies have recapitulated in vitro observations.Citation3,Citation4 Triglyceride (Tg) accumulation is closely correlated with adipogenic differentiation and expression of adipogenic transcription factors, such as C/EBPs (CCAAT/Enhancer Binding Proteins) and PPARγ (peroxisome proliferator-activated receptor γ). These transcription factors are considered ‘master regulators’ of adipocyte-specific gene transcription because their expression is required to obtain a mature adipocyte phenotype.Citation5–Citation8
Recent studies have described a correlation between systemic oxidative stress and obesity in humans.Citation9 In line with these results, animal models have shown that antioxidant enzymes activities play fundamental roles in obesity.Citation10 However, changes in oxidative metabolism during differentiation of preadipocytes to adipocytes have not been clearly explored. We previously demonstrated that reactive oxygen species (ROS) levels increase together with Tg accumulation during adipogenic differentiation. Because increases in ROS levels can affect cell viability, antioxidant enzymes such as superoxide dismutase (SOD) are expressed concomitantly to maintain oxidative balance during differentiation to avoid deleterious effects on cell viability.Citation11 Accordingly, the use of antioxidants as regulators of adipogenic differentiation has recently been discussed,Citation12,Citation13 and it is important to clarify whether the relationship with antioxidants is a correlation or causation. In this context, we are interested in the role of glutathione precursors, such N-acetylcysteine (NAC). Wang et al. recently showed that mice that consumed NAC exhibited increased O2 consumption and decreased body fat;Citation14 whereas Gou et al. suggested that beta-mercaptoethanol (BME), also a glutathione precursor, enhanced adipogenic gene marker expression and lipid accumulation, effects associated with downregulation of inflammatory cytokine expression during adipogenic differentiation.Citation15 However, they did not measure intracellular GSH levels following BME treatment and reported that others had described controversial findings regarding oxidative stress and antioxidant effect on lipid accumulation.Citation15
We previously demonstrated that antioxidants are effective for treating several pathologies.Citation16–Citation19 In a recent report, we evaluated the possible benefit/detriment of the use of NAC during adipogenesis in this in vitro 3T3L-1 mouse fibroblast model. Specifically, we demonstrated that NAC inhibits Tg accumulation and C/EBPβ and PPARγ expression; while it promotes increased GSH during 3T3-L1 preadipocyte differentiation.Citation20 Our previous results indicate that ROS levels increase during adipogenic differentiation, which leads to a consequent increase in SOD activity. Our earlier kinetic experiments demonstrated that NAC caused a decrease in PPARγ expression, presumably by affecting C/EBPβ expression, without altering AKT signaling.Citation20 In this study, we analyzed the effects of NAC on the expression of proteins associated with human obesity during adipogenesis. Moreover, we analyzed proteins involved in oxidative stress, such as monoamine oxidase A (MAOA) and heat shock protein 70 (HSP70), as well as proteins related to amino acid metabolism and carbohydrate metabolism that were recently evaluated in this model, aminoacylase-1 (ACY-1) and transketolase (TKT).Citation21
Materials and methods
Cell cultures and drugs
Swiss 3T3-L1 cells (mouse preadipocytes) were obtained from the American Type Culture Collection (Rockville, MD, USA). Cells were cultured in Dulbecco's modified Eagle medium (DMEM) supplemented with 25 mmol/l glucose and 10% fetal bovine serum (FBS) at 37°C with 5% CO2. N-Acetyl-l-cysteine (NAC), the fluorescent probe CM-H2DCFDA, and all other reagents (except when specified) were purchased from Sigma-Aldrich Co. (St. Louis, MO, USA). NAC was dissolved in DMEM (25 mmol/l glucose, 10% FBS), and DMEM was also used as vehicle (control treatment).
Differentiation of 3T3-L1 preadipocytes into adipocytes
3T3-L1 preadipocytes (derived from the Swiss 3T3 parental line) were first cultured in MDI media (DMEM (25 mmol/l glucose, 10% FBS) with 0.5 mmol/l 3-isobutyl-1-methyl xanthine (M), 0.1 µM dexamethasone (D), and 2 µmol/l insulin (I)) for 48 hours. Then, the cells were incubated in fresh DMEM (25 mmol/l glucose, 10% FBS) containing 2 µmol/l insulin for 3 days and finally in DMEM (25 mmol/l glucose, 10% FBS) for the remainder of the experiment. Day 0 of differentiation is marked when the cells are introduced to MDI media. At day 10, 70–80% of cells dramatically increased their Tg content and generated refractive droplets easily observable by microscopy or by Oil Red O staining.Citation22 We considered MDI-treated cells as differentiating cells (DCs) and vehicle-treated cells as control cells (CCs).
In indicated plates, 10 µmol/l NAC was added at day 0 of differentiation to the MDI medium (DCN). At the indicated times, the cells were washed once with 0.01 M phosphate-buffered saline (PBS) at room temperature, scraped into the 0.5 ml water, and frozen for further analysis. For western blots, cells were lysed with a buffer containing 1% sodium dodecyl sulfate (SDS) in 60 mmol/l Tris-HCl, boiled for 10 minutes, centrifuged at 15 000 rpm (4°C) for 10 minutes, and frozen for further analysis.
Determination of Tg and protein levels
Tg accumulation was assessed using a TG color GPO/PAP AA kit (Wiener Laboratory, Rosario, Argentina). Tg content is expressed as g Tg/g protein. Proteins were quantified by the Bradford method using crystalline bovine serum albumin (BSA) as a standard.Citation23 Results are presented as the average of four independent experiments (mean ± SD).
MTT assay
To evaluate the toxicity of NAC treatment, MTT (Bromide 3-[4,5-dimethylthiazol-2-yl]-2,5-difeniltetrazol) viability assays were performed.Citation24 While this assay detects living cells, it can also be used to measure cell proliferation. The technique is based on the presence of mitochondrial enzymes in viable cells that reduce the MTT dye to produce a purple color. A stock solution of 5 mg/ml MTT was prepared, and the dye was diluted in complete media (DMEM; 25 mmol/l glucose, 10% FBS), to a working concentration of 1 mg/ml. Cells were seeded at 20 × 104 cells/well, and 300 µl MTT was added to each well. After incubation for 1 hour, the medium was removed, and the cells were treated with 200 µl ethanol for 10 minutes. The resulting solution in each well was transferred to a 96-well plate, and its absorbance was measured at 550 nm by a spectrophotometer. To further evaluate toxicity, we performed assays in which cell viability was determined under different NAC concentrations: 10, 20, 50, and 100 µmol/l. The absorbance of control values (CC) was considered as 100%, and the results are presented as percentages of CC. The results represent the averages of four independent experiments (mean ± SD).
Proliferation assay
To evaluate the toxicity of NAC treatment, cells (50 × 104) were seeded on a plate and cultured in the presence of vehicle or 10 µmol/l NAC. At the indicated times, cells were counted. Viable cells were discriminated by trypan blue stain exclusion. The results shown are the average of four independent experiments (mean ± SD).
Western blot analysis
3T3-L1 cells were lysed in sample buffer (1% SDS, 60 mmol/l Tris-HCl), boiled for 10 minutes, and centrifuged at 15 000 rpm (4°C) for 10 minutes. Proteins (10 µg from each sample) were then separated on 15% SDS-polyacrylamide gels and transferred to nitrocellulose membranes (Amersham; GE Healthcare, Little Chalfont, UK). After transfer, membranes were soaked in blocking buffer (5% BSA, 0.4% Tween, and 1 mmol/l ethylenediaminetetraacetic acid in 0.01 M PBS) for 1 hour and incubated overnight with a primary antibody at 4°C. To detect the western blot signal, membranes were probed with horseradish-conjugated secondary antibodies (Santa Cruz Biotechnology, Santa Cruz, CA, USA) and then treated with the enhanced chemiluminescence (ECL) substrate kit (Amersham ECL Plus Western Blotting Detection System; GE Healthcare). The primary antibodies included anti-FABP4 (Eurogentec, Seraing, Belgium), anti-TKT (HPA Reagents), anti-ACY-1 (Sigma-Aldrich), anti-HSP70 (Stressgen Bioreagents, Victoria, BC, Canada) and anti-MAOA (Sigma-Aldrich). In all cases, expression was normalized to glyceraldehyde 3-phosphate dehydrogenase expression. Samples were obtained at days 0 (CC), 2, 4, 6, 8, and 10 of differentiation in the absence and presence of 10 µmol/l NAC (DC2 and DCN2, DC4 and DCN4, DC6 and DCN6, DC8 and DCN8, DC10 and DCN10, respectively). These results are the average of three independent experiments (mean ± SD).
Statistics
Statistical analysis was performed by one-way analysis of variance followed by post hoc analysis.Citation25
Results
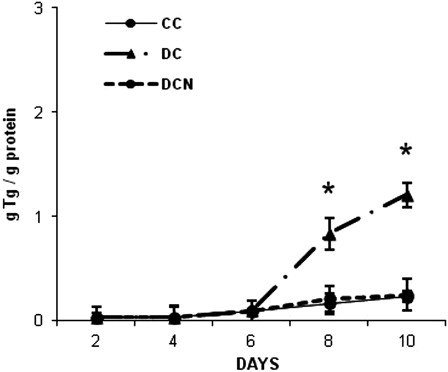
To induce differentiation, 3T3-L1 preadipocyte growth media (DMEM) was replaced with MDI media (day 0). At day 10 of this differentiation protocol, 70–80% of the cells were considered fully differentiated because they contained refractive lipid droplets as detected by microscopy. Fully differentiated cells (DCs) had almost six times the level of Tg in vehicle-treated cells (CC) (1.20 ± 0.12 g Tg/g protein (DC) vs. 0.23 ± 0.05 g Tg/g protein (CC), P < 0.01). We have previously shown that ROS levels, SOD and GPx activity increased in DCs.Citation20 Interestingly, Tg accumulation in 10 µmol/l NAC-treated DC was considerably reduced and similar to the levels observed in CC (0.21 ± 0.1 g Tg/g protein (DCN)). A time-course assay to evaluate the effect of NAC on Tg levels showed a significant decrease in Tg content, with a similar kinetic as observed in CC ().
Figure 1. Triglyceride accumulation in 3T3-L1 during adipogenic differentiation. NAC was added at day 0 and replaced every day for 10 days (DCN). The results are the average of four independent experiments (mean ± SD). *P < 0.01, MDI-treated cells (DCs) vs. control cells (CCs).
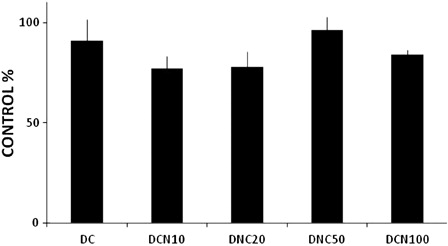
Importantly, 10 µmol/l NAC was not toxic to cells, even after 10 days of treatment ( and ). NAC toxicity was evaluated by MTT (A) and proliferation (B) assays. Because MTT assay results were reported to be influenced by antioxidant compounds,Citation26 we performed a proliferation assay to confirm the data, and similar results were obtained in time-course assays with NAC. Furthermore, NAC treatment did not lead to any toxic effects in vehicle-treated cells (10 µmol/l NAC-treated control cells: CCN, data not shown). These cells had comparable Tg content to CC (0.20 ± 0.08 Tg/g protein (CCN) vs. 0.23 ± 0.05 g Tg/g protein (CC), no significant difference was observed). In a dose-dependent assay, we found that NAC doses from 10 to 100 µmol/l were not harmful to cells ().
Figure 2. NAC effect on 3T3-L1 cells at day 10 of differentiation. (A) Control cells (CCs), (B) and (C) MDI-treated cells (DCs), (D) MDI + 10 µmol/l NAC-treated cells (DCN). Representative results from one of four independent experiments with similar results are shown.
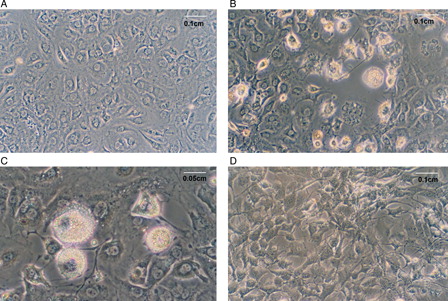
Figure 3. NAC effect on cell viability during adipogenic differentiation. Comparison of MDI cells (DCs) and MDI + 10 µmol/l NAC-treated cells (DCN). Cells were harvested at indicated times. (A) MTT assay was performed, control cells (CCs) absorbance was considered as 100%. (B) Cell were counted, and viable cells were evaluated by trypan blue stain exclusion, control cells (CCs) number was considered as 100%. Data are presented as percentages of control cells. The results are the average of four different experiments (mean ± SD).
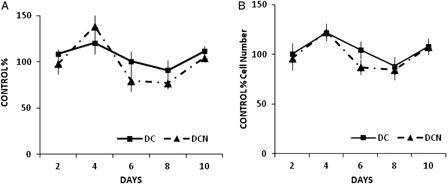
Figure 4. Concentration-dependent effect of NAC on cell viability. MDI cells were treated with 10 µmol/l NAC (DCN10), 20 µmol/l NAC (DCN20), 50 µmol/l NAC (DCN50) or 100 µmol/l NAC (DCN100). Control cells (CCa), MDI-treated cells (DC) and MDI–NAC-treated cells were harvested at day 10, and MTT assays were performed. The absorbance of vehicle-treated cells (CCs) was considered 100% cell viability. The results shown are the averages of four different experiments (mean ± SD).
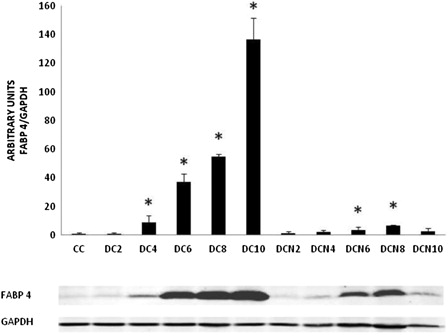
Since NAC treatment led to decreased Tg levels during adipogenic differentiation, we evaluated the effect of this antioxidant on the expression of obesity-related proteins. We focused on proteins that are differentially expressed during adipogenesis. Fatty acid-binding protein 4 (FABP4, ap2) is an obesity-related protein that is a well-studied marker of adipocyte differentiation;Citation21 its expression significantly increased after day 4 of differentiation in MDI-treated cells and peaked at day 10. Meanwhile, NAC treatment significantly inhibited FABP4 expression (). At day 10, FABP4 expression levels in NAC-treated cells were only 2% of the levels observed in DC.
Figure 5. FABP4 expression during adipogenic differentiation. The values represent fold increases in protein expression compared to control cells (CCs). The bars shown are the averages of three different experiments (mean ± SD). Representative results from one of three independent western blot experiments with similar results are shown. Results are expressed as arbitrary units; *P < 0.01 MDI–NAC-treated cells (DCN) vs. CCs; *P < 0.01 MDI-treated cells (DC) vs. CCs.
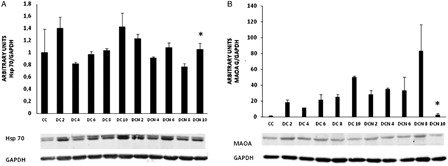
Next, we studied proteins related to cellular stress in obesity, such as HSP70 and MAOA. We observed that HSP70 protein levels remained constant throughout differentiation with no significant differences in expression from that observed in control cells (A). HSP70 expression was similar in DC and DCN until day 6, but significantly fell in DCN at days 8 and 10 (day 8: 1.04 ± 0.02 (DC) vs. 0.76 ± 0.05 (DCN), P < 0.05; day 10: 1.42 ± 0.22 AU (DC) vs. 1.05 ± 0.10 AU (DCN), P < 0.01). On the other hand, MAOA expression significantly increased in DC compared to CC (P < 0.01) throughout differentiation (B). Despite NAC treatment, MAOA expression steadily increased during the first 8 days of differentiation protocol in NAC-treated cells (DCN), with similar or even higher protein expression levels in DCN than DC. Therefore, no significant difference in MAOA expression during the first 8 days was observed between DC and DCN, but MAOA expression significantly dropped at day 10 in DCN (50.0 ± 1.6 AU (DC) vs. 2.5 ± 1.6 AU (DCN), P < 0.01) to a level that was not significantly different from control cells (B).
Figure 6. HSP70 (A) and MAOA expression (B) during adipogenic differentiation. The values represent fold increases in protein expression compared to control cells (CC). The bars shown are the averages of three different experiments (mean ± SD). Representative results from one of three independent western blot experiments with similar results are shown. Results are expressed as arbitrary units; *P < 0.01 MDI–NAC-treated cells (DCN) vs. MDI-treated cells (DC) at day 10.
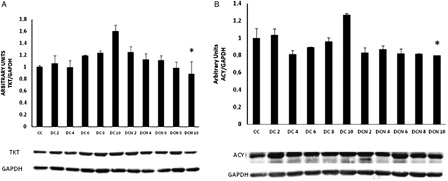
Proteins related to amino acid and carbohydrate metabolism, such as TKT and ACY-1, are upregulated during differentiation in a similar fashion to FABP4 expression.Citation21 We observed a similar pattern for TKT and ACY-1 expression in untreated DC. The differentiation protocol provoked a significant increase in TKT expression in DC from day 8 (day 8: 1.24 ± 0.03 AU (DC) vs. 1.00 ± 0.02 AU (CC), P < 0.01; day 10: 1.60 ± 0.09 AU (DC) vs. 1.00 ± 0.02 AU (CC), P < 0.01), correlating with the Tg increase. Meanwhile ACY-1 protein showed similar expression in DC and CC until day 10, when ACY-1 expression was significantly increased (ACY at day 10: 1.27 ± 0.01 AU (DC) vs. 1.00 ± 0.11 AU (CC), P < 0.01). However, as shown in , NAC treatment inhibited expression of both proteins from day 8 onward: TKT (day 8: 1.24 ± 0.03 AU (DC) vs. 0.98 ± 0.10 AU (DCN), P < 0.05; day 10: 1.60 ± 0.09 AU (DC) vs. 0.88 ± 0.20 AU (DCN), P < 0.01) and, ACY-1 (day 8: 0.96 ± 0.04 AU (DC) vs. 0.81 ± 0.01 (DCN), P < 0.05; day 10: 1.26 ± 0.02 AU (DC) vs. 0.79 ± 0.01 AU (DCN), P < 0.01).
Figure 7. TKT (A) and ACY-1 expression (B) during adipogenic differentiation. The values represent fold increases in protein expression compared to control cells (CC). The bars shown are the averages of three different experiments (mean ± SD). Representative results from one of three independent western blot experiments with similar results are shown. Results are expressed as arbitrary units; *P < 0.01 MDI–NAC-treated cells (DCN) vs. MDI-treated cells (DC) at day 10.
Discussion
The effects of free radical formation and oxidative stress during adipogenesis have just started to gain scientific attention. While still controversial, there is increasing evidence that suggests a role for oxidative stress and free radicals in promoting adipogenesis.Citation27,Citation28 By using NAC as an antioxidant, it was shown that ROS are involved in the differentiation of 3T3-L1 preadipocytes.Citation20 In addition, NAD(P)H oxidase family (Nox 4) has been implicated in ROS production at early stages of preadipocyte differentiation.Citation29 The 3T3-L1 cell line is routinely used as a model to study the adipocyte differentiation pathway in physiologically severe hyperglycemic condition (25 mmol/l glucose in culture medium) with insulin-resistant and lipid-laden adipocytes upon differentiation. Some reports evaluated the effect of lower glucose culture medium (4 mmol/l glucose) and showed that this euglycemic condition differs from the initial model in insulin sensitivity upon differentiation, while 3T3-L1 preadipocytes were able to differentiate.Citation30 In both conditions, ROS levels increased during cell differentiation, and antioxidant enzyme activity appeared to be sufficient to allow cell survival since fully differentiated adipocytes were observed.
We initially tested the toxicity of various NAC concentrations (10, 20, 50, and 100 µmol/l) and found that this antioxidant was highly tolerated by cells. Tg content was significantly higher in fully DCs compared to vehicle-treated cells at day 8 of differentiation. However, we showed that NAC inhibited Tg accumulation in adipocytes undergoing differentiation. We used the lowest concentration of NAC (10 µmol/l) that exerted the maximum inhibitory effect on Tg accumulation. We reasoned that NAC-mediated inhibition of Tg accumulation occurs as a result of its effect on the expression of key adipogenic transcription factors. Cells were identified as adipocytes based on their ability to accumulate Tg and express fat-specific proteins, such as FABP4 (ap2) and PPARγ.Citation31 We found that FABP4 expression was significantly increased during differentiation but was drastically inhibited by NAC treatment.
Expression of obesity-related proteins in humans was recently evaluated in a proteomics study.Citation21 The results implicated TKT and ACY-1 in the pathophysiology of obesity. In this study, both proteins were highly expressed in fully DCs at day 10. However, NAC treatment reduced Tg accumulation, as well as, significantly inhibited TKT and ACY-1 expression. TKT is a thiamine diphosphate dependent enzyme that catalyzes reactions in the pentose phosphate pathway, which is important for the production of reduced nicotinamide-adenine dinucleotide phosphate (NADPH) that is involved in the fatty acid biosynthesis pathway. In mature adipocytes, one of the main functions of TKT is to produce NADPH and promote lipogenesis.Citation21 Thus, our results suggest that NAC affects a metabolic pathway that links Tg and TKT; we observed that TKT expression increased from day 8, which correlated with the Tg increase in DCs. Based on these findings, we could speculate that NAC impaired the protein increase from day 8 to day 10. As a consequence, NAC could affect lipogenesis and might decrease Tg accumulation in NAC-treated cells. Interestingly, expression of ACY-1, which functions in the catabolism of acylated amino acids, is also altered in models of obesity,Citation21 and ACY-1 levels increased in fully differentiated 3T3-L1 cells. Here, we observed a significant increase in ACY-1 at day 10 of the differentiation pathway, as a possible consequence of Tg increase. We found that NAC treatment decreased its expression to levels comparable to non-differentiated cells, correlating with Tg content decrease.
Expression of HSP70 and MAOA, proteins related to oxidative stress, has been associated with obesity. HSP70 is a heat shock protein that belongs to a family of intracellular proteins found in all eukaryotes. It serves as a chaperone of protein folding and functions to maintain cellular homeostasis in response to stress.Citation32 HSP70 expression is increased in adipose tissue of the obese,Citation21,Citation33 suggesting that HSP70 has a protective role in obese subjects. HSP70 expression was previously evaluated in 3T3-L1 cells undergoing differentiationCitation34 and was related to oxidative stress.Citation35 Here, we observed that HSP70 expression levels are similar in fully differentiated adipocytes and control preadipocytes cells. Because increased SOD and GPx activities were previously reported during adipogenic differentiation,Citation20 we could speculate that no increase of this heat shock protein was observed in fully differentiated adipocytes because antioxidant enzyme activities were sufficient to overcome the deleterious effects of ROS. In this context, we observed that NAC treatment significantly decreased HSP70 expression at day 8, and we could attribute this result to the antioxidant effects of NAC on ROS.
MAOA is a mitochondrial enzyme involved in oxidative deamination catabolism of neurotransmitters and exogenous amines; recent reports have shown that MAOA expression levels may be predictive of body mass index changes in adolescents and young adults.Citation36 In accordance with previous reports showing that MAOA is highly expressed in human adipocytes,Citation37 we observed an upregulation of its expression during adipogenic differentiation in 3T3-L1; this is the first time that MAOA expression was evaluated in the 3T3-L1 preadipocyte differentiation pathway. While this pattern was sustained in NAC-treated cells in the first 8 days of differentiation, MAOA levels significantly dropped by day 10, correlating with a Tg decrease.
Taken together, our results indicate that NAC affects multiple targets that coordinately function to alter the oxidative and metabolic states of adipocytes. Antioxidant use is commonly discussed nowadays; we could consider that individuals in the western world are already overloaded with antioxidant dietary supplements, such as food preservatives and vitamins. Antioxidant food additives, such as sodium sulphite, sodium benzoate, and curcumin, have been shown to suppress leptin release in lipopolysaccharide-treated murine adipocytes, and the involvement of antioxidant food supplements in obesity should be discussed.Citation38 Ciardi et al. tested food preservatives with antioxidant- and/or radical-scavenging properties, which could play a role in interfering with the signal transduction cascades that modulate leptin production; their results showed decreased leptin release from 3T3-L1 cells during differentiation and suggested that a state of inflammation may be prerequisite for the effect on leptin.Citation39 Because obesity is associated with inflammation, the effect of co-incubation of antioxidants with lipopolysaccharide could be a more accurate model of obesity; here we only evaluated the effect of a single one antioxidant in an in vitro model. Other free radical scavengers, such as curcumin, showed controversial effects. It could suppress the lipolysis response to tumor necrosis factor-α and catecholamines in 3T3-L1 adipocytes.Citation40 Meanwhile, others reported its ability to inhibit the activity of specific adipogenic transcription factors, such as PPARγ,Citation41 and the resulting lower oxidative state might explain both the beneficial effects of curcumin on inflammation and decreased cellular lipid content. Finally, other antioxidants, such as benzoates, could inhibit lipolysis in wild-type murine adipocytes,Citation42 whereas flavonoids, phenolic acids, and tocotrienol showed anti-adipogenic effects in 3T3-L1 cells.Citation43,Citation44
We evaluated the effect of NAC on the 3T3-L1 cell line during adipogenic differentiation, and our results suggest that NAC affects Tg accumulation and obesity-related protein expression. However, more studies are needed to investigate the potential impact of NAC on obesity development or treatment. It is unclear to what extent any conclusion from the present in vitro study can be extrapolated to the situation in vivo, but diets with antioxidants, such as NAC, could have a regulatory effect on adipogenic pathways.
Acknowledgements
This study was supported by Grant UBACYT 20020110200187 (Universidad de Buenos Aires, Argentina), OAT 17/11 (Universidad de Buenos Aires, Argentina) and, Grant SAF-2009-10461 (Ministerio de Ciencia e Innovación Tecnológica, España). Juan Carlos Calvo and Liliana N. Guerra are researched funded by CONICET (Ministerio de Ciencia y Técnica, Argentina) and Universidad de Buenos Aires.
References
- Spiegeman BM, Fliers JS. Obesity and regulation of energy balance. Cell 2001;104:531–43.
- Calvo JC, Chernick S, Rodbard D. Mouse mammary epithelium produces a soluble heat-sensitive macromolecule that inhibits the differentiation of 3T3-L1 preadipocytes. Proc Soc Exp Biol Med 1992;201:174–9.
- Green H, Kehinde O. Sublines of mouse 3T3 cells that accumulate lipid. Cell 1974;4:113–6.
- Green H, Kehinde O. An established preadipose cell line and its differentiation in culture: factors affecting the adipose conversion. Cell 1975;5:19–27.
- Mac Dougald OA, Lane MD. Transcriptional regulation of gene expression during adipocyte differentiation. Annu Rev Biochem 1995;64:345–58.
- Darlington GJ, Ross SE, Mac Douglas OA. The role of C/EBP genes in adipocyte differentiation. J Biol Chem 1996;273:30057–60.
- Hemati N, Ross SE, Erickson RL, Groblewski GE, Mac Douglas OA. Signaling pathways through which insulin regulates CCAAT/Enhancer Binding Protein alpha phosphorylation and gene expression in 3T3-L1 adipocytes. J Biol Chem 1997;272:25913–19.
- Tontonoz P, Hu E, Spiegelman BM. Stimulation of adipogenesis in fibroblast by PPARg, a lipid-activated transcription factor. Cell 1994;79:1147–65.
- Keany JF, Larson MG, Vasan RS. Obesity and systemic oxidative stress: clinical correlates of oxidative stress in Framingham Study. Arterioscler Thromb Vasc Biol 2003;23:434–9.
- McClung J, Roneker C, Mu W, Lisk D, Langlais P, Liu F, Lei XG. Development of insulin resistant and obesity in mice overexpressing cellular glutathione peroxidase. Proc Natl Acad Sci USA 2004;101:8852–7.
- Sapochnick D, Julianelli V, Garate H, Calvo JC, Guerra LN. Oxidative metabolism during preadipocytes differentiation. Free Radicals in Montevideo Book of Abstracts. Montevideo: SFRBM Press; 2007. p. 60.
- Kim JR, Ryu H, Chung HJ, Lee JH, Kim SW, Kwun WH, et al. Association of anti-obesity activity of N-acetylcysteine with mettallothionein-II down-regulation. Exp Mol Med 2006;30:162–72.
- Araki S, Dobashi K, Kugo K, Yamamoto Y, Asayama K, Shirahata A. N-acetylcysteine attenuates TNF-alpha induced changes in secretion of interleukin-6, plasminogen activator inhibitor-1 and adiponectin from 3T3-L1 adipocytes. Life Sci 2006;79:2405–12.
- Wang T, Si Y, Shirihai OS, Si H, Schultz V, Corkey RF, et al. Respiration in adipocytes is inhibited by reactive oxygen species. Obesity 2010;18:1493–502.
- Guo W, Li Y, Liang W, Wong S, Apovian C, Kirkland B, et al. Beta-mercaptoethanol suppresses inflammation and induces adipogenic differentiation in 3T3-F442 murine preadipocytes. PLoS One 2012;7:e40958.
- Miler EA, Rios MC, Dominguez G, Guerra LN. Thyroid hormone effect in human hepatocytes. Red Rep 2008;13:185–91.
- Miler E, Burdman JA, Ríos de Molina MC, Bechara Y, Guerra LN. Thyroid hormone and oxidative metabolism. Free Radical Research Internacional. Bologna: Monduzzi Editors; 2004. p. 329–33.
- Guerra LN, Rios de Molina MC, Miler EA, Moiguer S, Karner M, Burdman JA. Antioxidants and methimazole in the treatments of Graves’ disease: effect on urinary malondialdehyde levels. Clin Chim Acta 2005;352:115–20.
- Guerra LN, Moiguer S, Karner M, Rios de Molina MC, Sreider C, Burdman JA. Antioxidants in the treatment of Graves Disease. IUBMB Life 2001;51:105–9.
- Calzadilla P, Sapochnick D, Cosentino S, Diz V, Dicelio L, Calvo JC, et al. N-acetylcysteine reduces markers of differentiation in 3T3-L1 adipocytes. Int J Mol Sci 2011;12:6936–51.
- Perez-Perez R, Garcia-Santos E, Ortega-Delgado FJ, Lopez JA, Camafeita E, Ricart W, et al. Attenuated metabolism is a hallmark of obesity as revealed by comparative proteomic analysis of human omental adipose tissue. J Proteomics 2012;75:783–95.
- Julianelli VL, Guerra LN, Calvo JC. Cell–cell communication between mouse mammary epithelial cells and 3T3 T-L1 preadipocytes: Effect on triglyceride accumulations and cell proliferation. Biocell 2007;31:237–45.
- Bradford MM. A rapid and sensitive method for the quantitation of microgram quantities of protein utilizing the principle of protein-dye binding. Anal Biochem 1976;72:248–54.
- Mosmann T. Rapid colorimetric assay for cellular growth and survival: application to proliferation and cytotoxicity assays. J Immunol Methods 1983;65:55–63.
- Analytical Software, Statistix 8, Tallahassee, FL, USA: McGraw–Hill/Irwin, 2003.
- Natarajan M, Mohan S, Martinez BR, Meltz ML, Herman TS. Antioxidant compounds interfere with the 3. Cancer Detect Prev 2000;24:405–14.
- Gummersbach C, Hemmrich K, Klaus-Dietrich K, Suschek CV, Fehsel K, Pallua N. New aspect of adipogenesis: radicals and oxidative stress. Differentiation 2009;77:115–20.
- Lee H, Jeong Y, Choi H, Ko E, Kim J. Reactive oxygen species facilitates adipocyte differentiation by accelerating mitotic clonal expansion. J Biol Chem 2009;284:10601–9.
- Kanda Y, Hinata T, Kang SW, Watanabe Y. Reactive oxygen species mediate adipocyte differentiation in mesenchymall stem cells. Life Sci 2011;89:250–8.
- Lin Y, Berg AH, Iyengar P, Lam T, Giacca A, Combs T, et al. The hyperglycemia-induced inflammatory response in adipocytes. The role of reactive oxygen species. J Biol Chem 2005;280:4617–26.
- Shao HY, Hsu HY, Wu KS, Hee SW, Chuang LM, Yeh JI. Prolonged induction activates C/EBP a independent adipogenesis in NID/3T3-L1 cells. PLoS One 2013;8:e51459.
- Chung J, Nguyen AK, Henstridge DC, Holmes AG, Chan MH, Mesa JL. HSP72 protects against obesity-induced insulin resistance. Proc Natl Acad Sci. U S A 2008;105:1739–44.
- Uchida Y, Takeshita K, Yamamoto K, Kikuchi R, Nakayama T, Nomura M, et al. Stress augments insulin resistance and prothrombotic state: role of visceral adipose-derived monocyte chemoattractant protein-1. Diabetes 2012;61:1552–61.
- Imagawa M, Tsuchiya T, Nishihara T. Identification of inducible genes at the early stage of adipocyte differentiation of 3T3-L1 cells. Biochem Biophys Res Commun 1999;254:299–305.
- Gallo L, Lagadari M, Piwien-Pilipuk G, Galigniana MD. The 90-kDa heat-shock protein (Hsp90)-binding immunophilin FKBP51 is a mitochondrial protein that translocates to the nucleus to protect cells against oxidative stress. J Biol Chem 2011;286:30152–160.
- Fuemmeler BF, Agurs-Collins T, McClernon FJ, Kollins SH. Genes implicated in serotonergic and dopaminergic functioning predict BMI categories. Obesity 2008;16:348–55.
- Pizzinat N, Marti L, Remaury A, Leger F, Langin D, Lafontan M. High expression of monoamine oxidase in human white tissue: evidence for their involvement in noradrenaline clearance. Biochemical Pharmacol 1999;58:1735–42.
- Mangge H, Summers K, Almer G, Prass R, Weghuber D, Schndel W, et al. Antioxidant food supplements and obesity-related inflammation. Curr Med Chem 2013;20:2330–7.
- Ciardi C, Jenny M, Tschoner A, Ueberall F, Patsch J, Pedrini M, et al. Food additives such as sodium sulphite, sodium benzoate and curcumin inhibit leptin release in lipopolysaccharide-treated murine adipocytes in vitro. Br J Nutr 2012;107:826–33.
- Xie XY, Kong PR, Wu JF, Li Y, Li YX. Curcumin attenuates lipolysis stimulated by tumor necrosis factor-α or isoproterenol in 3T3-L1 adipocytes. Phytomedicine 2012;20:3–8.
- Zingg JM, Hasan ST, Meydani M. Molecular mechanisms of hypolipidemic effects of curcumin. Biofactors 2013;39:101–21.
- Liu C, Kuei C, Zhu J, Yu J, Zhang L, Shih A, et al. 3,5-Dihydroxybenzoic acid a specific agonist for hydroxycarboxylic acid 1, inhibits lipolysis in adipocytes. J Phar Exp Ther 2012;341:794–801.
- Uto-Kondo H, Ohmori R, Kiyose C, Kishimoto Y, Saito H, Igarashi O, et al. Tocotrienol suppresses adipocyte differentiation and AKT phosphorylation in 3T3-L1 preadipocytes. J Nutr 2009;139:51–7.
- Hsu CL, Yen GC. Effect of flavonoids and phenolic acid on the inhibition of adipogenesis in 3T3-L1 adipocytes. J Agric Food Chem 2007;17:8404–10.