
Abstract
Introduction: The thioredoxin system, consisting of thioredoxin reductase, thioredoxin and NADPH, is present in most living organisms and reduces a large array of target protein disulfides.
Objective: The insulin reduction assay is commonly used to characterise thioredoxin activity in vitro, but it is not clear whether substrate saturation datasets from this assay should be fitted and modeled with the Michaelis-Menten equation (thioredoxin enzyme model), or fitted to the thioredoxin system with insulin reduction described by mass-action kinetics (redox couple model).
Methods: We utilized computational modeling and in vitro assays to determine which of these approaches yield consistent and accurate kinetic parameter sets for insulin reduction.
Results: Using computational modeling, we found that fitting to the redox couple model, rather than to the thioredoxin enzyme model, resulted in consistent parameter sets over a range of thioredoxin reductase concentrations. Furthermore, we established that substrate saturation in this assay was due to the progressive redistribution of the thioredoxin moiety into its oxidised form. We then confirmed these results in vitro using the yeast thioredoxin system.
Discussion: This study shows how consistent parameter sets for thioredoxin activity can be obtained regardless of the thioredoxin reductase concentration used in the insulin reduction assay, and validates computational systems biology modeling studies that have described the thioredoxin system with the redox couple modeling approach.
Introduction
The thioredoxin system consisting of NADP(H), thioredoxin, and the enzyme thioredoxin reductase is widely distributed in nature and plays a major role in intracellular redox regulation.Citation1 In this system, thioredoxin reductase, a member of a family of pyridine nucleotide-disulfide oxidoreductases, uses NADPH to reduce thioredoxin, which in turn reduces a wide array of protein and non-protein targets, forming a large redox-regulated network.Citation2,Citation3 This network connects key cellular processes including DNA synthesis, hydrogen peroxide metabolism, and sulfur assimilation,Citation4,Citation5 and perturbations in this network are associated with distinct physiological processes and are correlated with a number of pathologies.Citation1,Citation6–Citation8
While several assays for measuring thioredoxin activity have been developed using substrates such as 5,5ʹ-dithiobis(2-nitrobenzoic acid) (DTNB)Citation9,Citation10 or fluorescently labeled proteins,Citation11 insulin with a single intrachain and two interchain disulfide bondsCitation12 still remains the most popular substrate for characterising thioredoxin activity in vitro.Citation13 In this assay, insulin is reduced by thioredoxin and the reaction can be monitored turbidimetrically by following the aggregation of the free B-chainCitation14 or by coupling the reaction to NADPH oxidation (Scheme I).Citation13
Scheme I: Thioredoxin enzyme model.(1)
(2)
(3)
where TrxSS and TrxSH represent oxidized and reduced thioredoxin, respectively. Insulin (ox) and Insulin (red) represent oxidized and reduced insulin, respectively, and TR represents thioredoxin reductase.
Increases in the insulin concentration result in a classical substrate saturation profile and Michaelis–Menten parameters have consequently been assigned to thioredoxin.Citation13,Citation15–Citation19 Despite mammalian insulin not being the physiological substrate for all the thioredoxins characterised with this assay, it is readily reduced by most thioredoxins. This common substrate therefore allows for semi-quantitative kinetic comparisons between different thioredoxins. However, in many of these studies it was not always clear whether thioredoxin reduction or thioredoxin oxidation was the rate-limiting step in the assay (Scheme I). The activities of other redoxins (glutaredoxins and peroxiredoxins) have also been described using Michaelis–Menten kinetic parameters (see for example Refs. 20–22).
There have been a number of conflicting reports on the interpretation of the plots generated in these experiments.Citation23,Citation24 For example, unlike most enzymes, thioredoxin is inactivated by its substrate and requires thioredoxin reductase to regenerate it. Further, in the original description of the thioredoxin insulin assay, it appeared that varying concentrations of thioredoxin reductase in the assay led to changes in the observed turnover number for thioredoxin activity.Citation13 Moreover, in other studies, reduced and oxidized thioredoxin have been detected in vivo,Citation25,Citation26 suggesting that the thioredoxin redox couple's activity should be characterised by redox potentials and not enzyme kinetic parameters. For computational systems biology studies, in particular, these discrepancies posed a serious limitation as it was not clear whether thioredoxin should appear in the stoichiometric matrix or rate vector of the equation describing the kinetic model of the system.Citation27
Using a computational model, we suggested that these disparate observations could be reconciled by proposing that the saturation observed in the insulin assay was due to a limitation in the thioredoxin redox cycle.Citation23 As the insulin concentration was increased, thioredoxin oxidation increased and the activity of the thioredoxin reduction reaction correspondingly increased until it was limited by the availability of oxidized thioredoxin or by saturation of the thioredoxin reductase, or both. This in turn limited the reduced thioredoxin available for insulin reduction and the flux through the system saturated.Citation23 We further proposed that mass-action kinetics appeared to be sufficient to describe insulin reduction by thioredoxin. Substrate reduction by thioredoxin proceeds via the formation of a mixed-disulfide complex between the redoxin and its substrate.Citation28 Once formed, the breakdown of these redoxin–substrate complexes is highly favorable and therefore the intermediate steps involving the mixed-disulfide complex were not explicitly modeled but were instead combined into a single second-order rate constant.Citation23 The validity of this simplification was tested by fitting a computational model of the Escherichia coli thioredoxin system to a published in vitro dataset.Citation13 Collectively, these findings suggested that the kinetic parameters for thioredoxin should be obtained by fitting a kinetic model of the entire thioredoxin system (Scheme II) to a given substrate saturation dataset and that mass-action kinetics could adequately describe insulin reduction.
Scheme II: Thioredoxin redox couple model.(4)
(5) A number of systems biology studies have since used this approach to describe thioredoxin activity in large-scale kinetic models.Citation29–Citation31 However, LinCitation32 found a discrepancy between the model output and the insulin reduction profile obtained when using a minimal modelCitation23 of the yeast thioredoxin system (equation (Equation6
(6) )):
(6) In this minimal description of the entire thioredoxin system (Scheme II), the thioredoxin reductase reaction was described by mass-action kinetics with a second-order rate constant (k1), Trxtot refers to the total thioredoxin concentration and insulin reduction was also described by a second-order rate constant (k2). Note that equation (Equation6
(6) ) has the same form as the Michaelis–Menten equation with a Vmax described by k1·NADPH·Trxtot, an apparent kcat described by k1·NADPH and an apparent Km described by k1·NADPH/k2; therefore the ratio kcat/Km is equal to k2, the true rate constant for insulin reduction.Citation23
As thioredoxin reductase is fully saturated by NADPH in the insulin assay, the flux through the system is effectively zero-order with respect to the NADPH concentration and therefore equation (Equation6(6) ) has limited value for fitting datasets under these conditions. LinCitation32 nonetheless proposed that thioredoxin was indeed an enzyme whose activity could presumably be described with Michaelis–Menten parameters. Thus, it is not clear whether substrate saturation datasets from the thioredoxin insulin assay should be fitted with the Michaelis–Menten equation or whether they should be fitted with the entire thioredoxin system (Scheme II). In this study, we employed computational modeling and in vitro kinetic assays of the thioredoxin insulin system to determine which of these approaches should be used to characterise thioredoxin activity.
Materials and methods
Plasmids and chemicals
Clones harboring the plasmid pET28a expressing thioredoxin reductase were generously supplied by Miss M.M. Photolo.Citation33 Thermoscientific Taq DNA polymerase and the InsTAclone kit were obtained from Inqaba Biotech (Johannesburg, South Africa), the Qiagen Ni-NTA agarose matrix from Whitehead Scientific (Pty) Ltd (Cape Town, South Africa), and the New England Biolabs HindIII and NdeI restriction enzymes were obtained from The Scientific Group (Midrand, South Africa). Trichloroacetic acid (TCA), methoxypolyethylene glycol maleimide (PEG-maleimide Mn 5000), 4-(2-aminoethyl)benzenesulfonyl fluoride hydrochloride (AEBSF), and dithiothreitol (DTT) were obtained from Sigma (Capital Labs, Johannesburg, South Africa) and all other common chemicals were from Saarchem/Merck (Johannesburg, South Africa) and were of the highest purity available.
Kinetic modeling
Kinetic modeling experiments were carried out using the open source Python Simulator for Cellular Systems (PySCeS) modeling softwareCitation34 (http://pysces.sourceforge.net) as described previously.Citation23,Citation29 Detailed models were created to analyse the E. coli and Saccharomyces cerevisiae thioredoxin systems and were parameterised with realistic parameter sets (Table ) which were obtained from either primary literature sources, the BRENDA kinetic parameter databaseCitation35 (http://www.brenda-enzymes.info), or from our in vitro kinetic assays. In these models, thioredoxin reductase was modeled with a two-substrate Michaelis–Menten kinetic expression and insulin reduction was modeled with mass-action kinetics as described previously.Citation23 Kinetic models of the entire thioredoxin system or the Michaelis–Menten equation were fitted to in vitro datasets using non-linear least squares regression with the Levenberg–Marquardt algorithm as previously described.Citation23 The PySCeS and SBML versions of the kinetic models are available in the Supplementary information.
Table 1 Kinetic parameters and species concentrations used for building computational models of the E. coli and baker's yeast thioredoxin systems
Cloning, expression, and purification of thioredoxin and thioredoxin reductase
The TRX1 gene (Saccharomyces genome database (SGD) (http://www.yeastgenome.org), Gene ID 850732) was directly amplified from S. cerevisiae BY4743 genomic DNA using the primers AGCCATATGGTTACTCAATTCAAAACTGCC and ACGAAGCTTAAGCATTAGCAGCAATGGC (NdeI and HindIII restriction sites underlined), cloned into a pTZ57R/T vector (InsTAclone kit, Thermoscientific) and then subcloned into a pET28a expression vector. The nucleotide sequences of the TRX1 and TRR1 clones were confirmed by automated sequencing (Central Analytical Facility, Stellenbosch University). To purify these recombinant proteins, transformed E. coli (DE3) cells containing the appropriate plasmid were cultured in LB media with kanamycin (30 µg/ml) and protein expression was induced by IPTG (final concentration 0.5 mM) for 6 hours for thioredoxin expression or 1 hour for thioredoxin reductase expression. Cells were then harvested, resuspended in 10 volumes of extraction buffer (20 mM Tris–HCl (pH 7.5), 10 mM NaCl, 1 mM EDTA, 0.2 mM AEBSF, and 5 mM DTT), disrupted by sonication, and centrifuged (12 000 × g, 30 minutes, 4°C). The thioredoxin containing supernatants were heat-treated (75°C, 30 minutes) and clarified by centrifugation (12 000 × g, 30 minutes, 4°C). Thioredoxin and thioredoxin reductase were then purified by Ni-NTA affinity chromatography and protein purity was confirmed by SDS-PAGE while protein concentration was determined using the Bradford assay and the extinction coefficients for thioredoxin and thioredoxin reductase (10 095 and 49 320 M−1 cm−1, respectively). During the purification, thioredoxin activity was monitored using the insulin aggregation assay with DTT as a reducing agentCitation36 and thioredoxin reductase was assayed using a DTNB reduction assay.Citation37
Thioredoxin insulin reduction assay
A number of variations of coupled redoxin assays have been presented in the literature. In some assays, NADPH oxidation was monitored by a decrease in absorbance at 340 nm starting at a positive value,Citation38,Citation39 typically 0.9 for an NADPH concentration of 150 µM,Citation40 while in other assays, a decrease in absorbance from the blank was monitored.Citation41 To compare these methods, insulin reduction was undertaken at 25°C in a final volume of 1 ml in a 100 mM potassium phosphate (pH 7.0) buffer containing EDTA (2 mM), NADPH (0.15 or 0.4 mM), insulin (20–160 µM), thioredoxin (1.5 µM), and thioredoxin reductase (0.05 µM). NADPH oxidation was monitored at 340 nm in a UV-1800 Shimadzu Spectrophotometer and depending on the assay being tested, a sample without the addition of either NADPH or thioredoxin reductase was used as the reference cuvette. To determine the effect of thioredoxin reductase on the rate of insulin reduction, the assay was undertaken as described above with NADPH (0.4 mM), insulin (20–200 µM) and varying thioredoxin reductase concentrations (0.05–0.25 µM). Insulin reduction activity was defined as the concentration of NADPH oxidized per minute using a molar extinction coefficientCitation41 of 6200 M−1 cm−1. Absorbance measurements were taken for at least 5 minutes, although initial studies showed that the system remained in steady state well beyond this assay period during which no significant insulin precipitation occurred. All assays were undertaken in triplicate and the data obtained was plotted as a mean ± standard error.
Determination of the redox state of thioredoxin
The redox state of thioredoxin was determined using the method described by Hugo et al.Citation42 Briefly, the steady-state insulin reduction assay components were added directly into 100% (w/v) ice-cold TCA (100 µl) and incubated on ice for 30 minutes. The TCA-treated samples were then transferred to an Amicon® Ultra 2 ml centrifugal filter (10 000 NMWL) and centrifuged (7500 × g, 20 minutes, 4°C) to remove the insulin. As a control to ensure that no protein was lost during centrifugation, the eluate was assayed for thioredoxin and thioredoxin reductase activity and was also tested by SDS-PAGE. The remaining concentrate was transferred and centrifuged (22 065 × g, 40 minutes, 4°C). The resulting pellet was washed with ice-cold acetone (100 µl), dried at 37°C and resuspended in 50 µl alkylation buffer (3 mM PEG-maleimide, 50 mM Tris (pH 7.5), 10 mM EDTA (pH 8.0), and 0.1% (m/v) SDS). After a 45-minute incubation period at 45°C, the alkylated samples were mixed with an equal volume of 2× non-reducing sample buffer (125 mM Tris–HCl, 4% (m/v) SDS, 20% (v/v) glycerol, and 0.01% (m/v) bromophenol blue, pH 6.8), the samples boiled and then separated by electrophoresis on a 15% acrylamide Tris–Tricine gel, which was subsequently stained with Coomassie blue. All assays were undertaken in triplicate and representative gel images are shown below. As migration controls, reduced thioredoxin was obtained by incubating thioredoxin (1.5 µM) with DTT (1 mM) at 37°C for 1 hour, while purified thioredoxin served as the oxidized control. The control samples were processed for electrophoresis as described above, and as expected, the reduced form of thioredoxin migrated higher on these gels. The intensity ratio of the bands was determined with ImageJ (http://imagej.nih.gov/ij/) using the reduced control as the standard.
Results
Computational models with thioredoxin described either as an enzyme, or as a redox couple, have contrasting kinetic properties
To determine whether it really mattered if thioredoxin activity was described with Michaelis–Menten parameters or with mass-action kinetics, two distinct kinetic models in which thioredoxin acts as an enzyme (equation (Equation3(3) ), Scheme I) or as a redox couple (Scheme II) were both fitted to a previously published in vitro insulin reduction dataset.Citation13 As mammalian insulin contains three disulfide bonds and reduction was followed by NADPH oxidation, we also wanted to determine whether it made a difference to the fitting results if the insulin or the disulfide bond concentration was considered as the ‘substrate’ in these experiments. In addition, we used our computational models to highlight the key differences between the thioredoxin enzyme and redox couple fitting approaches.
Both the Michaelis–Menten equation and the redox couple model showed excellent fits (r2 ≥ 0.996) to the insulin saturation profile (Fig. A), suggesting that both models were apparently consistent with the dataset (Table ). As the redox couple model predicted that substrate saturation was due to a limitation in thioredoxin reductase activity, the effect of increasing the thioredoxin reductase concentration on the rates within the system was also tested. Increasing the thioredoxin reductase concentration increased the insulin reduction rate in the thioredoxin redox couple model (Fig. A), confirming that its activity was limiting in this system. Note that in our kinetic model, thioredoxin reductase was described with Michaelis–Menten kinetics, which would not be accurate at thioredoxin and thioredoxin reductase concentrations of 1.5 and 0.1 µM, respectively, as the thioredoxin concentration was only 15-fold larger than the thioredoxin reductase concentration. Nonetheless, the fitted second-order rate constant obtained over a range of thioredoxin reductase concentrations showed very little variation (Table ), suggesting that this method is robust in obtaining kinetic parameters.
Figure 1 The Michaelis–Menten equation and the thioredoxin redox couple model both fit an in vitro insulin reduction datasetCitation13 but the resulting kinetic models show distinct responses to thioredoxin reductase concentration and substrate saturation. In (A) the Michaelis–Menten equation and the thioredoxin redox couple kinetic model (black line) both showed excellent fits (r2 ≥ 0.996) to an insulin substrate saturation dataset (•). Increasing the thioredoxin reductase concentration (0.05 µM) in the thioredoxin redox couple model to 0.15 (blue) or 0.25 µM (green) increased the flux within the system at a given insulin concentration. Substrate saturation (black) within a fitted thioredoxin redox couple model (0.05 µM TR) was accompanied by the redistribution of thioredoxin from its reduced (blue) to oxidized (red) form (B). In (C) disulfide bond rather than insulin concentration was used to determine the kinetic parameters for thioredoxin-dependent insulin reduction.
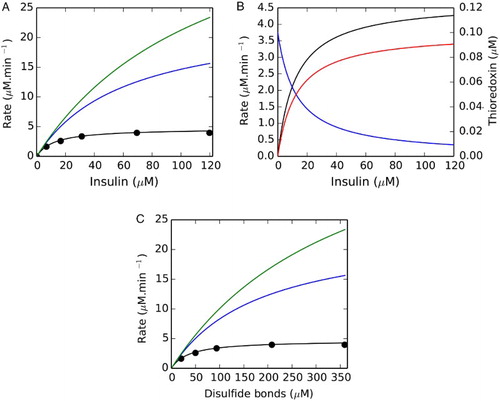
Table 2 The Michaelis–Menten parameters and second-order rate constants (k2) for insulin reduction from computational modeling of the E. coli thioredoxin system at varying thioredoxin reductase concentrations
In contrast, the apparent Michaelis–Menten parameters of the system varied significantly at different thioredoxin reductase concentrations, although the kcat/Km compared favorably to the second-order rate constant obtained by fitting the redox couple model (Table , cf. equation (Equation6(6) )). Thus, if correct, the redox couple model (Scheme II) predicted that the apparent Michaelis–Menten parameters for the system would vary depending on the thioredoxin reductase concentration used in the experiment, while fitting of the entire system should yield a consistent second-order rate constant over a range of thioredoxin reductase concentrations. Conversely, if thioredoxin was indeed limiting in the system and responsible for the substrate saturation profile, increasing thioredoxin reductase should have negligible effects on the insulin reduction rate and the Michaelis–Menten parameters obtained.Citation13 An additional distinguishing prediction made by these simulations was that substrate saturation in the redox couple model was accompanied by the progressive redistribution of the thioredoxin moiety into its oxidized form (Fig. B). In contrast, if thioredoxin was described as an enzyme, there should be no net change in the steady-state redox state of thioredoxin (equation (Equation3
(3) ), Scheme I).
Models using the disulfide bond concentration as the ‘substrate’ were also developed and analysed (Fig. C) to determine if it made a difference to the kinetic rate parameters obtained in our fitting experiments. Not surprisingly, we found that the mass-action rate constants (k2) obtained for the disulfide bond reduction were lower than the rate constants for insulin reduction but again showed a good correlation with the kcat/Km values obtained when using this substrate (Table S1). A limitation with such an analysis is that it assumed that all three disulfide bonds in insulin were equally accessible. However, data from insulin aggregation studies have shown that the porcine insulin intrachain A6–A11 and interchain A7–B7 disulfide bonds were more accessible to reduction than the buried A20–B19 disulfide bond.Citation12 Thus, the second-order rate constant obtained from this analysis and indeed the analysis with insulin as the substrate (above) describes a complex set of reduction events within a single aggregated parameter. As a final control, we modified the redox couple model to determine if another rate expression could be used for the insulin reduction reaction (equation (Equation5(5) )) in these fitting experiments. This reaction was therefore described with reversible mass-action, Hill and Michaelis–Menten kinetics, but we obtained appreciably poorer fits of the data (data not shown), suggesting that irreversible mass-action kinetics were apparently sufficient to describe the reduction of insulin for the concentrations of thioredoxin reductase tested. As these computational modeling observations could be directly tested in vitro, the thioredoxin system was isolated from S. cerevisiae and analysed using the insulin reduction assay.
Purification and assay of the yeast thioredoxin system
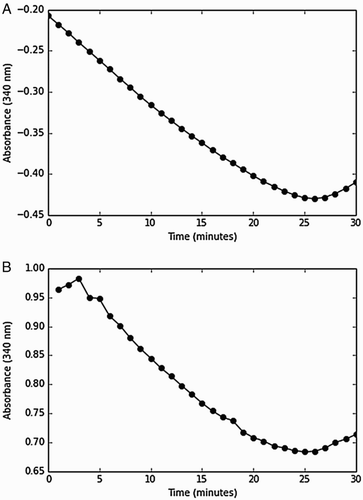
Thioredoxin and thioredoxin reductase from S. cerevisiae were cloned, expressed, and purified using standard molecular biology techniques (Fig. ). To ensure that both proteins were completely active, thioredoxin was assayed using the DTT-dependent reduction of insulin,Citation14 while thioredoxin reductase was assayed using the DTNB reduction assay.Citation37 The insulin reduction assay with the oxidation of NADPH was used to determine the kinetic parameters for the reaction schemes (I and II). Two variations of the coupling assay to NADPH have been presented in the literature, where NADPH oxidation was monitored by a decrease in absorbance at 340 nm starting at a positive absorbance valueCitation38,Citation39 or by a decrease in absorbance from the blank.Citation41 We compared both these methods (Fig. ) and found no differences in the rates obtained over a range of NADPH concentrations (0.15–0.4 mM), but chose to use the former assay as, in our hands, it appeared less noisy over the range of insulin concentrations tested in our experiments.
Figure 2 Ni-NTA affinity purification of recombinant thioredoxin (A) and thioredoxin reductase (B) (details in text).
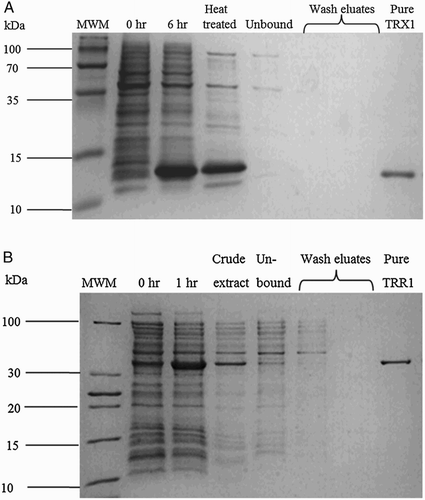
Figure 3 Similar rates were obtained when the thioredoxin insulin assay was initiated with thioredoxin reductase or NAPDH. Insulin reduction by the thioredoxin system was initiated with either thioredoxin reductase (A) or NADPH (B) and a decrease in absorbance was monitored over negative and positive scales, respectively. The assay contained insulin (80 µM), thioredoxin reductase (0.05 µM), thioredoxin (1.5 µM), and NADPH (150 µM) and was performed in duplicate.
Thioredoxin reductase activity is limiting in the insulin reduction assay
According to the thioredoxin redox couple model, increases in the thioredoxin reductase concentration should increase the flux through the system (Fig. A). To test this prediction, the rate of NADPH oxidation was measured at varying concentrations of insulin (20–200 µM) and yeast thioredoxin reductase (0.05–0.25 µM). As the concentration of thioredoxin reductase was increased, there was a corresponding increase in the flux through the system (Fig. ) supporting the thioredoxin redox couple model (Scheme II) and showing that the saturation observed in this assay was due to an apparent limitation in thioredoxin reductase activity.
Figure 4 Changing the thioredoxin reductase concentration altered the kinetic profile and parameters obtained with the yeast thioredoxin insulin reduction assay. The flux obtained for a given insulin concentration increased as the thioredoxin reductase concentration was increased over the range 0.05 (•), 0.15 (▪), and 0.25 µM (♦). The Michaelis–Menten equation and the redox couple model were both fitted to these datasets using either insulin concentration (A) or the disulfide bond concentration (B). All assays were performed in triplicate with standard errors shown.
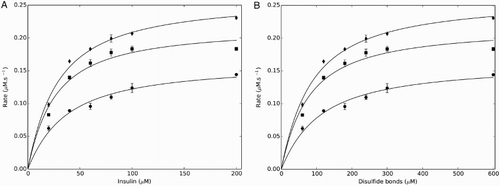
The computational modeling also predicted that changes in the thioredoxin reductase concentration would cause changes in the Michaelis–Menten parameters if its activity was limiting in the assay (Table ). We therefore determined the effect of changing the thioredoxin reductase concentration on the Michaelis–Menten parameters (Scheme I) and on the second-order rate constant for insulin reduction obtained by fitting the entire thioredoxin system to the saturation datasets (Scheme II). While the Km values remained relatively constant, changes in the thioredoxin reductase concentration resulted in changes to the apparent kcat values, which was also noted in a previous study.Citation13 In contrast, the second-order rate constant for insulin reduction (k2, obtained by fitting the complete system) remained relatively constant and, as expected (Table ), showed a good correlation with the kcat/Km Michaelis–Menten parameters (Table ). Fitting experiments performed with the disulfide bond concentrations rather than the insulin concentrations also resulted in different Michaelis–Menten and second-order rate constant parameter values. As with the computational modeling studies, there was a good correlation between the k2 and the kcat/Km values obtained (Table S1). We were, however, unable to obtain a satisfactory global fit of all the experimental data, suggesting that our kinetic model could not completely describe the complex set of reduction and aggregation events associated with insulin reduction.Citation12,Citation43
Table 3 The Michaelis–Menten parameters and second-order rate constants (k2) for insulin reduction by the baker's yeast thioredoxin system at varying thioredoxin reductase concentrations
Saturation of the redox cycle and redistribution of the thioredoxin moiety
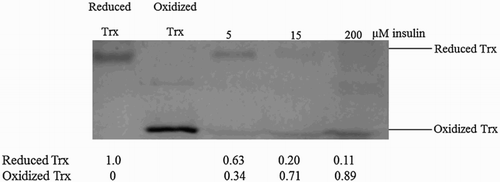
Over the complete range of thioredoxin reductase concentrations tested, increases in the insulin concentration resulted in observed substrate saturation. According to the redox couple model,Citation23 this would be due to the saturation of the thioredoxin redox cycle as thioredoxin reductase activity became limiting and the thioredoxin moiety distributed into its oxidized form (Fig. B). To experimentally verify whether there was indeed a redistribution of the oxidized and reduced forms of the thioredoxin moiety, the thioredoxin redox state was preserved by rapidly treating the steady-state insulin reduction reactions with TCA and alkylating the extracts with PEG-maleimide.Citation44 Increases in the insulin concentration resulted in the progressive redistribution of the thioredoxin moiety into its oxidized form (Fig. ), which was consistent with our computational model (Fig. B). We observed a similar redistribution of thioredoxin into its oxidized form at other thioredoxin reductase (0.15–0.25 µM) and equivalent insulin concentrations (5–200 µM) (data not shown).
Figure 5 Substrate saturation is associated with redistribution of the thioredoxin moiety into its oxidized form in the insulin reduction assay. Reduced thioredoxin in the insulin reduction assay was alkylated with PEG-maleimide. As migration controls, reduced thioredoxin was obtained by incubating thioredoxin (1.5 µM) with DTT (1 mM), while purified thioredoxin served as the oxidized control. The experiment was performed in triplicate over a range of thioredoxin reductase concentrations (0.05–0.25 µM) and a representative gel image is shown here.
Discussion
The insulin reduction assay is one of the most commonly used methods to determine thioredoxin activity in vitro, but the classical substrate saturation profile generated with increasing insulin concentrations has usually been fitted to the Michaelis–Menten equation (Scheme I),Citation13,Citation15–Citation19 although we recently proposed that these datasets should be fitted to a model of the entire system of reactions (i.e. the redox couple model approach, cf. Scheme II).Citation23 To distinguish between these approaches, we used a computational model of an E. coli thioredoxin system which yielded three key predictions. If the redox couple model fitting approach was correct, (a) the second-order rate constant for insulin reduction (k2) would remain constant but the apparent Michaelis–Menten parameters would change at varying thioredoxin reductase concentrations (Table ), (b) thioredoxin reductase activity would be limiting in the system (Fig. A), and (c) the thioredoxin moiety would redistribute into its oxidized form with increasing substrate concentration (Fig. B). On the other hand, if fitting with the Michaelis–Menten equation (Scheme I) was correct, the thioredoxin reductase concentration would have a negligible effect on the rate and Michaelis–Menten parameters for insulin reduction, and thioredoxin should remain in its reduced, active enzymatic form with increasing substrate concentration.
To test the predictions in vitro we used the classical insulin reduction assay for thioredoxin activity.Citation13 Our data showed that increasing the thioredoxin reductase concentration resulted in an increased flux through the system (Fig. ) and also caused a significant change to the kcat values while the second-order rate constant for insulin reduction (k2) obtained from fitting the redox couple model remained relatively constant over a range of thioredoxin reductase concentrations (Table 3). Further, using an alkylation assay, the steady-state oxidation of the thioredoxin moiety was observed with increasing insulin concentrations (Fig. ). Collectively, the data obtained from the in vitro analysis support the redox couple model for saturation in the thioredoxin system and suggest that fitting experiments on insulin reduction assay datasets should use models of the entire system of reactions under study. A potential limitation of our combined experimental and modeling approach is that it might be possible that other kinetic models may also fit these datasets. We therefore tested a number of other rate expressions for insulin reduction (equation (Equation5(5) ), Scheme II), but these fitting experiments were unsuccessful. Irreversible mass-action kinetics for thioredoxin-dependent insulin reduction appeared to be sufficient to describe the data for each concentration of thioredoxin reductase used in our experiments. While several studies have shown that fitting of other redoxin systems to substrate saturation datasets does indeed yield consistent and reproducible parameter sets,Citation24,Citation31 we were unable to obtain a satisfactory global fit with all our datasets. This result suggests that the differences in the kinetic profiles obtained for different thioredoxin reductase concentrations could not be completely explained by our computational models, which was not surprising given the complex reduction and aggregation kinetics of insulin.Citation12,Citation43
The results presented here make two important contributions to our understanding of redoxin kinetics and analysis. First, we should now be able to obtain consistent second-order rate constants for thioredoxin-dependent insulin reduction regardless of the thioredoxin reductase concentration used in the assay. We did note a good correlation between the kcat/Km values and the second-order rate constant obtained by direct fitting of the entire system (Tables and ). Thus, specifically the kcat/Km values (but not all the Michaelis–Menten parameters in general) reported for thioredoxin in previous studies (see for exampleCitation13,Citation32) could still be used in modeling thioredoxin-dependent networks or in the kinetic analysis of related reactions such as peroxiredoxin reduction. A second contribution from our work is that this study provides the first experimental support for the computational and theoretical modeling studies that have already used the redox couple approach to develop the kinetic models of the thioredoxin system in the Jurkat-T,Citation30 E. coli,Citation29 and red blood cells.Citation31 This work therefore serves as a reference point for the further adoption of systems biology approaches in the study of thioredoxin and other redoxin systems.
Disclaimer statements
Contributors LP and CSP performed the modeling analysis. LP performed the experimental work and drafted the paper while CSP edited the paper.
Funding This work is based on the research supported in part by the National Research Foundation (NRF) of South Africa. Any opinion, finding and conclusion or recommendation expressed in this material is that of the author(s) and the NRF does not accept any liability in this regard. LP is a recipient of an NRF Scarce Skills Scholarship.
Conflicts of interest The authors declare no conflict of interest.
Ethics approval Ethical approval was not required for this study.
Supplementary material
Supplementary material for this article can be found at: www.maneyonline.com/doi/suppl/10.1179/1351000215Y.0000000024.
supplementary_information.docx
Download MS Word (21.5 KB)Acknowledgments
The authors wish to thank Professor Johann M. Rohwer (Stellenbosch University) for generously providing the modeling scripts used in this study and for critical comments on the revised manuscript.
Related Research Data
References
- Lillig CH, Holmgren A. Thioredoxin and related molecules – from biology to health and disease. Antioxid Redox Signal 2007;9(1):25–47. doi: 10.1089/ars.2007.9.25
- Jones DP, Go Y-M. Mapping the cysteine proteome: analysis of redox-sensing thiols. Curr Opin Chem Biol 2011;15(1):103–12. doi: 10.1016/j.cbpa.2010.12.014
- Collet J-F, Messens J. Structure, function, and mechanism of thioredoxin proteins. Antioxid Redox Signal 2010;13(8):1205–16. doi: 10.1089/ars.2010.3114
- Arnér ESJ, Holmgren A. Physiological functions of thioredoxin and thioredoxin reductase. Eur J Biochem 2000;267(20):6102–9. doi: 10.1046/j.1432-1327.2000.01701.x
- Toledano MB, Kumar C, Le Moan N, Spector D, Tacnet F. The system biology of thiol redox system in Escherichia coli and yeast: differential functions in oxidative stress, iron metabolism and DNA synthesis. FEBS Lett 2007;581(19):3598–607. doi: 10.1016/j.febslet.2007.07.002
- Burke-Gaffney A, Callister MEJ, Nakamura H. Thioredoxin: friend or foe in human disease? Trends Pharmacol Sci 2005;26(8):398–404. doi: 10.1016/j.tips.2005.06.005
- Arner ES, Holmgren A. The thioredoxin system in cancer – introduction to a thematic volume of Seminars in Cancer Biology. Semin Cancer Biol 2006;16:419. doi: 10.1016/j.semcancer.2006.10.001
- Holmgren A, Lu J. Thioredoxin and thioredoxin reductase: current research with special reference to human disease. Biochem Biophys Res Commun 2010;396(1):120–4. doi: 10.1016/j.bbrc.2010.03.083
- Akif M, Khare G, Tyagi AK, Mande SC, Sardesai AA. Functional studies of multiple thioredoxins from Mycobacterium tuberculosis. J Bacteriol 2008;190(21):7087–95. doi: 10.1128/JB.00159-08
- Mark DF, Richardson CC. Escherichia coli thioredoxin: a subunit of bacteriophage T7 DNA polymerase. Proc Natl Acad Sci USA 1976;73(3):780–4. doi: 10.1073/pnas.73.3.780
- Heuck AP, Wolosiuk RA. Fluoresceinthiocarbamyl-insulin: a potential analytical tool for the assay of disulfide bond reduction. J Biochem Biophys Methods 1997;34:213–25. doi: 10.1016/S0165-022X(97)00014-6
- Li Y, Gong H, Sun Y, Yan J, Cheng B, Zhang X, et al.. Dissecting the role of disulfide bonds on the amyloid formation of insulin. Biochem Biophys Res Commun 2012;423:373–8. doi: 10.1016/j.bbrc.2012.05.133
- Holmgren A. Reduction of disulfides by thioredoxin. Exceptional reactivity of insulin and suggested functions of thioredoxin in mechanism of hormone action. J Biol Chem 1979;254(18):9113–9.
- Holmgren A. Thioredoxin catalyzes the reduction of insulin disulfides by dithiothreitol and dihydrolipoamide. J Biol Chem 1979;254(19):9627–32.
- Obiero J, Pittet V, Bonderoff SA, Sanders DAR. Thioredoxin system from Deinococcus radiodurans. J Bacteriol 2010;192(2):494–501. doi: 10.1128/JB.01046-09
- Maeda K, Hägglund P, Björnberg O, Winther JR, Svensson V. Kinetic and thermodynamic properties of two barley thioredoxin h isozymes, HvTrxh1 and HvTrxh2. FEBS Lett 2010;584:3376–80. doi: 10.1016/j.febslet.2010.06.028
- Bao R, Zhang Y, Zhou C-Z, Chen Y. Structural and mechanistic analyses of yeast mitochondrial thioredoxin Trx3 reveal putative function of its additional cysteine residues. Biochim Biophys Acta 2009;1794(4):716–21. doi: 10.1016/j.bbapap.2008.12.016
- Chen Y-T, Hong P-F, Wen L, Lin C-T. Molecular cloning and characterization of a thioredoxin from Taiwanofungus camphorata. Bot Stud 2014;55(1):1–8. doi: 10.1186/1999-3110-55-1
- Juttner J, Olde D, Langridge P, Baumann U. Cloning and expression of a distinct subclass of plant thioredoxins. Eur J Biochem 2000;267(24):7109–17. doi: 10.1046/j.1432-1327.2000.01811.x
- Akerman SE, Müller S. 2-Cys peroxiredoxin PfTrx-Px1 is involved in the antioxidant defence of Plasmodium falciparum. Mol Biochem Parasitol 2003;130(2):75–81. doi: 10.1016/S0166-6851(03)00161-0
- Akerman SE, Müller S. Peroxiredoxin-linked detoxification of hydroperoxides in Toxoplasma gondii. J Biol Chem 2005;280(1):564–70. doi: 10.1074/jbc.M406367200
- Peltoniemi MJ, Karala A-R, Jurvansuu JK, Kinnula VL, Ruddock LW. Insights into deglutathionylation reactions: different intermediates in the glutaredoxin and protein disulfide isomerase catalyzed reactions are defined by the γ-linkage present in glutathione. J Biol Chem 2006;281(44):33107–14. doi: 10.1074/jbc.M605602200
- Pillay CS, Hofmeyr J-HS, Olivier BG, Snoep JL, Rohwer JM. Enzymes or redox couples? The kinetics of thioredoxin and glutaredoxin reactions in a systems biology context. Biochem J 2009;417:269–75. doi: 10.1042/BJ20080690
- Mashamaite LN, Rohwer JM, Pillay CS. The glutaredoxin mono- and di-thiol mechanisms for deglutathionylation are functionally equivalent: implications for redox systems biology. Biosci Rep 2015;35(1):e00173. doi: 10.1042/BSR20140157
- Trotter EW, Grant CM. Non-reciprocal regulation of the redox state of the glutathione-glutaredoxin and thioredoxin systems. EMBO Rep 2003;4:184–8. doi: 10.1038/sj.embor.embor729
- Watson WH, Yang X, Choi YE, Jones DP, Kehrer JP. Thioredoxin and its role in toxicology. Toxicol Sci 2004;78(1):3–14. doi: 10.1093/toxsci/kfh050
- Pillay CS, Hofmeyr J-HS, Mashamaite LN, Rohwer JM. From top-down to bottom-up: computational modeling approaches for cellular redoxin networks. Antioxid Redox Signal 2013;18(16):2075–86. doi: 10.1089/ars.2012.4771
- Wynn R, Cocco MJ, Richards FM. Mixed disulfide intermediates during the reduction of disulfides by Escherichia coli thioredoxin. Biochemistry 1995;34(37):11807–13. doi: 10.1021/bi00037a019
- Pillay CS, Hofmeyr J-HS, Rohwer JM. The logic of kinetic regulation in the thioredoxin system. BMC Syst Biol 2011;5(1):15. doi: 10.1186/1752-0509-5-15
- Adimora NJ, Jones DP, Kemp ML. A model of redox kinetics implicates the thiol proteome in cellular hydrogen peroxide responses. Antioxid Redox Signal 2010;13(6):731–43. doi: 10.1089/ars.2009.2968
- Benfeitas R, Selvaggio G, Antunes F, Coelho PMBM, Salvador A. Hydrogen peroxide metabolism and sensing in human erythrocytes: a validated kinetic model and reappraisal of the role of peroxiredoxin II. Free Radic Biol Med 2014;74(0):35–49. doi: 10.1016/j.freeradbiomed.2014.06.007
- Lin T-Y. Protein–protein interaction as a powering source of oxidoreductive reactivity. Mol Biosyst 2010;6:1454–62. doi: 10.1039/b927132e
- Photolo MM, Pillay CS. The dynamics of thioredoxin-dependent reactions [ MSc thesis]. Pietermaritzburg: University of KwaZulu-Natal; 2014.
- Olivier BG, Rohwer JM, Hofmeyr J-HS. Modelling cellular systems with PySCeS. Bioinformatics 2005;21:560–1. doi: 10.1093/bioinformatics/bti046
- Chang A, Scheer M, Grote A, Schomburg I, Schomburg D. BRENDA, AMENDA and FRENDA the enzyme information system: new content and tools in 2009. Nucleic Acids Res 2009;37(Suppl. 1):D588–92. doi: 10.1093/nar/gkn820
- Sigma-Aldrich. Suitability assay of thioredoxin. 1994; Available from: http://www.sigmaaldrich.com/etc/medialib/docs/Sigma/Enzyme_Assay/thioredoxinsuit.Par.0001.File.tmp/thioredoxinsuit.pdf.
- Lim HW, Lim C-J. Direct reduction of DTNB by E. coli thioredoxin reductase. J Biochem Mol Biol 1995;28(1):17–20.
- Baker LMS, Raudonikiene A, Hoffman PS, Poole LB. Essential thioredoxin-dependent peroxiredoxin system from Helicobacter pylori: genetic and kinetic characterization. J Bacteriol 2001;183(6):1961–73. doi: 10.1128/JB.183.6.1961-1973.2001
- Si M-R, Zhang L, Yang Z-F, Xu Y-X, Liu Y-B, Jiang C-Y, et al.. NrdH redoxin enhances resistance to multiple oxidative stresses by acting as a peroxidase cofactor in Corynebacterium glutamicum. Appl Environ Microbiol 2014;80(5):1750–62. doi: 10.1128/AEM.03654-13
- Nelson KJ, Parsonage D. Measurement of peroxiredoxin activity. Curr Protoc Toxicol 2011;0(7): Unit 7.10. 7.10.1–7.10.33.
- Arnér ESJ, Holmgren A. Measurement of thioredoxin and thioredoxin reductase. Curr Protoc Toxicol 2000;7:Unit 7.4. 7.4.1–7.4.14.
- Hugo M, Van Laer K, Reyes AM, Vertommen D, Messens J, Radi R, et al.. Mycothiol/mycoredoxin 1-dependent reduction of the peroxiredoxin AhpE from Mycobacterium tuberculosis. J Biol Chem 2014;289(8):5228–39. doi: 10.1074/jbc.M113.510248
- Zako T, Sakono M, Hashimoto N, Ihara M, Maeda M. Bovine insulin filaments induced by reducing disulfide bonds show a different morphology, secondary structure, and cell toxicity from intact insulin amyloid fibrils. Biophys J 2009;(96):3331–40. doi: 10.1016/j.bpj.2008.12.3957
- Hansen RE, Winther JR. An introduction to methods for analyzing thiols and disulfides: reactions, reagents, and practical considerations. Anal Biochem 2009;394(2):147–58. doi: 10.1016/j.ab.2009.07.051
- Gleason FK, Lim CJ, Gerami-Nejad M, Fuchs JA. Characterization of Escherichia coli thioredoxins with altered active site residues. Biochemistry 1990;29(15):3701–9. doi: 10.1021/bi00467a016
- Williams Jr CH. Flavin-containing dehydrogenases. New York: Academic Press; 1976.
- Speranza ML, Ronchi S, Minchiotti L. Purification and characterization of yeast thioredoxin reductase. Biochim Biophys Acta 1973;327(2):274–81. doi: 10.1016/0005-2744(73)90410-5