
Abstract
Objectives and methods: Compared to age-matched healthy controls (n = 55), patients with amyotrophic lateral sclerosis (ALS) (n = 26) showed increased oxidative stress as indicated by a significantly increased percentage of oxidized coenzyme Q10 (%CoQ10) in total plasma coenzyme Q10, a significantly decreased level of plasma uric acid, and a significantly decreased percentage of polyunsaturated fatty acids in total plasma free fatty acids (FFA). Therefore, the efficacy of edaravone, a radical scavenger, in these ALS patients was examined.
Results and discussion: Among 26 ALS patients, 17 received edaravone (30 mg/day, one to four times a week) for at least 3 months, and 13 continued for 6 months. Changes in revised ALS functional rating scale (ALSFRS-R) were significantly smaller in these patients than in edaravone-untreated ALS patients (n = 19). Edaravone administration significantly reduced excursions of more than one standard deviation from the mean for plasma FFA levels and the contents of palmitoleic and oleic acids, plasma markers of tissue oxidative damage, in the satisfactory progress group (ΔALSFRS-R ≥ 0) as compared to the ingravescent group (ΔALSFRS-R < −5). Edaravone treatment increased plasma uric acid, suggesting that it is an effective scavenger of peroxynitrite. However, edaravone administration did not decrease %CoQ10. Therefore, combined treatment with agents such as coenzyme Q10 may further reduce oxidative stress in ALS patients.
Introduction
Amyotrophic lateral sclerosis (ALS) is characterized by muscular atrophy and reduced muscle strength, and it is an adult-onset neurodegenerative disease that causes selective degeneration of upper and lower motor neurons.Citation1 Disease progression is usually rapid and respiratory disturbance results in death within 20–48 months.Citation2 Despite extensive research, the cause of the disease is unknown and no effective treatment is available.Citation3 Although familial ALS is known, sporadic ALS accounts for the majority of ALS cases. Beal et al.Citation4 reported an increase in 3-nitrotyrosine and 8-hydroxyguanineCitation5 in the spinal cord of both sporadic and familial ALS patients. 3-Nitrotyrosine is formed by peroxynitrite-mediated nitration of tyrosineCitation6 and 8-hydroxyguanine is generated from guanine by oxidants such as hydroxyl radical. An increase of 3-nitrotyrosine was confirmed in the cerebrospinal fluid (CSF) of patients with sporadic ALS.Citation7 We have also reported an increase of oxidative stress in patients with sporadic ALS, based on measurements of the redox balance of plasma coenzyme Q10.Citation8
These observations prompted us to evaluate the efficacy of edaravone, a free radical scavenger,Citation9 in patients with ALS. Edaravone has been shown to inhibit lipid peroxidation as efficiently as well-known antioxidants such as vitamin E (VE) and ascorbic acid (VC).Citation10 In April 2001, the Japanese Ministry of Health, Labor, and Welfare approved intravenous infusion of 30 mg edaravone twice a day for a maximum of 14 days in patients with acute brain infarction within 24 hours after onset, and edaravone is now widely used in Japan. Therefore, it is considered to be safe.
We have demonstrated that edaravone (60 mg) administration five to six times a week for 6 months significantly reduced both the decline of the revised ALS functional rating scale (ALSFRS-R) and 3-nitrotyrosine levels in CSF of treated patients.Citation11 In this study, we evaluated oxidative stress in ALS patients by measuring the redox balance of plasma coenzyme Q10, plasma uric acid (UA being the predominant endogenous scavenger of peroxynitriteCitation6), and tissue oxidative damage markers such as the percentage of polyunsaturated fatty acids (PUFA) in the total plasma free fatty acids (FFA). We also evaluated the effect of edaravone administration on these markers.
Subjects and methods
Study design
The present study was carried out at the Yoshino Neurology Clinic during the period from 26 October 2011 to 31 May 2014. The study protocols were approved by the Ethical Committee of Tokyo University of Technology, and samples from patients were obtained in accordance with the Helsinki Declaration of 1964, as revised in 2001. Twenty-six subjects (14 males aged 61.5 ± 12.4 years (mean ± SD) and 12 females aged 60.2 ± 16.5 years) were enrolled after they had given informed consent to participate in the study. The inclusion criterion was a diagnosis of sporadic or familial ALS. Exclusion criteria were compromised respiratory function that includes tracheotomy, artificial respiration, or dyspnea. Additional exclusion criteria were complications such as advanced cancer, severe cardiac insufficiency, and age of less than 20 years. Edaravone (30 mg) dissolved in 100 ml of saline was administered via an intravenous drip one to four times a week; among the 26 patients, 17 received edaravone administration for at least 3 months and 13 continued treatment for 6 months. Heparinized blood was collected before and after edaravone administration at week 0, week 1, month 1, month 3, and month 6; the collected plasma samples were stored at −30°C until analysis. ALSFRS-R scores were also measured before edaravone administration at week 0, week 1, month 1, month 3, and month 6.
Analytical procedures
Plasma levels of VE, ubiquinol-10, ubiquinone-10, free cholesterol (FC), and cholesterol esters (CE) were determined as previously describedCitation12 with some modifications. In brief, plasma was extracted with 19 volumes of 2-propanol and the extract was analyzed by HPLC using an analytical column (Supelcosil LC-8, 5 µm, 25 cm × 4.6 mm i.d.; Supelco Japan, Tokyo), a reduction column (RC-10-1; Irica, Kyoto, Japan), and an amperometric electrochemical detector (Model Σ985; Irica) with an oxidation potential of +600 mV (versus Ag/AgCl) on a glassy carbon electrode. The mobile phase consisted of 50 mM sodium perchlorate in methanol/2-propanol (9:1, v/v), delivered at a flow rate of 0.8 ml/min.
Plasma levels of VC, UA, and unconjugated bilirubin (BR) were determined by HPLC on a bonded-phase aminopropylsilyl column (Supelcosil LC-NH2, 5 µm, 25 cm × 4.6 mm i.d.; Supelco Japan) with UV–Vis detection (265 nm for 0–15 minutes and 460 nm for 15–22 minutes) as described previously.Citation13
Plasma FFA were derivatized with monodansylcadaverine for analysis by HPLC.Citation14 Briefly, plasma samples (50 µl) were mixed with 200 µl of methanol containing 25 µM margaric acid (internal standard) and then centrifuged at 13 000 × g for 5 minutes. Aliquots (50 µl) of supernatants were dried under a stream of nitrogen gas, and the residue was admixed with diethyl phosphorocyanidate (1 µl) and N,N-dimethylformamide (50 µl) containing monodansylcadaverine (2 mg/ml) and kept at room temperature in the dark for 20 minutes. A 5-µl sample was injected onto an octadecylsilyl column (3 µm, 3.3 cm × 4.6 mm i.d.; Supelco Japan) and a pKb-100 column (5 µm, 25 cm × 4.6 mm i.d.; Supelco Japan) connected in tandem. The FFA components were measured by fluorescence detection (Model 821-FP; Japan Spectroscopic, Tokyo, Japan) with excitation at 320 nm and emission at 520 nm. The mobile phase consisted of acetonitrile/methanol/water (17.5:65.0:17.5, v/v/v) delivered at a flow rate of 1.5 ml/min. The analytical columns were heated to 40°C.
Statistical analysis
Data presented are mean values and standard deviations unless otherwise specified. The statistical significance of differences was evaluated with Student's t-test. To assess the time course of efficacy of edaravone administration, post-treatment data were assessed using repeated-measures analysis of variance (ANOVA). Group differences were analyzed by means of Fisher's exact probability test. P < 0.05 was considered statistically significant.
Results and discussion
Oxidative stress in ALS patients
Oxidative stress markers such as 3-nitrotyrosine,Citation4,Citation7,Citation11 8-hydroxyguanine,Citation5 and protein carbonylCitation5 are typically increased in ALS patients. Here, we examined a range of markers of circulatory oxidative stress and tissue oxidative damage in 26 patients with ALS as compared to those of 55 age-matched healthy controls,Citation8,Citation15,Citation16 as shown in Table . There were no significant differences in the plasma antioxidants, VC, VE, and total coenzyme Q10 (TQ10) between the two groups. However, a significant decrease was observed in UA, a peroxynitrite scavenger, and this is consistent with increased CSF levels of 3-nitrotyrosine observed in patients with ALS.Citation4,Citation7,Citation11 A significant decrease in plasma UA was also previously reported in ALS patients.Citation17 There was also a significant decrease in plasma BR, which is an important physiological antioxidant.Citation18 Strikingly, we found that the ratio of the oxidized form of coenzyme Q10 (%CoQ10) to TQ10 was significantly increased, corroborating an increased level of oxidative stress in patients with ALS.
Table 1 Levels of plasma antioxidants and lipids in patients with ALS as compared to age-matched healthy controls (average ± SD)
Plasma level and composition of FFA are good markers of tissue oxidative damage, since PUFA such as linoleic acid (18:2), linolenic acid (18:3), arachidonic acid (20:4), and docosahexaenoic acid (22:6) are highly susceptible to cellular oxidation. The oxidative loss of PUFA reduces membrane fluidity, but this can be compensated by the conversion of stearic acid (18:0) to oleic acid (18:1) or of palmitic acid (16:0) to palmitoleic acid (16:1) by stearoyl-CoA desaturase.Citation19 Acceleration of oxidative stress causes hydrolysis of tissue and membrane lipids to FFA, which enter the blood stream. Under condition of oxidative stress, a lower percentage of PUFA to total FFA (%PUFA) and/or higher percentages of 18:1 and 16:1 to total FFA (%18:1 and %16:1, respectively) would be expected. Indeed, such modifications have been observed in patients with adult respiratory distress syndrome,Citation20 multiple sclerosis,Citation21 Papillon–Lefevre syndrome,Citation22 and juvenile fibromyalgia,Citation23 and in newborn babies.Citation24 We recently observed elevation of plasma FFA, %16:1, and %18:1 in rats after a 2-hour occlusion–reperfusion of the middle cerebral artery, and we showed that these changes were attenuated by administration of edaravone.Citation25
Although plasma levels of FFA, %16:1, and %18:1 were the same in ALS patients as in healthy controls, a significant decrease in %PUFA was observed in the patients, suggesting an increased level of tissue oxidative damage (Table ). ALS patients also showed small but significant increases in FC and the FC/CE ratio, suggesting some impairment of lecithin–cholesterol acyltransferase and liver function does occur.Citation23
Efficacy of edaravone administration
Since oxidative damages are indicated in the pathogenesis of ALS, administration of a free radical scavenger drug seems a rational therapeutic strategy for disease management. Indeed, we obtained a positive response to edaravone treatment in our phase II trial (60 mg/day five to six times a week for 6 months).Citation11 In the present study, edaravone was administered only one to four times a week for up to 6 months, since patients had joined this study independently. Among the 26 ALS patients, 17 received edaravone administration (30 mg/day, one to four times a week) for at least 3 months and 13 continued treatment for 6 months. Missing values of ΔALSFRS-R at 6 months for the four patients having an administration time between 3 and 6 months were estimated as twice the value of ΔALSFRS-R at 3 months. We observed a significant improvement in ΔALSFRS-R at 6 months in these patients as compared to that of edaravone-untreated patients,Citation11 as shown in Fig. (the P value of repeated-measures ANOVA was lower than 0.008). There was no significant difference in ALSFRS-R at month 0 between the two groups (the values are shown in the inset table in Fig. ).
Figure 1 Time course of changes of ALSFRS-R at 6 months with and without edaravone treatment (mean ± SE). Repeated-measures ANOVA shows a significant difference in ΔALSFRS-R between the two groups (P < 0.008). Inset table provides the raw ALSFRS-R values.
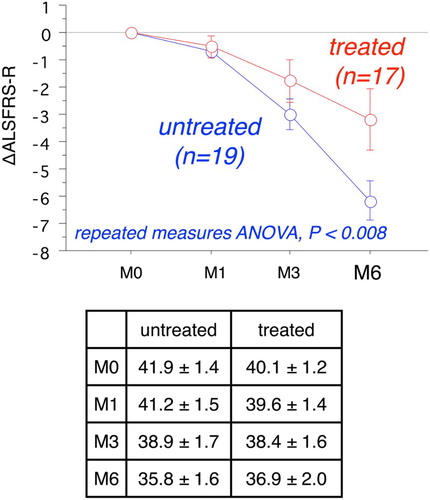
Based on the ΔALSFRS-R results at 6 months (Δ), patients were divided into three groups, a satisfactory progress group (Δ ≥ 0), an ingravescent group (Δ < −5), and a middle group (Δ = −1 to −4). Table shows there were six patients in the satisfactory progress group among the total 13 edaravone-treated patients (or 7 out of 17 treated patients), but none out of total 19 untreated patients. Further, there were three patients in the ingravescent group among the total 13 edaravone-treated patients (or 4 out of 17 treated patients), but there were 12 out of a total of 19 untreated patients. These data indicate that edaravone treatment may have a significant beneficial outcome for ALS patients.
Table 2 Classification of patients according to the value of ΔALSFRS-R (Δ) at 6 months in edaravone-treated and -untreated groups of ALS patients
Scavenging of peroxynitrite by edaravone
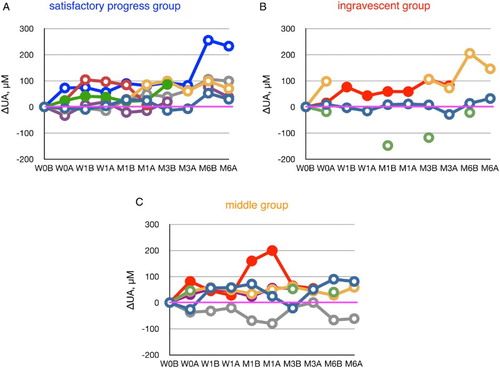
Keizman et al.Citation17 reported low levels of serum UA in patients with ALS. Of significance, UA levels in 36 patients out of 46 patients had decreased 6 months later, while those in 9 out of 46 patients were increased (one remained unchanged). Peroxynitrite is likely responsible for the predominant decline of UA, since VC and VE levels are identical in control subjects (Table ) and 3-nitrotyrosine was detected in CSF of patients with ALS. Edaravone administration increased the plasma levels of UA in 10 out of 12 ALS patients (Fig. ), and notably this occurred in five out of five subjects in the satisfactory progress group. We have previously reported that edaravone administration decreased 3-nitrotyrosine levels in the CSF of ALS patients.Citation11 We have also found that edaravone scavenges peroxynitrite approximately 30 times greater than does UA.Citation26 These results are consistent with our contention that scavenging of peroxynitrite by edaravone may contribute significantly toward inhibiting the progression of ALS.
Figure 2 The increase or decrease of plasma urate levels, calculated from values at week 0 (before edaravone administration), during the course of edaravone treatment in ALS patients. Patients were divided into a satisfactory progress group, an ingravescent group, and a middle group according to their values of ΔALSFRS-R determined at 6 months of treatment. W0B/A and W1B/A are data for week 0 and week 1 before (B) and after (A) edaravone treatment, respectively; M1–6B/A are data for months 1–6 before (B) and after (A) edaravone treatment. Data for patients for whom the month 6 observation was missing are indicated by solid symbols.
Effects of edaravone treatment on plasma markers of oxidative stress and tissue damage
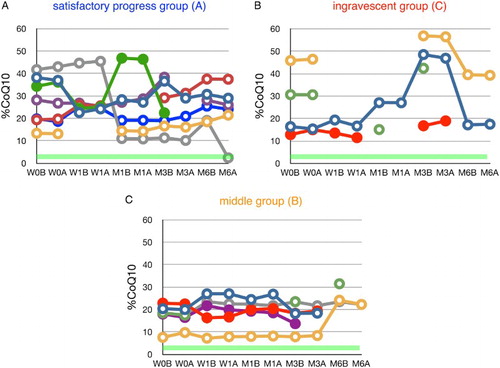
Edaravone had no significant effect on plasma VC levels (Fig. ) or plasma %CoQ10 (Fig. ), suggesting that the dosage of edaravone was insufficient to reduce circulatory oxidative stress. Therefore, additional treatment, such as CoQ10 administration, could be considered. It has been reported that CoQ10 supplementation reduced %CoQ10 and ameliorated the impairment of cholesterol metabolism in patients with juvenile fibromyalgia.Citation23
Figure 3 Time course of changes in plasma ascorbate (VC) during edaravone treatment in ALS patients. Patients were divided into three groups according to the value of ΔALSFRS-R at 6 months of treatment. The average VC level in age-matched healthy controls was 31.1 ± 21.0 µM (±SD, n = 55); this range is shaded in green. W0B/A and W1B/A are data for week 0 and week 1 before (B) and after (A) edaravone treatment, respectively; M1–6B/A are data for months 1–6 before (B) and after (A) edaravone treatment. Data for patients for whom the month 6 observation was missing are indicated by solid symbols.
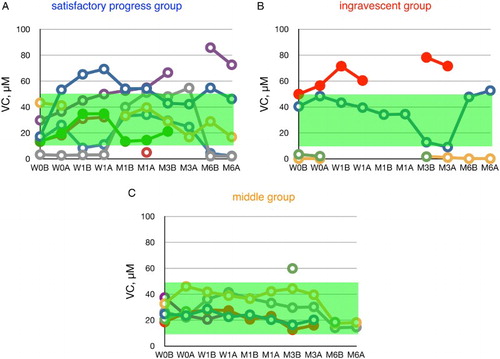
Figure 4 Time course of changes in the ratio of ubiquinone-10 to TQ10 (%CoQ10) during edaravone treatment in ALS patients. Patients were divided into three groups according to their values of ΔALSFRS-R determined at 6 months of treatment. Average %CoQ10 in age-matched healthy controls was 3.9 ± 1.3 (±SD, n = 55); this range is shaded in green. W0B/A and W1B/A are data for week 0 and week 1 before (B) and after (A) edaravone treatment, respectively; M1–6B/A are data for months 1–6 before (B) and after (A) edaravone treatment. Data for patients for whom the month 6 observation was missing are indicated by solid symbols.
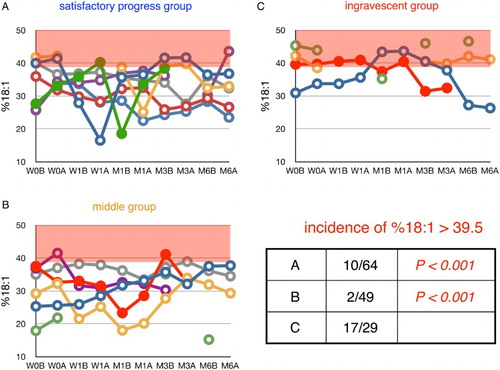
Figures – show the time course of changes in plasma markers of tissue oxidative damage, FFA, %PUFA, %16:1, and %18:1, respectively. Red background in Figs. , , and indicates values above the mean + 1 SD, while the red background in Fig. indicates values below the mean − 1 SD; such can thus be considered abnormal ranges. There were no significant differences in %PUFA among the satisfactory progress, middle, and ingravescent patient groups (Fig. ). However, there were significantly fewer excursions of FFA, %16:1, and %18:1 outside the range of the mean plus one standard deviation in the satisfactory progress group and middle group, compared to that of the ingravescent group (Figs. , , and ). These data support the idea that edaravone reduces oxidative tissue damage in the satisfactory progress group, but is not effective in the ingravescent group. Therefore, we contend additional treatment with other antioxidants such as coenzyme Q10 may be required to ameliorate oxidative damage in non-responders to edaravone treatment.
Figure 5 Time course of changes in plasma FFA during edaravone treatment in ALS patients. Patients were divided into three groups according to their values of ΔALSFRS-R determined at 6 months of treatment. FFA level in age-matched healthy controls was 457 ± 288 µM (average ± SD, n = 55); the region above this range is shaded in red. W0B/A and W1B/A are data for week 0 and week 1 before (B) and after (A) edaravone treatment, respectively; M1–6B/A are data for months 1–6 before (B) and after (A) edaravone treatment. Data for patients for whom the month 6 observation was missing are indicated by solid symbols. Inset table shows the incidence of FFA levels greater than 745 µM (=average + SD) and the P value (Fisher's exact probability test) versus data for the ingravescent group.
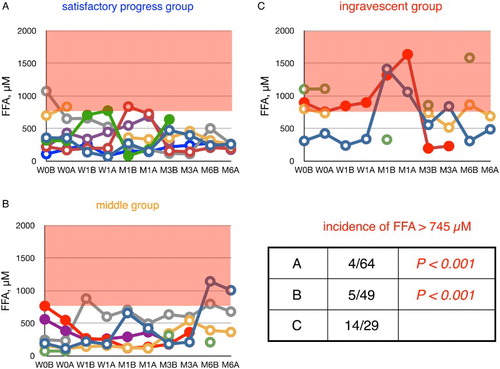
Figure 6 Time course of changes in plasma ratio of PUFA to total FFA (%PUFA) in ALS patients. Patients were divided into three groups according to their values of ΔALSFRS-R determined at 6 months of treatment. %PUFA in age-matched healthy controls was 23.6 ± 4.6% (average ± SD, n = 55); the region below this range is shaded in red. W0B/A and W1B/A are data for week 0 and week 1 before (B) and after (A) edaravone treatment, respectively; M1–6B/A are data for months 1–6 before (B) and after (A) edaravone treatment. Data for patients for whom the month 6 observation was missing are indicated by solid symbols. Inset table shows the incidence of %PUFA smaller than 19.0% (= average − SD) and the P value (Fisher's exact probability test) versus data for the ingravescent group.
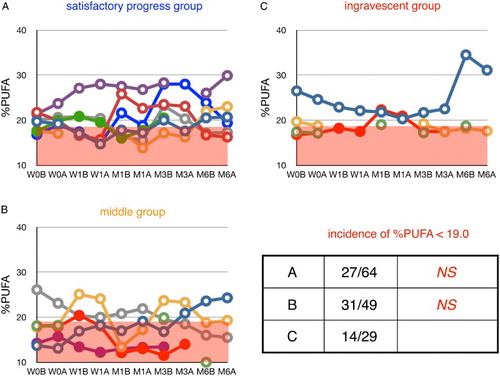
Figure 7 Time course of changes in plasma ratio of palmitoleic acid to total FFA (%16:1) during edaravone treatment in ALS patients. Patients were divided into three groups according to their values of ΔALSFRS-R determined at 6 months of treatment. %16:1 in age-matched healthy control was 3.9 ± 1.4% (average ± SD, n = 55); the region above this range is shaded in red. W0B/A and W1B/A are data for week 0 and week 1 before (B) and after (A) edaravone treatment, respectively; M1–6B/A are data for months 1–6 before (B) and after (A) edaravone treatment. Data for patients for whom the month 6 observation was missing are indicated by solid symbols. Inset table shows the incidence of %16:1 greater than 5.3% (=average + SD) and the P value (Fisher's exact probability test) versus data for the ingravescent group.
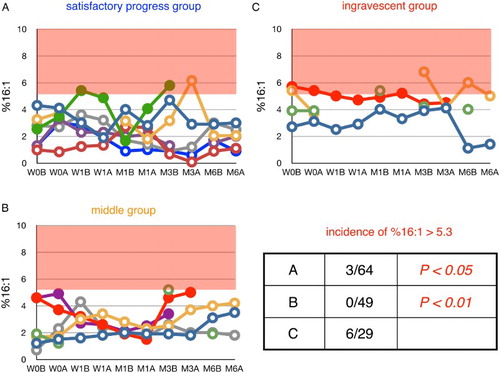
Figure 8 Time course of changes in plasma ratio of oleic acid to total FFA (%18:1) during edaravone treatment in ALS patients. Patients were divided into three groups according to their values of ΔALSFRS-R determined at 6 months of treatment. %18:1 in age-matched healthy controls was 34.4 ± 5.1% (average ± SD, n = 55); the region above this range is shaded in red. W0B/A and W1B/A are data for week 0 and week 1 before (B) and after (A) edaravone treatment, respectively; M1–6B/A are data for months 1–6 before (B) and after (A) edaravone treatment. Data for patients for whom the month 6 observation was missing are indicated by solid symbols. Inset table shows the incidence of %16:1 greater than 39.5% (=average + SD) and the P value (Fisher's exact probability test) versus data for the ingravescent group.
Conclusion
We observed an increase in %CoQ10, a decrease in UA levels, and a reduction of %PUFA occur in the pathophysiology of ALS patients, consistent with increased oxidative stress. Administration of edaravone, a potent radical and a peroxynitrite scavenger, significantly reduced disease progression, as compared to that of untreated patients. It also increased plasma UA by scavenging peroxynitrite in ALS patients. However, edaravone treatment did not reduce the plasma %CoQ10. Co-treatment of edaravone with other antioxidants such as coenzyme Q10 might be beneficial for non-responders to edaravone treatment.
Disclaimer statements
Contributors All authors contributed equally.
Funding None.
Conflicts of interest The authors have not received any financial support or other benefit from commercial sources for the work reported herein. None of the authors have financial interests that could create a potential conflict of interest or the appearance of a conflict of interest with regard to this work.
Ethics approval The study protocols were approved by the Ethical Committee of Tokyo University of Technology and samples from patients were obtained in accordance with the Helsinki Declaration of 1964, as revised in 2001.
Acknowledgments
We are grateful especially to Drs Makoto Sohmiya and Hiroo Wada for recruiting healthy control subjects for use in previous studies.Citation8,Citation15,Citation16 We thank Dr Walter C. Dunlap for contribution to the presentation of this manuscript.
References
- Rowland LP, Shneider NA. Amyotrophic lateral sclerosis. N Engl J Med 2001;344:1688–700. doi: 10.1056/NEJM200105313442207
- Chio A, Logroscino G, Hardiman O, Swingler R, Mitchell D, Beghi E, et al. Prognostic factors in ALS: a critical review. Amyotroph Lateral Scler 2009;10:310–23. doi: 10.3109/17482960802566824
- Barber SC, Mead RJ, Shaw PJ. Oxidative stress in ALS: a mechanism of neurodegeneration and a therapeutic target. Biochim Biophys Acta 2006;1762:1051–67. doi: 10.1016/j.bbadis.2006.03.008
- Beal MF, Ferrante RJ, Browne SE, Matthews RT, Kowall NW, Brown RH, Jr. Increased 3-nitrotyrosine in both sporadic and familial amyotrophic lateral sclerosis. Ann Neurol 1997;42:644–54. doi: 10.1002/ana.410420416
- Ferrante RJ, Browne SE, Shinobu LA, Bowling AC, Baik MJ, MacGarvey U, et al. Evidence of increased oxidative damage in both sporadic and familial amyotrophic lateral sclerosis. J Neurochem 1997;69:2064–74. doi: 10.1046/j.1471-4159.1997.69052064.x
- Pacher P, Beckman JS, Liaudet L. Nitric oxide and peroxynitrite in health and disease. Physiol Rev 2007;87:315–424. doi: 10.1152/physrev.00029.2006
- Tohgi H, Abe T, Yamazaki K, Murata T, Ishizaki E, Isobe C. Remarkable increase in cerebrospinal fluid 3-nitrotyrosine in patients with sporadic amyotrophic lateral sclerosis. Ann Neurol 1999;46:129–31. doi: 10.1002/1531-8249(199907)46:1<129::AID-ANA21>3.0.CO;2-Y
- Sohmiya M, Tanaka M, Suzuki Y, Tanino Y, Okamoto K, Yamamoto Y. An increase of oxidized coenzyme Q-10 occurs in the plasma of sporadic ALS patients. J Neurol Sci 2005;228:49–53. doi: 10.1016/j.jns.2004.09.030
- Edaravone Acute Infarction Study Group. Effect of a novel free radical scavenger, edaravone (MCI-186), on acute brain infarction: randomized, placebo-controlled, double-blind study at multicenters. Cerebrovasc Dis 2003;15:222–9. doi: 10.1159/000069318
- Yamamoto Y, Kuwahara T, Watanabe K, Watanabe K. Antioxidant activity of 3-methyl-1-phenyl-2-pyrazolin-5-one (MCI-186). Redox Rep 1996;2:333–8.
- Yoshino H, Kimura A. Investigation of the therapeutic effects of edaravone, a free radical scavenger, on amyotrophic lateral sclerosis (Phase II study). Amyotroph Lateral Scler 2006;7:241–5. doi: 10.1080/17482960600664870
- Yamashita S, Yamamoto Y. Simultaneous detection of ubiquinol and ubiquinone in human plasma as a marker of oxidative stress. Anal Biochem 1997;250:66–73. doi: 10.1006/abio.1997.2187
- Yamamoto Y, Ames BN. Detection of lipid hydroperoxides and hydrogen peroxide at picomole levels by an HPLC and isoluminol chemiluminescence assay. Free Radic Biol Med 1987;3:359–61. doi: 10.1016/S0891-5849(87)80048-5
- Yamamoto Y, Nagata Y, Katsurada M, Sato S, Ohori Y. Changes in rat plasma free fatty acids composition under oxidative stress induced by carbon tetrachloride: decrease of polyunsaturated fatty acids and increase of palmitoleic acid. Redox Rep 1996;2:121–5.
- Wada H, Hagiwara S, Goto H, Yamamoto Y. Redox status of coenzyme Q10 is associated to chronological age. J Am Geriatr Soc 2007;55:1141–2. doi: 10.1111/j.1532-5415.2007.01209.x
- Wada H, Hagiwara S, Saitoh E, Ieki E, Yamamoto Y, Adcock IM, et al. Up-regulation of blood arachidonate (20:4) levels in patients with chronic obstructive pulmonary disease, Biomarkers 2012;17:520–3. doi: 10.3109/1354750X.2012.692393
- Keizman D, Ish-Shalom M, Berliner S, Maimon N, Vered Y, Artamonov I, et al. Low uric acid levels in serum of patients with ALS: further evidence for oxidative stress? J Neurol Sci 2009;285:95–9. doi: 10.1016/j.jns.2009.06.002
- Stocker R, Yamamoto Y, McDonagh AF, Glazer AN, Ames BN. Bilirubin is an antioxidant of possible physiological importance. Science 1987;235:1043–6. doi: 10.1126/science.3029864
- Gutteridge JMC, Quinlan GJ, Yamamoto Y. Are fatty acid patterns characteristic of essential fatty acid deficiency indicative of oxidative stress? Free Radic Res 1998;28:109–14. doi: 10.3109/10715769809065796
- Quinlan GJ, Lamb NJ, Evans TW, Gutteridge JMC. Plasma fatty acid changes and increased lipid peroxidation in patients with adult respiratory distress syndrome. Crit Care Med 1996;24:241–6. doi: 10.1097/00003246-199602000-00010
- Love WC, Cashell A, Reynolds M, Callaghan N. Linoleate and fatty-acid patterns of serum lipids in multiple sclerosis and other diseases. Br Med J 1974;6:18–21. doi: 10.1136/bmj.3.5922.18
- Battino M, Ferreiro MS, Quiles JL, Bompadre S, Leone L, Bullon P. Alterations in the oxidation products, antioxidant markers, antioxidant capacity and lipid patterns in plasma of patients affected by Papillon–Lefevre syndrome. Free Radic Res 2003;37:603–9. doi: 10.1080/1071576031000083116
- Miyamae T, Seki M, Naga T, Uchino S, Asazuma H, Yoshida T, et al. Increased oxidative stress and coenzyme Q10 deficiency in juvenile fibromyalgia: amelioration of hypercholesterolemia and fatigue by ubiquinol-10 supplementation, Redox Rep 2013;18:12–9. doi: 10.1179/1351000212Y.0000000036
- Hara K, Yamashita S, Fujisawa A, Ogawa T, Yamamoto Y. Oxidative stress in newborn infants with and without asphyxia as measured by plasma antioxidants and free fatty acids. Biochem Biophys Res Commun 1999;257:244–8. doi: 10.1006/bbrc.1999.0436
- Yamamoto Y, Yanagisawa M, Tak NW, Watanabe K, Takahashi C, Fujisawa A, et al. Repeated edaravone treatment reduces oxidative cell damage in rat brain induced by middle cerebral artery occlusion. Redox Rep 2009;14:251–8. doi: 10.1179/135100009X12525712409779
- Fujisawa A, Yamamoto Y. Edaravone, a potent free radical scavengerat, reacts with peroxynitrite to produce predominantly the 4-NO-edaravone. Redox Rep, 2015; [Epub ahead of print].